Quantifying the Dynamics of Field Cancerization in Tobacco-Related Head and Neck Cancer: A Multiscale Modeling Approach
←
→
Page content transcription
If your browser does not render page correctly, please read the page content below
Published OnlineFirst October 20, 2016; DOI: 10.1158/0008-5472.CAN-16-1054

                                                                                                                                      Cancer
  Integrated Systems and Technologies: Mathematical Oncology                                                                          Research

Quantifying the Dynamics of Field Cancerization
in Tobacco-Related Head and Neck Cancer:
A Multiscale Modeling Approach
Marc D. Ryser1, Walter T. Lee2,3, Neal E. Ready4, Kevin Z. Leder5, and Jasmine Foo6

Abstract
   High rates of local recurrence in tobacco-related head and                     dence of the local field size on age at diagnosis, with a doubling
neck squamous cell carcinoma (HNSCC) are commonly attrib-                         of the expected field diameter between ages at diagnosis of 50
uted to unresected fields of precancerous tissue. Because they                     and 90 years, respectively. Similarly, the probability of harbor-
are not easily detectable at the time of surgery without addi-                    ing multiple, clonally unrelated fields at the time of diagnosis
tional biopsies, there is a need for noninvasive methods to                       was found to increase substantially with patient age. On the
predict the extent and dynamics of these fields. Here, we                          basis of these findings, we hypothesized a higher recurrence risk
developed a spatial stochastic model of tobacco-related                           in older than in younger patients when treated by surgery alone;
HNSCC at the tissue level and calibrated the model using a                        we successfully tested this hypothesis using age-stratified out-
Bayesian framework and population-level incidence data from                       come data. Further clinical studies are needed to validate the
the Surveillance, Epidemiology, and End Results (SEER) regis-                     model predictions in a patient-specific setting. This work high-
try. Probabilistic model analyses were performed to predict the                   lights the importance of spatial structure in models of epithelial
field geometry at time of diagnosis, and model predictions of                      carcinogenesis and suggests that patient age at diagnosis may be
age-specific recurrence risks were tested against outcome data                     a critical predictor of the size and multiplicity of precancerous
from SEER. The calibrated models predicted a strong depen-                        lesions. Cancer Res; 76(24); 1–11. 2016 AACR.

                                                                                  Introduction
  Major Findings                                                                     Head and neck squamous cell carcinoma (HNSCC) arises in the
    Patient age at diagnosis was found to be a critical predictor                 epithelial lining of the oral cavity, pharynx, and larynx. The annual
  of the size and multiplicity of precancerous lesions. This                      incidence rate of HNSCC is estimated to be around 600,000 new
  finding challenges the current one-size-fits-all approach to                      cases worldwide (1), and in the United States alone, the death toll
  surgical excision margins.                                                      is approximately 11,500 cases per year (2). While a subgroup of
                                                                                  HNSCC, including the oropharynx, is caused by infection with
                                                                                  high-risk types of the human papillomavirus (HPV; ref. 3), the
                                                                                  majority of HNSCC are HPV-negative and primarily associated
                                                                                  with tobacco use and alcohol consumption (1). Despite a growing
                                                                                  number of therapeutic strategies, survival in HPV-negative
                                                                                  HNSCC has not improved significantly over the past decades,
                                                                                  with a low median survival of approximately 20 months (4).
1
  Duke University, Department of Mathematics, Durham, North Carolina. 2Division      Poor prognosis in tobacco-related head and neck cancers is
of Head and Neck Surgery & Communication Sciences, Duke University School of      commonly attributed to the development of local recurrences and
Medicine, Durham, North Carolina. 3Section of Otolaryngology-Head and Neck        metastases after removal of the primary tumor (1). Field cancer-
Surgery, Durham VA Medical Center, Durham, North Carolina. 4Division of
Medical Oncology, Duke University School of Medicine, Durham, North Carolina.
                                                                                  ization, or the presence of premalignant fields surrounding the
5
  Department of Industrial & Systems Engineering, University of Minnesota,        primary tumor, has been shown to drive the high rate of local
Minneapolis, Minnesota. 6School of Mathematics, University of Minnesota, Min-     recurrence (5–11). In fact, molecular studies have shown that the
neapolis, Minnesota.                                                              majority of HPV-negative HNSCC develop within local fields of
Note: Supplementary data for this article are available at Cancer Research        premalignant cells that are clonally related to the resected primary
Online (http://cancerres.aacrjournals.org/).                                      cancer (7, 9). These fields can be much larger than the actual
Corresponding Authors: Jasmine Foo, Department of Mathematics, University         carcinoma and are generally difficult to detect without genomic
of Minnesota, 240 Vincent Hall, 206 Church St. SE, Minneapolis, MN 55455.         analyses due to their visually normal appearance (12). If such an
Phone: 612-625-0131; Fax: 612-626-2017; E-mail: jyfoo@umn.edu; and Marc D.        invisible premalignant field extends beyond the surgical margins,
Ryser, Department of Mathematics, Duke University, 120 Science Drive, 117         the portion of the field left behind after resection of the primary
Physics Building, Durham, NC 27708. Phone: 919-669-2847; Fax: 919-660-            tumor increases the risk of subsequent recurrence and contributes
2821; E-mail: ryser@math.duke.edu
                                                                                  to poor prognosis (11). The occurrence of precancerous fields was
doi: 10.1158/0008-5472.CAN-16-1054                                                first reported by Slaughter and colleagues (5) and has since been
2016 American Association for Cancer Research.                                   documented in most epithelial cancers (10, 13–15).

www.aacrjournals.org                                                                                                                                      OF1

       Downloaded from cancerres.aacrjournals.org on February 5, 2021. © 2016 American Association for Cancer
                                                     Research.
Published OnlineFirst October 20, 2016; DOI: 10.1158/0008-5472.CAN-16-1054
Ryser et al.
Quick Guide to Equations and Assumptions
Model Assumptions
We developed and calibrated a spatial stochastic model of tobacco-related head and neck squamous cell carcinoma at the tissue
level. The major model assumptions are:
*
(Epi)genetic events lead to mutated cells with increased fitness advantage, and mutant clones can spread through the basal layer
of the affected epithelium prior to onset of invasive cancer.
*
Because of the time scales of carcinogenesis, only long-lived progenitor cells in the basal layer of the epithelium are relevant; this
monolayer of progenitor cells is modeled as a two-dimensional lattice, where each node is occupied by a cell.
*
Wild-type and mutant progenitor cells undergo evolutionary competition in the basal layer; only nearest-neighbor interactions
are considered.
*
Tissue architecture and homeostasis are maintained (constant population size) until the invasive cancer stage.
Key Model Parameters
Total population size (N); cellular transition rates from normal to precancer (u1 ) and from precancer to carcinoma in situ (u2 ),
respectively; relative proliferative advantage of precancer (s1 ) and carcinoma in situ cells (s2 ); mean sojourn time from preclinical
lesion to clinical diagnosis with cancer (1=c).
Key Equations
We were interested in quantifying the geometry of the field of precancerous cells surrounding the tumor at time of diagnosis (s 3 ).
The key equations are:
(i) The survival function (probability that cancer has not been diagnosed by time (t) of the model,
Z t
l
Sðt Þ ¼ ect þ cect exp 1=3
g 1=3; t 3 lt þ ct dt;
0 3
where g is the incomplete gamma function, l Nu1 s1 and u2 s2 pc22 ðs1 Þ=3:
(ii) Conditioned on diagnosis occurring at time t, the probability density function of the radius of the precancer field that
surrounds the primary tumor,
Z t
clz zðr c2 ðt sÞÞ3 g ð1=3; s3 Þ
PðRl ðt Þ ¼ rj s 3 ¼ tÞ ¼ 1str=c2 ðr c2 ðt sÞÞ2 exp þl s cðt sÞ ds
S'ðt Þ 0 3 3 1=3
for all r 2 ½0; c2 t, and zero otherwise, where c2 is the radial expansion speed of the precancer field and z 3=c32 :
(iii) Conditioned on diagnosis occurring at time t, the probability of harboring two or more clonally unrelated precancer fields is
Z
lceðcþlÞt t
1 es eð2lþcÞs ds:
3
PðMðt Þ > 1j s 3 ¼ tÞ ¼ 1
S'ðt Þ 0
Model Calibration
The microscopic tissue-level models were calibrated on the basis of population-level incidence data. Using a computational
Bayesian framework, we determined the posterior distributions for the identifiable parameters l, ; and c: On the basis of the
posterior distributions, we derived model-based predictions of field quantities at time of diagnosis.
To date, it remains difficult to account for the phenomenon of tissue in absence of any information on the extent of the suspected
field cancerization in clinical practice. The main reason for this field. To overcome this barrier, we synthesized data and knowl-
translational barrier is a poor understanding of the dynamics and edge sources from the tissue, clinical and population scales to
geometry of these invisible fields. Indeed, it is impossible to develop a quantitative model of HNSCC carcinogenesis that
account for the risk factor of an unresected field of precancerous accounts for spatial features of the precancer field. On the basis
OF2 Cancer Res; 76(24) December 15, 2016 Cancer Research
Downloaded from cancerres.aacrjournals.org on February 5, 2021. © 2016 American Association for Cancer
Research.Published OnlineFirst October 20, 2016; DOI: 10.1158/0008-5472.CAN-16-1054
Dynamics of Field Cancerization
of this model, we then sought to identify aspects of standard starts expanding, further hits to the EGFR or TGFb pathways can
clinical practice that could be improved by means of patient- lead to moderate dysplasia, CIS, and eventually invasive HNSCC.
specific modeling tools.
Microscopic model of carcinogenesis
To capture the spatial dynamics of the above mechanisms of
Materials and Methods carcinogenesis, we developed a stochastic Moran model on a
Biological mechanism of carcinogenesis regular two-dimensional lattice (27, 28). Initially, all cells on the
To model the carcinogenesis of tobacco-related HNSCC, we lattice are normal progenitor cells (type 0) and proliferate at rate
first developed a spatial stochastic model of homeostasis in f0. Cell division is stochastic, and when a progenitor cells divides,
stratified squamous epithelia of the head and neck. The homeo- one daughter cell replaces the mother cell, and the other daughter
static epithelia of this region undergo periodic bottom–up renew- cell replaces one of the nearest neighbor cells on the lattice, chosen
al (16), whereby long-lived progenitor cells in the basal layer of uniformly at random. Each normal cell can, at rate u1,a, acquire a
the epithelium give rise to transit amplifying cells (TAC) of limited mutation to become a mildly dysplastic cell (type 0 ). At the tissue
proliferative potential (17, 18). As they divide, the TAC move level, this leads to a patch of dysplasia as illustrated in the first
toward the superficial layers of the stratified epithelium, where panel of Fig. 1C. The proliferation rate of type 0 cells is still f0, but
they eventually exit the cell cycle and get sloughed off at the tissue acquisition of a second hit, at cellular rate u1,b, can transform type
surface. Because differentiating TAC are lost from the tissue within 0 cells into precancerous cells (type 1). Type 1 cells in turn have a
a few weeks (16), they are unlikely to contribute to the emergence proliferative advantage f1 ¼ f0 (1 þ s1) over type 0 and type 0 cells
of a neoplastic clone of cells, and it suffices to focus on the and can clonally expand as precancerous fields of moderate
population of progenitor cells in the bottom layer of the dysplasia by replacing neighboring cells of lower proliferative
epithelium. potential, see second panel in Fig. 1C. Mathematically, we can
The transformation from normal to cancerous cells is largely simplify the model by deriving the effective mutation rate u1 from
attributed to the successive accumulation of (epi)genetic aberra- type 0 to type 1 cells: the probability 01 that a type 0 cell gives rise
tions, see Fig. 1A. Once a normal progenitor cells has acquired a to growing field of type 1 cells before its progeny dies out is given
growth advantage, the resulting clone of mutant cells starts by (27)
spreading across the affected epithelium by replacing adjacent 1=2 1=2
01 p1=2 u1;bs1 log 1=u1;bs1 ðAÞ
cells of lower proliferative potential (19). There are a multitude of
genetic alterations commonly found in HPV-negative HNSCC
where s1 ¼ 1 þs1 s . At rate u2 , type 1 cells in turn can mutate into
(1), but both the total number and temporal ordering of events 1
necessary for cancer initiation are patient- and tumor-specific malignant (type 2) cells that initiate growth of cancer, see third
(20). In view of this genotypic heterogeneity, we focused on the panel in Fig. 1C. Cancer cells have a fitness advantage of s2 over
phenotypic progression instead. Indeed, the majority of tobacco- type 1 cells and hence divide at rate f2 ¼ f1 (1 þ s2). Finally, the
related HNSCC progress through a series of precancerous stages time between onset of CIS and diagnosis was modeled as an
called epithelial dysplasia, see Fig. 1B (21, 22). These stages are exponentially distributed random variable with rate c, see Fig. 1B.
histopathologically classified into three categories: mild, moder- The reason for this simplified transition model from first cancer
ate, and severe dysplasia [carcinoma in situ (CIS); ref. 23]. On the cell to diagnosis is two-fold. First, upon penetration of the
basis of this observation, we modeled neoplastic progression at basement membrane and infiltration of the stroma, the epithelial
the cellular level in four stages (Fig. 1A), developing from normal architecture is irreversibly disrupted and the microscopic dynam-
cells (type 0) into mildly dysplastic cells (type 0 ), into moder- ics with lateral displacement no longer apply; second, depending
ately dysplastic cells (type 1), and eventually into severely dys- on the location of the lesion and the patient's behavior, time to
plastic cells (type 2). clinical diagnosis can be highly variable.
Although the number and ordering of mutations responsible
for HNSCC carcinogenesis are not unique, a better understanding Mesoscopic model approximation
of the genetic underpinnings and fitness landscapes of the phe- We previously derived the following mesoscopic approxima-
notypic transitions enhances the mechanistic foundation of the tion to the spatial model that enables analytical calculations of
model, see Fig. 1A. It is generally accepted that loss of function of waiting times and field geometries (28, 29). In the mesoscopic
the tumor suppressor gene TP53, either through mutation or loss model, the arrival of expanding type 1 clones is a stochastic
of heterozygosity, is an early event during tumorigenesis of Poisson process with rate Nu1 s1 . The factor s1 accounts for the
HNSCC. Indeed, histopathologic studies have found that expand- fact that the progeny of a new type 1 cell will either fluctuate to
ing cancer fields are preceded by small TP53-mutated patches extinction with probability 1 s1 or expand indefinitely with
( 0:5, we found
emergence of an expanding precancer field (26). Once the field an approximately linear dependence c2 ðs1 Þ 0:6s1 þ0:22 (29).
www.aacrjournals.org Cancer Res; 76(24) December 15, 2016 OF3
Downloaded from cancerres.aacrjournals.org on February 5, 2021. © 2016 American Association for Cancer
Research.Published OnlineFirst October 20, 2016; DOI: 10.1158/0008-5472.CAN-16-1054
Ryser et al.
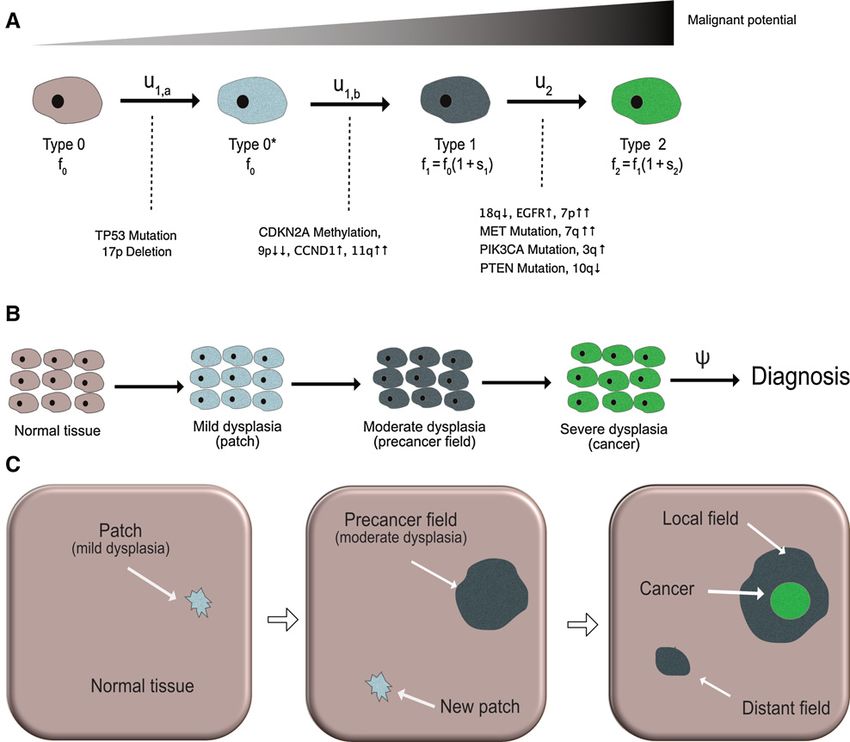
Figure 1.
Stochastic model of carcinogenesis in HPV-negative HNSCC. A, At the cellular level, accumulation of genetic alterations leads to increasingly malignant phenotypes.
The cellular mutation rates between normal (type 0), dysplastic (type 0 , type 1), and cancerous (type 2) cells are indicated above the solid arrows. The
type-specific proliferation rates fi depend on the relative selective advantages si as specified. Genetic events associated with the phenotypic transitions are
listed below the solid transition arrows (see eq. A); the number and temporal ordering of these events is not unique. B, At the tissue level, carcinogenesis manifests
itself through the emergence of a patch of mild dysplasia, which can give rise to a field of moderate dysplasia (the precancer field). The first viable cancer
cell arises within the growing precancer field, leading to carcinoma in situ and eventually invasive HNSCC. The time between cancer initiation and diagnosis is
modeled as an exponential random variable with rate c. C, At the organ level, a possible scenario of carcinogenesis is illustrated in three consecutive snapshots.
Left, a small patch of mild dysplasia (neutral evolution) appears in the normal tissue. Middle, the patch gives rise to a positively selected precancer field that
expands into the normal epithelium; clonally unrelated patches of mild dysplasia may arise at any time. Right, the precancer field that gives rise to the
primary tumor is called the local field, whereas the clonally independent precancer field that starts growing is referred to as a distant field.
Finally, we note that multiple precancer fields of type 1 cells can Registries, 2000–2012) in a Bayesian framework. As we focused
coexist as illustrated in Fig. 1C. on HPV-negative cancers, we restricted our search to males and
females diagnosed with malignant tumors in the following cat-
Incidence data egories of "Site Recode ICD-O-3/WHO 2008": lip, tongue, floor of
To parameterize the tissue-level model and ensure its compat- mouth, gum and other mouth, hypopharynx, and larynx (31). We
ibility with population-level data, we calibrated the mesoscopic further excluded cases with primary site labeled as "C01.9-Base of
approximation of the microscopic model on the basis of age- tongue" because cancers at this site are commonly HPV-positive
specific incidence rates from the Surveillance, Epidemiology, and (32). We derived the number of susceptible individuals and the
End Results (SEER) program of the National Cancer Institute (18 number of cancer cases diagnosed in each of the following age
OF4 Cancer Res; 76(24) December 15, 2016 Cancer Research
Downloaded from cancerres.aacrjournals.org on February 5, 2021. © 2016 American Association for Cancer
Research.Published OnlineFirst October 20, 2016; DOI: 10.1158/0008-5472.CAN-16-1054
Dynamics of Field Cancerization
where
u2s2 pc22 ðs1 Þ
l Nu1s1 ; ; ðCÞ
3
Rx
gða; xÞ ¼ 0 ta1 et dt is the lower incomplete G -function, and c is
the transition rate from onset of CIS to diagnosis. The parameter
groups (eq. C) have the following interpretation: l is the initiation
rate of expanding type 1 clones, see also previous paragraph; can
1=3
be rewritten as ðgt3 2
2 Þ=3, where t2 ¼ ðc2 u2 s2 Þ is approximately
the time it takes for an expanding type 1 clone to give rise to an
expanding type 2 clone (28). On the basis of SðtÞ; we then
computed the hazard function hðtÞ ¼ S0 ðtÞ=SðtÞ, which provides
a direct link to the SEER-derived age-specific incidence rates. The
derivation of the likelihood function used for inference is outlined
in Supplementary Information S1.
We then used a computational Markov Chain Monte Carlo
(MCMC) Metropolis Hastings algorithm to derive posterior
distributions for the parameters l, , and c. We used improper
priors over ½0; ¥ for all 3 parameters and ran a Markov chain of
length 500,000. Computations were performed in MATLAB
(Version 8.5.0, The MathWorks Inc. 2015). To determine plau-
sible initial conditions and step lengths for the MCMC algo-
rithm, we independently estimated the 3-parameter groups
based on literature estimates of the underlying biologic para-
meters, see Supplementary Information S2. After discarding the
Figure 2. first 50,000 burn-in steps, we sampled every 100th step to
MCMC summary. MCMC Metropolis Hastings algorithm was used to infer the characterize the posterior distributions. Convergence to steady-
posterior distribution of the model parameters l, , and c. A total of 500,000 state was visually ascertained. Credible intervals (CI; 95%)
iterations were computed; the first 50,000 burn-in iterations were discarded
for the posterior distributions were computed by discarding
and then 1 in 100 samples was used to estimate the posterior distribution. A,
Model fit to SEER data; age-specific incidence is restricted to smokers (see main the 2.5% largest and smallest values for each parameter. The
text for details). The data point at 85 years reflects the incidence estimate for marginals of the posterior distributions for l, ; and c are
patients aged 85 years and older. B, Marginal distributions of l, , and c. summarized in Fig. 2B. Median estimates and 95% CIs of the
posterior distributions, together with the literature-based order
of magnitude estimates are summarized in Table 1. Goodness
groups: 15–19 years, 20–24 years,. . ., 80–84 years, and 85þ years. of fit was deemed satisfactory on the basis of visual inspection,
We note that the age-specific incidence curve for HPV-negative see Fig. 2A.
HNSCC has a peaked profile, see Fig. 2A. However, the model To compare model predictions with clinical recurrence pat-
developed here predicts monotonically increasing incidence rates terns, SEER (13 Registries, 1991–2011) was queried for a
and thus cannot recapitulate peaked incidence patterns. Because retrospective analysis of the recurrence risk in patients diag-
changing baseline risks are more likely to cause the peaked nosed and treated for HNSCC lesions of size 3 cm. Data
profile than changes in biological parameters (see Supplemen- extraction was performed using an MP-SIR session with the
tary Information S1), we truncated the incidence data used for software SEER Stat (http://seer.cancer.gov/seerstat). Again, we
parameter inference at the age of 74 years instead of introduc- focused on the predominantly HPV-negative sites as specified
ing additional age-dependent model parameters. The vast under "Model calibration." Only patients aged 18 to 85 years at
majority of HPV-negative HNSCC are attributed to tobacco diagnosis with a known tumor size of 30 mm were included.
consumption (33, 34); thus, we reduced the pool of susceptible Patients with unknown surgery status, unknown radiation
individuals to the approximately 20% of current smokers status, and those identified at autopsy or on death certificate
within the considered age groups (35). Furthermore, we only were excluded. The following categorical variables were
assumed the exposure to start at the age of 15 years (36, 37). extracted from the dataset: age at diagnosis (younger: 18–49
years, older: 50–85 years) and treatment (surgery only, radia-
Parameter inference tion only, surgery and radiation). For each patient, the time
To compare the model predictions with SEER data, we first from diagnosis to recurrence (defined as second malignant
derived the age-specific incidence function under the evolutionary event in any of the included head and neck sites), death, or
model at the tissue-level. To this end, we defined the random censoring (defined as the minimum of end-of-study, loss to
variable s 3 as the time from mean age at smoking initiation to follow-up, and 10 years) was calculated. For each of the three
diagnosis with invasive cancer and calculated the survival function treatment groups with known treatment status, a univariate
Cox proportional hazards regression for recurrence was per-
Sðt Þ Pðs 3 t Þ ¼
Z t formed on the basis of the categorical age at diagnosis variable,
l
ect þ cect exp g 1=3; t 3
lt þ ct dt; ðBÞ stratified into younger (Published OnlineFirst October 20, 2016; DOI: 10.1158/0008-5472.CAN-16-1054
Ryser et al.
Table 1. Parameter estimates: MCMC and literature-based
Parameter Units Prior Median (95% CI) Literature estimates
l [y1] ½0; ¥ 4.3 103 (4.0 103–4.8 103) 103
q [y3] ½0; ¥ 5.9 106 (4.4 106–7.9 106) 104
c [y1] ½0; ¥ 9.8 102 (6.7 102–13.5 102) 101
NOTE: For each parameter, the median and 95% CIs for the MCMC Metropolis-Hastings–derived posterior distributions and the literature-based estimates are shown.
results. Hazard ratios with 95% CIs were computed, and all P compute the probability density function of the local field
values were calculated as two-sided with significance declared radius as follows:
for P values below 0.05. Computations were performed in R Z t
clz
(http://www.R-project.org). PðRl ðtÞ¼ rj s 3 ¼ tÞ ¼ 1str=c2 ðr c2 ðt sÞÞ2
S'ðtÞ 0
zðr c2 ðt sÞÞ3 gð1=3; s3 Þ
exp þl 1=3
s cðt sÞ ds; ðDÞ
Results 3 3
Local field size at diagnosis
To characterize the field geometry at time of diagnosis where z 3=c32 . We refer to Supplementary Information S3
with invasive cancer, we first derived the size distribution of for details of the calculation. The corresponding density
the local field. More precisely, denoting the radius of the functions (eq. D) for ages at diagnosis of 40, 60, and 80
local field at time t by Rl ðtÞ, we conditioned on fs 3 ¼ tg to years are shown in Fig. 3A. Unfortunately, these results have
Figure 3.
Field characteristics as a function of age at diagnosis. A, Probability density function of the field radius at diagnosis is shown for patient ages 40, 60, and 80
years, respectively. Calculations were performed using the median posterior values of l, ; and c as shown in Table 1, and c2 ¼ 0:4 (see also Supplementary
Information S2). B, On the basis of the posterior distributions, the statistics of the relative mean field radius (RMFR) for different ages at diagnosis were computed.
Median and 95% CIs are shown. C, Probability distribution of the number of distant fields is shown for patient ages 40, 60, and 80 years, respectively.
Parameter values as in A. D, Probability of multiple unrelated fields at time of diagnosis was computed on the basis of the posterior distributions. Median
and 95% CIs are shown.
OF6 Cancer Res; 76(24) December 15, 2016 Cancer Research
Downloaded from cancerres.aacrjournals.org on February 5, 2021. © 2016 American Association for Cancer
Research.Published OnlineFirst October 20, 2016; DOI: 10.1158/0008-5472.CAN-16-1054
Dynamics of Field Cancerization
an explicit dependence on the radial growth rate of the pre- least 2 clonally unrelated fields in the head and neck region at
cancer field, c2 ðs1 Þ, which cannot be directly estimated due to time of diagnosis,
identifiability constraints (we used literature-based estimates PðMðt Þ>1j s 3 ¼ tÞ
instead). To overcome this issue, we focused on the relative Z ðEÞ
lceðcþlÞt t 3
size of a precancerous field compared with the field size at ¼1 1 es eð2lþcÞs ds:
the age of 50 years. More precisely, we introduced the S'ðt Þ 0
relative mean field radius (RMFR), defined as the mean field
Accounting for the posterior distributions of the parameter
radius at a given age divided by the mean field radius at age
groups, the probability of harboring at least one distant field is
50 years. Indeed, the RMFR is completely specified by the
shown as a function of age at diagnosis in Fig. 3D. The model
inferred parameters l, and c and does not explicitly
predicts that the probability (95% CI) of harboring at least one
depend on c2 (see Supplementary Information S3). On the
distant field increases by one order of magnitude from 2.1%
basis of the posterior distributions from the Bayesian infer-
(2.0%–2.4%) at 20 years of age to 20.0% (18.6%–22.7%) at
ence, we computed the RMFR as a function of patient age at
80 years of age.
diagnosis in Fig. 3B. The model predicted an approximately
linear increase in RMFR between the ages of 20 and 90 years,
Age-specific recurrence patterns
and the median (95% CI) RFMR at age 90 was found to be
To test the validity of our model, we made model-based
1.90 (1.88–1.93).
predictions and tested them against outcome data from SEER.
The first prediction was based on the fact that current clinical
Multiple fields at diagnosis practice recommends an age-independent excision margin width
In addition to the local field size at diagnosis, we estimated of 1 cm (38, 39). Considering the predicted increase of local field
the probability of harboring distant fields in addition to the size with age at diagnosis (Fig. 3A), an age-independent margin
local field. The exact distribution of the total number MðtÞ of width implies that, for the same tumor size, the area of precan-
clonally independent fields, including the local and all distant cerous tissue left behind after resection of a primary tumor is
fields, is found in Supplementary Information S3. In Fig. 3C, bigger in older patients (with larger precancer fields) than in
the probability distribution for the number of multiple fields is younger patients (with smaller precancer fields), see Fig. 4. This
shown for different ages at diagnosis (40, 60, and 80 years), increase in recurrence risk in older patients is further increased by
based on the median posterior values of l, ; and c. Using this the elevated probability of harboring distant fields (Fig. 3B) that
distribution, we then computed the probability of harboring at may not be affected by local excision of the primary tumor. To test
Figure 4.
Surgical margins and residual field. A,
Illustration of age-related differences
in local field size and number of
unrelated fields. Before surgery, only
one local field may be present in a
younger patient (left), whereas a
larger local field and additional distant
fields may be present in an older
patient (right). B, During surgery, the
local field is removed in the younger
patient (left) but only partially
resected in the older patient (right),
where the residual field portions
elevate the risk of recurrence.
www.aacrjournals.org Cancer Res; 76(24) December 15, 2016 OF7
Downloaded from cancerres.aacrjournals.org on February 5, 2021. © 2016 American Association for Cancer
Research.Published OnlineFirst October 20, 2016; DOI: 10.1158/0008-5472.CAN-16-1054
Ryser et al.
Figure 5.
Recurrence-free survival after treatment of primary tumor. Recurrence-free survival among younger (Published OnlineFirst October 20, 2016; DOI: 10.1158/0008-5472.CAN-16-1054
Dynamics of Field Cancerization
of the field size. For example, studies on the effects of radiotherapy the classical multistage model (49) to the incidence data, see
in patients with ductal carcinoma in situ reported a higher like- Supplementary Information S4. While the inferred number of 3
lihood of recurrence in patients who received adjuvant radiation stages corresponds well to the current understanding of HNSCC
therapy compared with those who did not (44, 45). It is important etiology, the model fit was found to be poor. More recently,
to note that the observed recurrence patterns may be due to a A study (47) showed that nonspatial 2-stage clonal expansion
combination of several biologic and clinical factors, not just the models yield good fits to the data when accounting for period and
age-related size of the precancer field. cohort effects in biologic parameters. Nevertheless, our findings
Our study has several limitations. First, inherent limitations suggest that for solid cancers subject to field cancerization, spatial
of the SEER database such as ascertainment biases and incom- effects may play an important role in shaping population-level
plete recurrence records may impact the validity of our results incidence patterns.
(46). Second, HPV status is not recorded in SEER, and despite While our predictions for age-dependent recurrence risks and
careful selection of sites that are predominantly HPV-negative, field sizes were successfully corroborated by SEER-based outcome
a portion of recorded cases may have been misclassified. Third, data, pathologic studies are needed to provide a definite confir-
although the incidence data used for model calibration were mation of our models. Our predictions of an increase in field size
restricted to a relatively short period (2000–2012), it is likely in older patients will hopefully spur a critical re-evaluation of the
subject to secular trends that are at least partially due to one-size-fits-all approach to surgical excision margin width, as
changing smoking patterns in the population (4, 47). In addi- well as the effectiveness of surgery without radiation therapy in
tion, it has been shown that smoking cessation leads to a slow older patients with extended exposure and potentially very large
decrease in head and neck cancer risk (48), which may result in fields. In addition, appropriate follow-up intervals for the mon-
differential field sizes between former and current tobacco itoring of local recurrences may be optimized according to
users. In future work, the use of more granular smoking patient-specific predicted field geometries, and a quantitative
prevalence and cancer incidence data, adjusted for secular understanding of the field dynamics combined with a set of
trends, is expected to address these issues and improve the reliable biomarkers for premalignant fields may enable physicians
model predictions. Fourth, a limitation shared with most to perform targeted risk-assessments in high-risk groups, such as
multistage modeling analyses is the assumption of identical heavy smokers. Finally, the proposed modeling framework can be
parameters for all individuals. This issue is partially mitigated applied to other 2-dimensional epithelial sites affected by field
by the Bayesian approach, which provides posterior distribu- cancerization, such as bladder, esophagus and skin, and it may
tion of parameters rather than point estimates. However, incor- provide valuable insights into observed differences in field extent
porating patient-level heterogeneity into the modeling frame- and outcome between HPV-positive and HPV-negative head and
work constitutes a critical next step toward the long-term goal neck cancers.
of developing personalized approaches to head and neck cancer
care. Finally, we did not explicitly account for the role of the Disclosure of Potential Conflicts of Interest
immune system as a first line of defense against neoplastic No potential conflicts of interest were disclosed.
progression. Although immune effects could be incorporated
into the model, current knowledge about the exact mechanisms Disclaimer
of immune response to neoplastic transformation seems insuf- The views expressed in this article are those of the author and do not
ficient to develop meaningful models. necessarily represent the views of the Department of Veterans Affairs or the
United States government.
Historically, different types of multistage models have been
used to infer the nature of cancer-causing mechanisms on the
Authors' Contributions
basis of incidence and mortality data. The first such models (49)
Conception and design: M.D. Ryser, W.T. Lee, K.Z. Leder, J. Foo
were based on the assumption that cancer arises as the product of Development of methodology: M.D. Ryser, W.T. Lee, K.Z. Leder, J. Foo
an organ-specific number of rare mutations. These models Acquisition of data (provided animals, acquired and managed patients,
assumed a well-mixed population of cells and neglected cellular provided facilities, etc.): W.T. Lee
dynamics and spatial tissue structure. Later, these models were Analysis and interpretation of data (e.g., statistical analysis, biostatistics,
extended to account for clonal expansions of precancerous cells computational analysis): M.D. Ryser, N.E. Ready, J. Foo
Writing, review, and/or revision of the manuscript: M.D. Ryser, W.T. Lee,
(40, 41, 50) and used to analyze the number and size of prema-
N.E. Ready, K.Z. Leder, J. Foo
lignant clones in nonspatial populations, both for exponential Study supervision: W.T. Lee, J. Foo
mean growth (51) and for more general growth dynamics (52,
53). In parallel to multistage models, population dynamic mod- Acknowledgments
els such as the Wright–Fisher and Moran processes have also been The authors thank Prof. F. Michor (Dana-Farber Cancer Institute) and Prof. R.
used to model cancer initiation under well-mixed assumptions Durrett (Duke University) for valuable feedback on model design and analysis.
(54, 55). In these models, the expansion of premalignant clones is
constrained by competition with healthy cells or premalignant Grant Support
cells at other stages. Our current work constitutes an extension of The study was supported by the following grants: NIH R01-GM096190 and
both multistage and population dynamic models. In particular, SNSF P300P-154583 (M.D. Ryser); NSF CMMI-1362236 (K.Z. Leder); and NSF
DMS-1224362 and NSF DMS-1349724 (J. Foo).
we accounted for the spatial structure of the epithelial lining of The costs of publication of this article were defrayed in part by the payment of
head and neck sites, and we developed a mechanistic model on page charges. This article must therefore be hereby marked advertisement in
the basis of the current understanding of tissue homeostasis and accordance with 18 U.S.C. Section 1734 solely to indicate this fact.
molecular biology of HPV-negative HNSCC. Using the spatially
explicit model, we achieved a very good fit to the SEER-based Received April 28, 2016; revised August 26, 2016; accepted September 19,
incidence data, Fig. 2A. For the sake of comparison, we also fitted 2016; published OnlineFirst October 20, 2016.
www.aacrjournals.org Cancer Res; 76(24) December 15, 2016 OF9
Downloaded from cancerres.aacrjournals.org on February 5, 2021. © 2016 American Association for Cancer
Research.Published OnlineFirst October 20, 2016; DOI: 10.1158/0008-5472.CAN-16-1054
Ryser et al.
References
1. Leemans CR, Braakhuis BJ, Brakenhoff RH. The molecular biology of head cell carcinomas with or without oncogene-expressing human papilloma-
and neck cancer. Nat Rev Cancer 2011;11:9–22. virus. Oncogene 2006;25:2558–64.
2. Siegel R, Naishadham D, Jemal A. Cancer Statistics, 2013. CA Cancer J Clin 26. Smeets SJ, van der Plas M, Schaaij-Visser TB, van Veen EA, van Meerloo J,
2013;63:11–30. Braakhuis BJ, et al. Immortalization of oral keratinocytes by functional
3. Marur S, D'Souza G, Westra WH, Forastiere AA. Hpv-associated head and inactivation of the P53 and pRb pathways. Int J Cancer 2011;128:
neck cancer: a virus-related cancer epidemic. Lancet Oncol 2010;11:781–9. 1596–605.
4. Chaturvedi AK, Engels EA, Pfeiffer RM, Hernandez BY, Xiao W, Kim E, et al. 27. Durrett R, Moseley S. Spatial Moran models I. Stochastic tunneling in the
Human papillomavirus and rising oropharyngeal cancer incidence in the neutral case. Ann Appl Probab 2015;25:104–15.
United States. J Clin Oncol 2011;29:4294–301. 28. Durrett R, Foo J, Leder K. Spatial Moran models, II: cancer initiation in
5. Slaughter DP, Southwick HW, Smejkal W. Field cancerization in oral spatially structured tissue. J Math Biol 2016;72:1369–400.
stratified squamous epithelium; clinical implications of multicentric ori- 29. Foo J, Leder K, Ryser MD. Multifocality and recurrence risk: a quantitative
gin. Cancer 1953;6:963–8. model of field cancerization. J Theor Biol 2014;355:170–84.
6. Califano J, van der Riet P, Westra W, Nawroz H, Clayman G, Piantadosi S, 30. Bramson M, Griffeath D. On the Williams-Bjerknes Tumor-Growth
et al. Genetic progression model for head and neck cancer: implications for Model .2. Math Proc Cambridge 1980;88:339–57.
field cancerization. Cancer Res 1996;56:2488–92. 31. Elrefaey S, Massaro MA, Chiocca S, Chiesa F, Ansarin M. HPV in oropha-
7. Tabor MP, Brakenhoff RH, van Houten VM, Kummer JA, Snel MH, Snijders ryngeal cancer: the basics to know in clinical practice. Acta Otorhinolar-
PJ, et al. Persistence of genetically altered fields in head and neck cancer yngol Ital 2014;34:299–309.
patients: biological and clinical implications. Clin Cancer Res 2001;7: 32. Attner P, Du J, Nasman A, Hammarstedt L, Ramqvist T, Lindholm J, et al.
1523–32. The role of human papillomavirus in the increased incidence of base of
8. van Houten VM, Tabor MP, van den Brekel MW, Kummer JA, Denkers F, tongue cancer. Int J Cancer 2010;126:2879–84.
Dijkstra J, et al. Mutated P53 as a molecular marker for the diagnosis of 33. Boyle P, Macfarlane GJ, Blot WJ, Chiesa F, Lefebvre JL, Azul AM, et al.
head and neck cancer. J Pathol 2002;198:476–86. European school of oncology advisory report to the European Commission
9. Tabor MP, Brakenhoff RH, Ruijter-Schippers HJ, Van Der Wal JE, Snow GB, for the Europe against Cancer Programme: Oral Carcinogenesis in Europe.
Leemans CR, et al. Multiple head and neck tumors frequently originate Eur J Cancer B Oral Oncol 1995;31B:75–85.
from a single preneoplastic lesion. Am J Pathol 2002;161:1051–60. 34. Hashibe M, Brennan P, Chuang SC, Boccia S, Castellsague X, Chen C, et al.
10. Braakhuis BJ, Tabor MP, Kummer JA, Leemans CR, Brakenhoff RH. A Interaction between tobacco and alcohol use and the risk of head and neck
Genetic explanation of slaughter's concept of field cancerization: evidence cancer: pooled analysis in the International Head and Neck Cancer Epi-
and clinical implications. Cancer Res 2003;63:1727–30. demiology Consortium. Cancer Epidemiol Biomarkers Prev 2009;18:
11. Oliveira MVMd, Fraga CAdC, Pereira CS, Barros LO, Oliveira ES, Guimar~aes 541–50.
ALS, et al. Field cancerization in head and neck squamous cell carcinoma: 35. Agaku IT, King BA, Dube SR, Control CfD, Prevention. Current cigarette
immunohistochemical expression of P53 and Ki67 proteins: Clinicopatho- smoking among adults—United States, 2005–2012. MMWR Morb Mortal
logical Study. Rev Clín Pesq Odontol(Impr) 2010;6:17–27. Wkly Rep 2014;63:29–34.
12. Poh CF, Zhang L, Anderson DW, Durham JS, Williams PM, Priddy RW, et al. 36. Freedman KS, Nelson NM, Feldman LL. Smoking Initiation among young
Fluorescence visualization detection of field alterations in tumor margins adults in the United States and Canada, 1998–2010: a systematic review.
of oral cancer patients. Clin Cancer Res 2006;12:6716–22. Prev Chronic Dis 2012;9:E05.
13. Heaphy CM, Griffith JK, Bisoffi M. Mammary field cancerization: molec- 37. Goel RK, Nelson MA. The effectiveness of anti-smoking legislation: a
ular evidence and clinical importance. Breast Cancer Res Treat 2009;118: review. J Econ Surv 2006;20:325–55.
229–39. 38. Weinstock YE, Alava I III, Dierks EJ. Pitfalls in determining head and neck
14. Nonn L, Ananthanarayanan V, Gann PH. Evidence for field cancerization of surgical margins. Oral Maxillofac Surg Clin North Am 2014;26:151–62.
the prostate. Prostate 2009;69:1470–9. 39. Varvares MA, Poti S, Kenyon B, Christopher K, Walker RJ. Surgical margins
15. Graham TA, McDonald SA, Wright NA. Field cancerization in the GI tract. and primary site resection in achieving local control in oral cancer resec-
Future Oncol 2011;7:981–93. tions. Laryngoscope 2015;125:2298–307.
16. Squier CA, Kremer MJ. Biology of oral mucosa and esophagus. J Natl 40. Luebeck EG, Moolgavkar SH. Multistage carcinogenesis and the incidence
Cancer Inst Monogr 2001:7–15. of colorectal cancer. Proc Natl Acad Sci U S A 2002;99:15095–100.
17. Clayton E, Doupe DP, Klein AM, Winton DJ, Simons BD, Jones PH. A single 41. Meza R, Jeon J, Moolgavkar SH, Luebeck EG. Age-specific incidence of
type of progenitor cell maintains normal epidermis. Nature 2007;446: cancer: phases, transitions, and biological implications. Proc Natl Acad Sci
185–9. U S A 2008;105:16284–9.
18. Doupe DP, Alcolea MP, Roshan A, Zhang G, Klein AM, Simons BD, et al. A 42. Gallaher J, Babu A, Plevritis S, Anderson AR. Bridging population and tissue
single progenitor population switches behavior to maintain and repair scale tumor dynamics: a new paradigm for understanding differences in
esophageal epithelium. Science 2012;337:1091–3. tumor growth and metastatic disease. Cancer Res 2014;74:426–35.
19. Martincorena I, Roshan A, Gerstung M, Ellis P, Van Loo P, McLaren S, et al. 43. Luebeck EG, Curtius K, Jeon J, Hazelton WD. Impact of tumor progression
Tumor evolution. High burden and pervasive positive selection of somatic on cancer incidence curves. Cancer Res 2013;73:1086–96.
mutations in normal human skin. Science 2015;348:880–6. 44. Holmberg L, Garmo H, Granstrand B, Ringberg A, Arnesson LG, Sandelin K,
20. Sprouffske K, Pepper JW, Maley CC. Accurate reconstruction of the tem- et al. Absolute risk reductions for local recurrence after postoperative
poral order of mutations in neoplastic progression. Cancer Prev Res radiotherapy after sector resection for ductal carcinoma in situ of the breast.
2011;4:1135–44. J Clin Oncol 2008;26:1247–52.
21. Takeda T, Sugihara K, Hirayama Y, Hirano M, Tanuma JI, Semba I. 45. Kong I, Narod S, Taylor C, Paszat L, Saskin R, Nofech-Moses S, et al. Age at
Immunohistological evaluation of Ki-67, P63, Ck19 and P53 expression diagnosis predicts local recurrence in women treated with breast-conserv-
in oral epithelial dysplasias. J Oral Pathol Med 2006;35:369–75. ing surgery and postoperative radiation therapy for ductal carcinoma in
22. Kushner J, Bradley G, Jordan RC. Patterns of P53 and Ki-67 protein situ: a population-based outcomes analysis. Curr Oncol 2013;21:96–104.
expression in epithelial dysplasia from the floor of the mouth. J Pathol 46. James BYM, Gross CP, Wilson LD, Smith BD. Nci seer public-use data:
1997;183:418–23. applications and limitations in oncology research. Oncology 2009;23:288.
23. Gale N, Zidar N, Poljak M, Cardesa A. Current views and perspectives on 47. Brouwer AF, Eisenberg MC, Meza R. Age effects and temporal trends in
classification of squamous intraepithelial lesions of the head and neck. HPV-related and HPV-unrelated oral cancer in the United States: a mul-
Head Neck Pathol 2014;8:16–23. tistage carcinogenesis modeling analysis. PLoS One 2016;11:e0151098.
24. Reed AL, Califano J, Cairns P, Westra WH, Jones RM, Koch W, et al. High 48. Marron M, Boffetta P, Zhang ZF, Zaridze D, Wunsch-Filho V, Winn DM,
frequency of P16 (Cdkn2/Mts-1/Ink4a) inactivation in head and neck et al. Cessation of alcohol drinking, tobacco smoking and the reversal of
squamous cell carcinoma. Cancer Res 1996;56:3630–3. head and neck cancer risk. Int J Epidemiol 2010;39:182–96.
25. Smeets SJ, Braakhuis BJ, Abbas S, Snijders PJ, Ylstra B, van de Wiel MA, et al. 49. Armitage P, Doll R. The age distribution of cancer and a multi-stage theory
Genome-wide DNA copy number alterations in head and neck squamous of carcinogenesis. Br J Cancer 1954;8:1–12.
OF10 Cancer Res; 76(24) December 15, 2016 Cancer Research
Downloaded from cancerres.aacrjournals.org on February 5, 2021. © 2016 American Association for Cancer
Research.Published OnlineFirst October 20, 2016; DOI: 10.1158/0008-5472.CAN-16-1054
Dynamics of Field Cancerization
50. Moolgavkar SH, Dewanji A, Venzon DJ. A stochastic two-stage model for 53. Curtius K, Hazelton WD, Jeon J, Luebeck EG. A multiscale model evaluates
cancer risk assessment. I. The hazard function and the probability of tumor. screening for neoplasia in Barrett's Esophagus. PLoS Comput Biol 2015;11:
Risk Anal 1988;8:383–92. e1004272.
51. Dewanji A, Venzon DJ, Moolgavkar SH. A stochastic two-stage model for 54. Beerenwinkel N, Antal T, Dingli D, Traulsen A, Kinzler KW, Velculescu VE,
cancer risk assessment. II. The number and size of premalignant clones. et al. Genetic progression and the waiting time to cancer. PLoS Comput Biol
Risk Anal 1989;9:179–87. 2007;3:e225.
52. Luebeck EG, Moolgavkar SH. Stochastic analysis of intermediate lesions in 55. Foo J, Leder K, Michor F. Stochastic dynamics of cancer initiation. Phys Biol
carcinogenesis experiments. Risk Anal 1991;11:149–57. 2011;8:015002.
www.aacrjournals.org Cancer Res; 76(24) December 15, 2016 OF11
Downloaded from cancerres.aacrjournals.org on February 5, 2021. © 2016 American Association for Cancer
Research.Published OnlineFirst October 20, 2016; DOI: 10.1158/0008-5472.CAN-16-1054
Quantifying the Dynamics of Field Cancerization in
Tobacco-Related Head and Neck Cancer: A Multiscale
Modeling Approach
Marc D. Ryser, Walter T. Lee, Neal E. Ready, et al.
Cancer Res Published OnlineFirst October 20, 2016.
Updated version Access the most recent version of this article at:
doi:10.1158/0008-5472.CAN-16-1054
Supplementary Access the most recent supplemental material at:
Material http://cancerres.aacrjournals.org/content/suppl/2016/10/20/0008-5472.CAN-16-1054.DC1
E-mail alerts Sign up to receive free email-alerts related to this article or journal.
Reprints and To order reprints of this article or to subscribe to the journal, contact the AACR Publications
Subscriptions Department at pubs@aacr.org.
Permissions To request permission to re-use all or part of this article, use this link
http://cancerres.aacrjournals.org/content/early/2016/12/01/0008-5472.CAN-16-1054.
Click on "Request Permissions" which will take you to the Copyright Clearance Center's
(CCC)
Rightslink site.
Downloaded from cancerres.aacrjournals.org on February 5, 2021. © 2016 American Association for Cancer
Research.You can also read