Quantitative metallography of two-phase titanium alloys
←
→
Page content transcription
If your browser does not render page correctly, please read the page content below
Materials Characterization 46 (2001) 149 – 154

   Quantitative metallography of two-phase titanium alloys
                             Jacek Chrapoński*, Wojciech Szkliniarz
                  Department of Materials Science, Silesian University of Technology, ul. Krasińskiego 8,
                                              PL-40-019 Katowice, Poland
                                  Received 21 December 2000; accepted 22 January 2001

Abstract

    The paper presents the results of investigations of the two-phase Ti – 6Al – 2Mo – 2Cr – Fe alloy
microstructure by means of different methods: special techniques of light and scanning electron microscopy.
It has been found that for the evaluation of the grain size and lamella colonies of the a phase, an observation
in polarized light with a lambda filter gives the best results. The algorithm of the image transformations
enabling detection of boundaries of the lamella colonies is presented. It employs color image separation into
basic colors according to the CMYK model. Also, a fully automatic way is presented for the preparation of
images obtained by means of a scanning electron microscope for quantitative analysis. D 2001 Elsevier
Science Inc. All rights reserved.

Keywords: Titanium alloys; Image analysis; Quantitative metallography; Light microscopy special techniques

1. Introduction                                                  and thermal treatment. The microstructures of tita-
                                                                 nium alloys in relation to the morphology of their
    Owing to their exceptional properties such as:               components can be classified into two groups:
good specific strength, creep resistance and corrosion
resistance in the majority of aggressive media and                    fine-grained microstructure of a and b phase
biological inertness, titanium alloys are widely used                  for single-phase alloys or their mixtures for
in aeronautics, astronautics, chemical industry, food                  two-phase alloys,
industry, power industry and medicine [1]. Depend-                    coarse-grained microstructure of polyhedral
ing on their chemical composition, titanium alloys                     grains of a or b phase for single-phase alloys
have a, a + b or b microstructure. Predominately,                      or ones characterized by colonies of a lamellar
parts are manufactured from two-phase alloys a + b.                    a and b phase placed within the boundaries of
In titanium alloys, particularly in two-phase ones,                    the big grains of the former b phase for the
there is a great diversification of the microstructural                two-phase alloys [1,2].
morphology: the grain size and substructure, which is
controlled by the chemical composition, methods and                  The analysis of the literature [3 – 7] shows the
conditions of melting, crystallization, plastic working          complexity of issues concerning the microstruc-
                                                                 ture$mechanical properties relationships in titanium
    * Corresponding author. Tel.: +48-32-256-31-97; fax:         alloys. The variety of microstructures obtained in
+48-32-256-31-97.                                                titanium alloys under the influence of technological
    E-mail address: chrapjac@polsl.katowice.pl                   parameters shows extensive possibilities of changes
(J. Chrapoński).                                                in their properties. A high level of mechanical proper-

1044-5803/01/$ – see front matter D 2001 Elsevier Science Inc. All rights reserved.
PII: S 1 0 4 4 - 5 8 0 3 ( 0 1 ) 0 0 11 7 - 6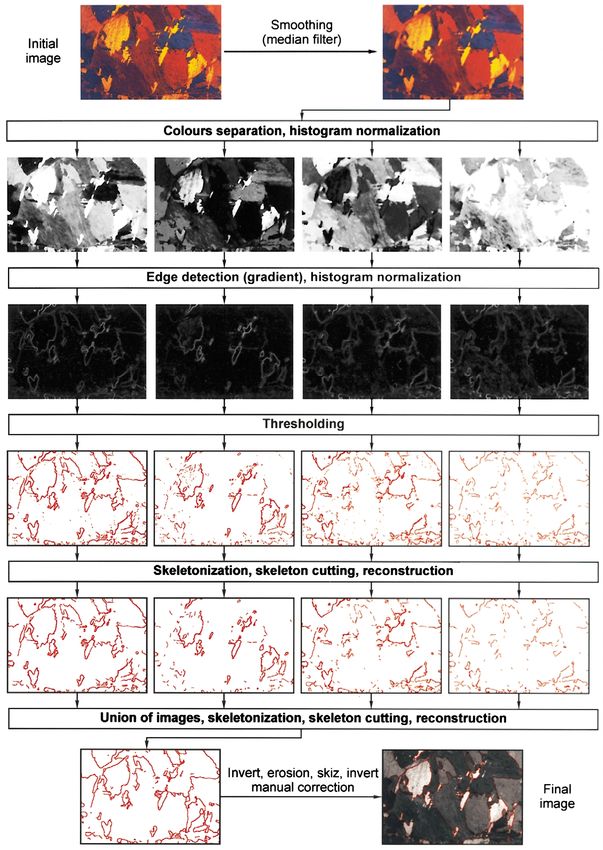
150                      J. Chrapoński, W. Szkliniarz / Materials Characterization 46 (2001) 149–154

Table 1                                                           examinations were prepared by electrolytic polishing
The chemical composition of the Ti – 6Al – 2Mo – 2Cr – Fe         and etching in Kroll’s reagent.
alloy
Chemical composition (%)
Al        V        Mo          Cr        Fe         Ti            3. Experimental procedure
6.1       –        2.3         1.5       0.6        balance
                                                                      The a + b two-phase titanium alloys are charac-
                                                                  terized by a granular microstructure consisting of
                                                                  grains of the former b phase on the boundaries of
ties of titanium alloys can be reached providing that it
                                                                  which there is an a phase network (Fig. 1). Inside the
is possible to obtain a homogenous fine-grained
                                                                  grains there are colonies of a phase lamellae, nucle-
microstructure. The necessity of grain size reduction
                                                                  ating in the phase transformation process, mainly on
creates a number of difficulties during the processing
                                                                  the grain boundaries. The lamellae inside the colonies
of semifinished products from titanium alloys. Irre-
                                                                  are placed in a parallel way, forming the texture
versible changes of the microstructure (in the form of
                                                                  within the grains. A complete quantitative description
an excessive grain growth) present in the case of
                                                                  of this type of microstructure should include data
exceeding the allotropic transformation temperature
                                                                  about all three elements: grains, colonies and lamel-
during plastic working or thermal treatment are the
                                                                  lae. Due to considerable differences in the size and
main problems.
                                                                  lack of features unambiguously distinguishing these
    An analysis of the published quantitative relations
                                                                  microstructural elements from one another, it is not
between the mechanical properties and the geomet-
                                                                  possible to apply one observation technique to deter-
rical characteristics of the titanium alloy microstruc-
                                                                  mine the stereological parameters of grains, colonies
tures leads to the conclusion that the basic parameter
                                                                  and lamellae of the phases a and b simultaneously.
hitherto used for the grain size description has been the
                                                                  Detection based on the image texture [11,12] is also
mean grain diameter [8]. Currently it is thought that a
                                                                  impossible, because at magnifications at which colo-
few parameters determined using a surface method
                                                                  nies and grains are visible, lamellae cannot be differ-
describe the microstructure in a better way [9,10].
                                                                  entiated. In this paper, for the evaluation of the sizes
    Hence one may state that the development of
                                                                  of grains and colonies, images obtained by means of
optimum methods and criteria of microstructural
                                                                  special techniques of light microscopy were used,
shaping must use quantitative descriptions of the
                                                                  whereas the quantitative characterization of the a
microstructural properties. Only stereological param-
                                                                  phase lamellae was carried out on images obtained
eters determined by an image analysis and quantita-
                                                                  by means of scanning electron microscopy.
tive metallography allow one to compare objectively
                                                                      The initial examinations of the Ti – 6Al – 2Mo –
the material microstructure after different technolog-
                                                                  2Cr – Fe alloy microstructure by means of light micro-
ical processes and to look for relationships between
                                                                  scopy showed that the contrast between the a phase
the microstructure and the mechanical properties of
                                                                  lamella colonies was too small for image analysis
the alloys.
                                                                  methods to be used (Fig. 2a). One may try to achieve
                                                                  improvement of the contrast through the application

2. Material

    A Ti – 6Al – 2Mo – 2Cr – Fe titanium alloy with the
two-phase a + b type microstructure was used in the
experiments. The chemical composition of the alloy
is presented in Table 1. In order to obtain a
homogenous coarse-grained initial microstructure
the alloy was subjected to preannealing at 1273 K
for 1 h and then it was furnace cooled after anneal-
ing. That type of annealing resulted in forming an
initial material with a mean grain equivalent diam-
eter equal to about 0.5 mm. To diversify the content
of the structural components and the microstructural
parameters the specimens were annealed isother-
mally for 1 h at temperatures over the range of
1073 – 1243 K. After annealing the specimens were                 Fig. 1. Diagram of microstructure of two-phase (a + b)
cooled in air. Specimens for the microstructural                  titanium alloys.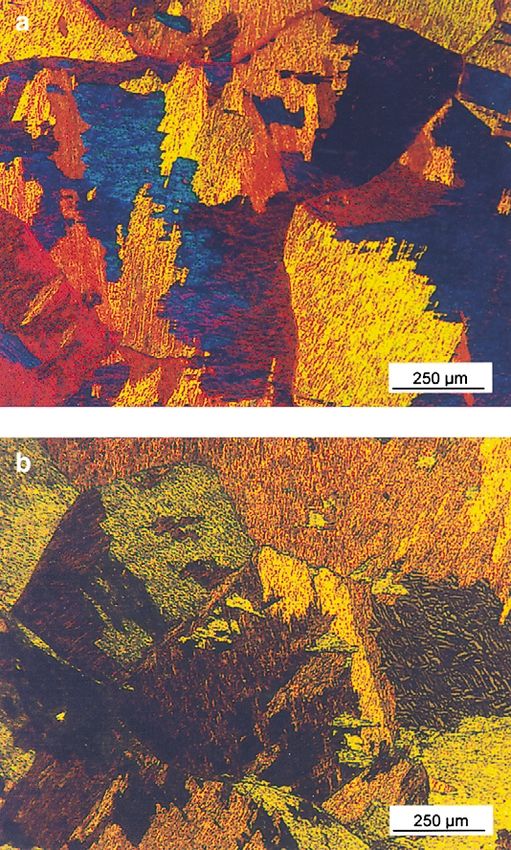
J. Chrapoński, W. Szkliniarz / Materials Characterization 46 (2001) 149–154 151
dark field gave better results than in bright field (Fig.
2b), whereas good results were obtained only during
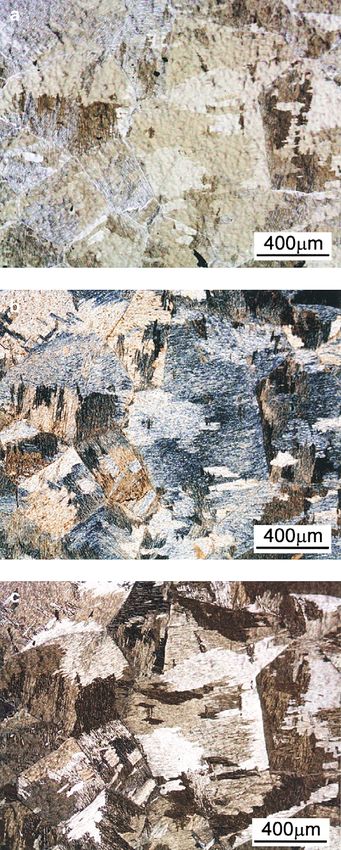
the observation in polarized light (Fig. 2c). By chang-
ing the setting angle of the polarizer against the
analyzer during the observation in polarized light it
is possible to obtain images on which the same
microstructural element has a different gray level.
However, for image analysis needs, recording at least
several images of the microstructure from the same
place on a specimen is required. Applications and
transformations of the images obtained this way are
described in the literature [13].
The difficulties connected with the necessity of
recording many images can be eliminated thanks to
the application a lambda filter during the observation
in polarized light (Fig. 3). The microstructural image
obtained in this way is in pseudocolors. Such an image
can be subjected to color separation according to the
selected model of colors (e.g. RGB, CMYK, HSB and
HLS). The investigations of the titanium alloy micro-
structures showed that the best results are achieved
using the CMYK model (C = cyan, M = magenta,
Fig. 2. Comparison of the Ti – 6Al – 2Mo – 2Cr – Fe alloy
microstructure obtained by different techniques of light
microscopy: (a) bright field, (b) dark field and (c)
polarized light.
of special techniques of light microscopy, e.g. by
observation in dark field or polarized light. The
methods of observation in polarized light can be
applied when the material examined is characterized
by optical anisotropy. This phenomenon occurs in the Fig. 3. Microstructure of the Ti – 6Al – 2Mo – 2Cr – Fe alloy
alloy investigated as a result of the lamellar structure obtained in polarized light with a lambda filter after
of the a phase colony. Observations carried out in annealing at (a) 1073 and (b) 1193 K.152 J. Chrapoński, W. Szkliniarz / Materials Characterization 46 (2001) 149–154
Fig. 4. Algorithm of image transformations using colors separation.J. Chrapoński, W. Szkliniarz / Materials Characterization 46 (2001) 149–154 153
Y = yellow, K = black). After separation into basic Measurements were made on all binary images by
colors in accordance with this model, four gray the surface and linear methods. The following geo-
images are obtained with greater difference in contrast metrical parameters of the microstructure and their
than in images recorded only in polarized light (Fig 4). variability coefficients were determined separately for
The image transformations for measurements of grains, colonies and lamellae: volume fraction, mean
the a phase lamella colony size included: smooth- plane section area, mean perimeter, maximum and
ing of the initial color image, separation into four
constituent gray images (CMYK), edge detection
(gradient), thresholding, removing of fine elements
of images and adding of four binary images (Fig.
4). The algorithm presented enables appropriate
detection of about 80% of the colony boundaries.
Unfortunately, fully automatic analysis and the
measurement of the a phase lamella colonies is
not possible. The final image requires manual
corrections based on filling parts of the colony
boundaries or removing needless boundaries. Algo-
rithms of the grain boundary reconstruction in the
case of the microstructure in question do not yield
good final results because of the complex shape
of colonies.
Due to the required magnification range, the
image acquisition for the evaluation of the Ti –
6Al – 2Mo – 2Cr – Fe alloy grain size was carried
out by means of an Olympus SZ9 stereoscopic
microscope with an attachment for work in polarized
light. The grain size was evaluated in binary images
obtained in the same way, from which boundaries
not being grain boundaries (a boundary between
colonies is not always a grain boundary, but the
grain boundary is always a colony boundary) were
removed manually.
The quantitative characteristics of lamellae was
performed on the images from a scanning electron
microscope. These images are characterized by a
considerable contrast between the a phase lamellae
and the b phase matrix, which significantly facilitates
a quantitative characterization of the a phase. How-
ever, the preparation of the images for measurements
requires the removal of the noise occurring mainly in
the b phase region.
The image transformation before the measurement
included: smoothing by a mean filter, histogram
normalization, thresholding and removing fine image
elements (skeletonization, cutting skeleton ends and
reconstruction). The image transformation scheme is
presented in Fig. 5.
In many studies concerning the analysis of the
relationships between the properties and parameters
of titanium alloy microstructures (e.g. [8,14]) the
authors limit themselves to measuring the mean grain
diameter. This constitutes a considerable simplifica-
tion of the microstructural description. In the present
paper, the binary images obtained using the described
research methodology enabled a comprehensive Fig. 5. Diagram of the transformation of images from a
microstructural evaluation. scanning electron microscope.154 J. Chrapoński, W. Szkliniarz / Materials Characterization 46 (2001) 149–154
minimum diameter, Feret diameter along the x and y Hutnictwo, Wydawnictwo Politechniki Śla˛skiej, Gli-
axes, elongation as the ratio of the maximum to wice (in Polish).
minimum diameter, mean volume for grains and [3] Borisova EA. Metallografia titanovych splavov. Mos-
cow: Metallurgia, 1980.
lamella colonies calculated on the basis of equation
[4] Grewal G, Ankem S. Particle coarsening behavior of
presented in Refs. [9,10], mean equivalent diameter,
alpha – beta titanium alloys. Metall Trans A 1990;21(6):
shape factor, specific surface, Sv. Complete research 1645 – 54.
results and their detailed analysis are presented in [5] Breslauer E, Rosen A. Relationship between micro-
Ref. [15]. structure and mechanical properties in metastable be-
ta titanium 15 – 3 alloy. Mater Sci Technol 1991;7(5):
441 – 6.
4. Final remarks [6] Andres C, Gysler A, Luetjering G. Correlation be-
tween microstructure and creep behavior of the high-
Image analysis of a titanium alloy microstructure temperature Ti alloy IMI 834. Z Metallkd 1997;88(3):
197 – 203.
is a complex problem. The investigations conducted
[7] Ponsonnet L, Quesne C, Penelle R. Microstructure and
in this study showed that the quantitative evaluation creep deformation of a near beta titanium alloy beta-
of the microstructure present in two-phase titanium CEZ. Mater Sci Eng 1999;A262(1 – 2):50 – 63.
alloys required the application of different methods [8] Brun MY, Shakhanova GV, Soldatenko IV. Effect of
and research techniques: light microscopy using spe- lamellar structure parameters on the properties of tita-
cial techniques and scanning electron microscopy. nium alloy VT3 – 1. Metalloved Term Obrab Met 1986;
The best effects were achieved by making observa- 28(7):52 – 5.
tions in polarized light with a lambda filter. The [9] Chrapoński, J. Usefulness evaluation of the stereolog-
image transformation algorithms presented speeds ical methods applied for grain size assessment in poly-
up and facilitates preparation of images for quantita- crystalline materials. PhD Thesis, Silesian University
of Technology, Katowice, Poland, 1997 (in Polish).
tive measurements. However, fully automatic image
[10] Cwajna J, Chrapoński J, Maliński M. Application of
analysis of titanium alloy microstructures obtained by 3D models of materials microstructure in stereology.
light microscopy is not possible. In case of the a Proc. Int. Conf. on The Quantitative Description of
phase lamellae with images from scanning electron Materials Microstructure QMAT’97, Warsaw, Poland,
microscopy the measurement procedures can be made April 16 – 19, 1997. pp. 27 – 36.
fully automatically. [11] Szala J. Application of the image analysis methods in
microscopy. Inz Mater in Polish 1999;3(4):103 – 11.
[12] Mlynarczuk M, Beucher S. Directional fibre analysis
by mathematical morphology. Proc. Int. Conf. on The
Acknowledgments Quantitative Description of Materials Microstructure
QMAT’97, Warsaw, Poland, April 16 – 19, 1997. pp.
The authors would like to thank Dr Janusz 403 – 8.
Szala for kindly providing image analysis software [13] Szala J. Met – Ilo — new tool for quantitative material
MET-ILO. structure characterisation. II Krajowa Konferencja
These investigations have been supported by grant Metalograficzna Metalografia’99, Ustroń, Poland,
No. 7 T08A 03616 from the Polish State Committee April, 1999. pp. 41 – 52. (in Polish).
for Scientific Research (KBN). [14] Chan KS, Kim YW. Effects of lamellae spacing and
colony size on the fracture resistance of a fully-la-
mellar TiAl alloy. Acta Metall Mater 1995;43(2):
439 – 51.
References [15] Szkliniarz W, Chrapoński J. Relationship between the
parameters of lamellar microstructure and mechanical
[1] Bylica A, Sieniawski J. Titanium and its alloys. War- properties of Ti – 6Al – 2Mo – 2Cr – Fe alloy. Proc. of
szawa: PWN, 1985 (in Polish). Sixth Int. Conf. on Stereology and Image Analysis in
[2] Szkliniarz W. Possibilities of heat treatment application Materials Science, Cracow, Poland, September 20 – 23,
for grains refinement of titanium and titanium alloys. 2000. pp. 409 – 14.You can also read