RELIEF INTENSITY AS A COEFFICIENT DIVERSIFYING
←
→
Page content transcription
If your browser does not render page correctly, please read the page content below

METHODS OF LANDSCAPE RESEARCH
                    Dissertations Commission of Cultural Landscape No. VIII
            Commission of Cultural Landscape of Polish Geographical Society, Sosnowiec, 2008

Joanna SZAFRANIEC
University of Silesia, Dept. of Geomorphology, Faculty of Earth Sciences,
e-mail: jszafran@wnoz.us.edu.pl

 RELIEF INTENSITY AS A COEFFICIENT DIVERSIFYING THE
FORMS OF THE POMERANIAN YOUNG-GLACIAL LANDSCAPE

key words: relief forms analyses, Poland, Pomerania

INTRODUCTION
     The landscape as a system of connected features, phenomena and processes
distinguishing an area is simultaneously characterized by changeability. It is the
consequence of feedbacks and relationships between its components. One of them is
the terrain relief and the morphometric analysis makes possible its quantitative
description.
     A scale of the area and choice of the appropriate reference surface (basic area) is
the main problem of the terrain forms study (Grygorenko, 1973; Mościbroda, 1981;
Kozieł, 1990). Applied methods usually were very laborious, for example the hillocks
distinguishing and their classification (Richling, 1973). There were also measured the
additional parameters such as relative heights, mean slope, number of hollows,
length of water-course lines and their number (Ławniczak, 2003). Hence such studies
were limited to some small test-areas and results were extrapolated on bigger
regions.
     The main aim of this study was working out the method of the homogeneous
morphometric analysis. It should be useful for any scale of the region and for any
size of the basic area (taking into consideration the average size of the young-glacial
landscape forms). There was also another important assumption (taken into
account), namely the elimination of differences due to a position above sea level and
due to forms ages (the forms of any area could be connected with different phases
and oscillations of the last glaciation). Each relief component has been evolving and
it influences the forms morphometric changes. But it is possible to find a feature
which is the most resistant to them. It is the pattern recognition of forms. It is sugge-
sted to use a digital terrain model (DTM) for whole big region of the young-glacial

                                                                                               244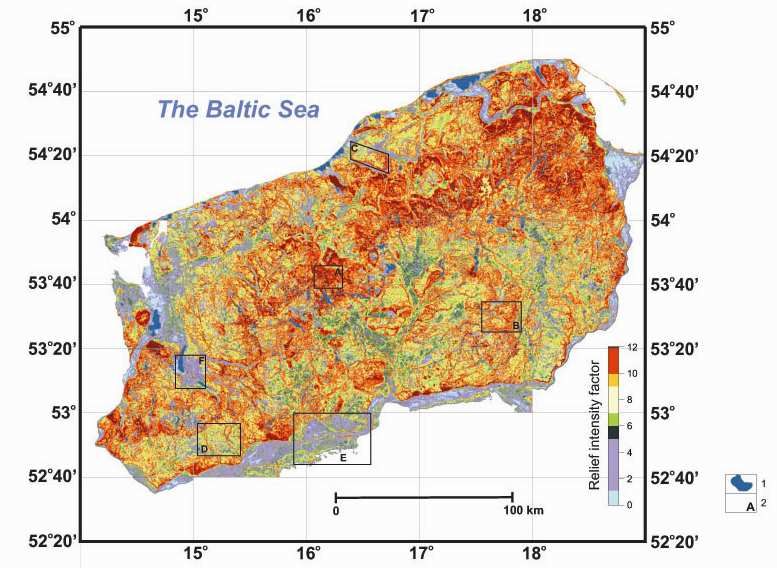
landscape. On the basis of such data it is possible to indicate some morphometric
features of forms and present their pattern recognition (as a part of another research
trend; Tadeusiewicz, Flasiński, 1991).

STUDY AREA
     Pomerania (NW Poland) as the example of a region with the young-glacial
landscape was chosen to the morphometric analysis. It is considered here in its histo-
rical borders: between lower parts of the Odra and the Vistula rivers (west and east
adequately) and between the Baltic Sea (north) and the Noteć – Warta proglacial
stream valley (the Toruń – Eberswald proglacial stream valley) south. It consists of
two big physical-geographical regions: The South Baltic Coasts and the Pomeranian
districts lake (Kondracki, 1994). Its main feature is the trisectional landscape. The
main axis is the Pomeranian hump (Galon, 1972) – end moraines ridge, mainly of the
Pomeranian phase maximum extension during the Vistula glaciation with the
highest point called Wieżyca (329 m n.p.m.). It is also the main watershed between
tributaries of the Odra and the Vistula rivers south and the Baltic Sea Coast rivers
north. This hump also agrees with the under-Quaternary relief upheaval.
     The southern slope of the hump gradually descending towards the Noteć –
Warta proglacial stream valley is a wide zone of outwash plains, today drained by
the Myśla, Drawa, Gwda, Brda and Wda rivers and their tributaries. They are
overgrown by pine and mixed forests. Furthermore, relatively flat or undulated
areas of the ground moraine of former phases make up this region. Today they are
used agriculturally.
     The northern slope following into seaside lowlands descends towards the Baltic
Sea. There are the Pomeranian phase forms like areas of the ground moraine, kame
terraces and basins with marginal lake sediments. The relief of this part of Pomerania
is diversified by rivers valleys: the Rega, Parsęta, Wieprza, Słupia, Łupawa, Łeba and
Reda valley (arose in places of former valleys which had formed before glaciations).
These valleys are characterized by their stepped course from SE to NW. This region
is used agriculturally, here and there overgrown by beech, oak and pine forests.
     End depressions of the Odra and the Vistula lobes are the lowest part of the
Pomeranian landscape today with the crypto depression of the Miedwie Lake (c. -30
m b.s.l.).
    The characteristic feature of the Pomerania region, especially of the Pomeranian
District Lakes is huge number of different lakes – the subglacial tunnels-, moraine-,
coastal-type and small, melted-type lakes.

                                                                                  245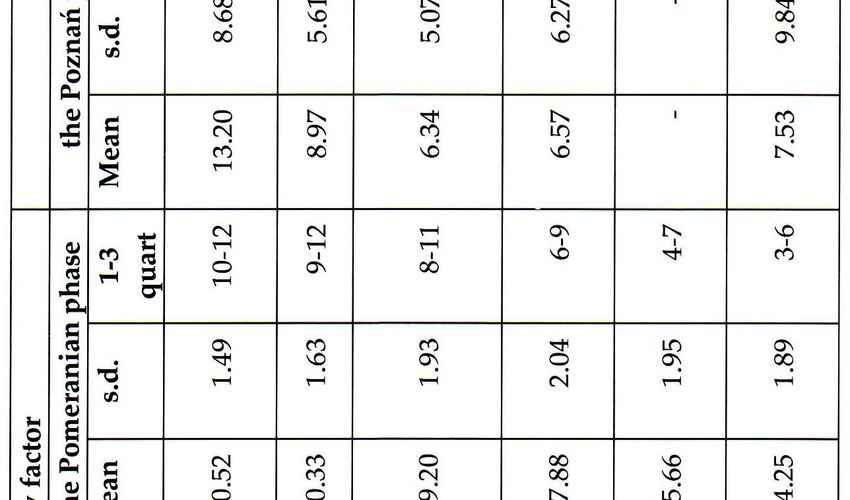
METHODS AND SOURCES OF DATA
    In this analysis it was used the DTM with the grid node of 1” x 1” of an arc (c. 30
x 30 m in the terrain). It was worked out on the basis of topographic maps of scale
1:50 000 and made available by the Wojskowy Ośrodek Geodezji i Teledetekcji (the
Military Centre of the Geodesy and the Remote Sensing), 2001. Data was processed
by the Surfer software ver. 8.0 (Golden Software). Fig.1 presents stages of the relief
intensity factor (RIF) calculation.
    The relief intensity coefficient consists of three factors: a) relative height RH –
calculated as a difference between maximum and minimum value of the absolute
height in a grid; b) neighborhood NH – sum of differences between an absolute
height of the selected grid node and values of nodes north, east, south and west of it
(and squared); c) form structure STR which consists of the grain composition of
terrain forms deposits GC and the shape of the form FS – convex, concave or flat
(undulated, light sloping).
    Parameters RH and NH were calculated using the DTM. Next it was used the
Geological Map of Poland of the scale 1: 200 000 (Mojski, 1974-1981) to determine
STR. Each form was digitized (the classification of selected surface deposits was
based on the geomorphological criterion what was the help). Moreover, there were
used maps explanations as well as a legend to the map edited by Marks et al. (2006)
and forms definitions published in geomorphological and geological literature
(Embleton and King, 1975; Jaroszewski et al., 1985; Lindner, 1992; Mizerski and
Sylwestrzak, 2002; Goudie, 2004).
    Ranks from 0 to 4 were assigned to all the three factors according to a proper
interval of values. The values ranges of each rank calculated for RH and NH are
presented in tab. 1. Each parameter was processed to a three-dimensional matrix
with a grid node of 1,8” 1,8” of the arc (c. 55 m x 55 m in the terrain what was
optimal due to the number of points as well as the computer processor capacity).
A sum of three factors ranks in each grid gave the diversity of the relief intensity for
the whole of Pomerania in range from 0 to 12 where 0 means a flat area and 12 – the
highest area with the most diverse relief.
    The presented factor was tested for different basic areas what is shown in fig. 2.
There were selected three dimensions for the test area: c. 30 m x 30 m, c. 55 m x 55 m
and c. 150 m x 150 m. Calculated statistical parameters indicate that both factor
values as well as the pattern recognition change insignificantly.

                                                                                    246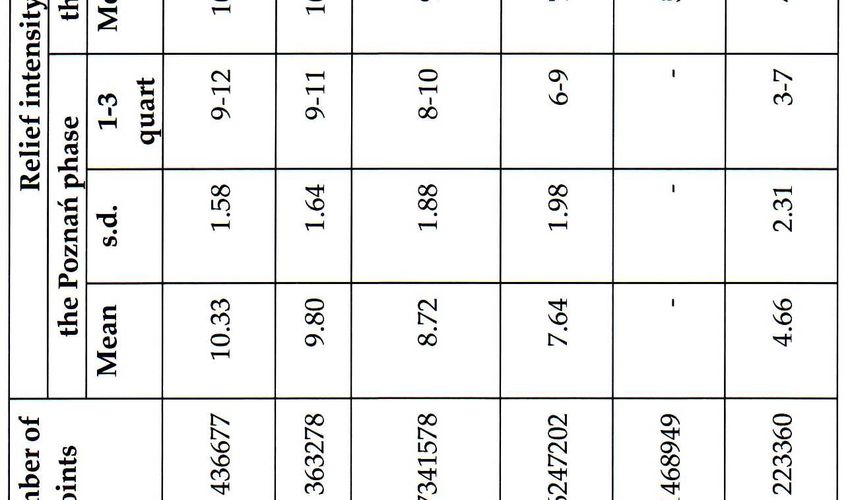
Fig.1. Stages of the relief intensity factor (RIF) calculation. Source: author’s compilation.
247
Tab. 1. Values ranges of the relative heights RH and the neighborhood NH for each rank, the Pomerania
region.

                                                      Area
                                                                               Pomerania
 Ranks
                                                  0                                 0
                                                  1                               >0-3
     Relative heights WW                          2                                4-5
                                                  3                                6-9
                                                  4                                ≥10
                                                  0                                 0
                                                  1                            >0-0.0047
     Neighbourhood SAS                            2                          >0.0047-0.0957
                                                  3                          >0.0957-0.4979
                                                  4                              >0.4979
Source: author’s compilation on the basis of DTM, Wojskowy Ośrodek Geodezji i Teledetekcji, 2001.

 Fig.2. Diversity of the Pomerania relief intensity for the file with the grid node of: a) 1” x 1” of an arc
 (c. 30 x 30 m in the terrain), b) 1,8” x 1,8” (c. 55 x 55 m in the terrain), c) 5” x 5” (c. 150 x 150 m in the
 terrain), d) the comparison of the relief intensity factor statistics for different grid node sizes.
 Source: author’s compilation on the basis of DTM from Wojskowy Ośrodek Geodezji i Teledetekcji, 2001 and maps
 edited by Mojski, 1974-1981.

                                                                                                           248
RESULTS
A map of the relief intensity in Pomerania (fig. 3) is a result of the analysis. It was
used to cut out each form from the DTM (the Poznań phase and the Pomeranian
phase of the Vistulian glaciation were distinguished for the comparison). Basic
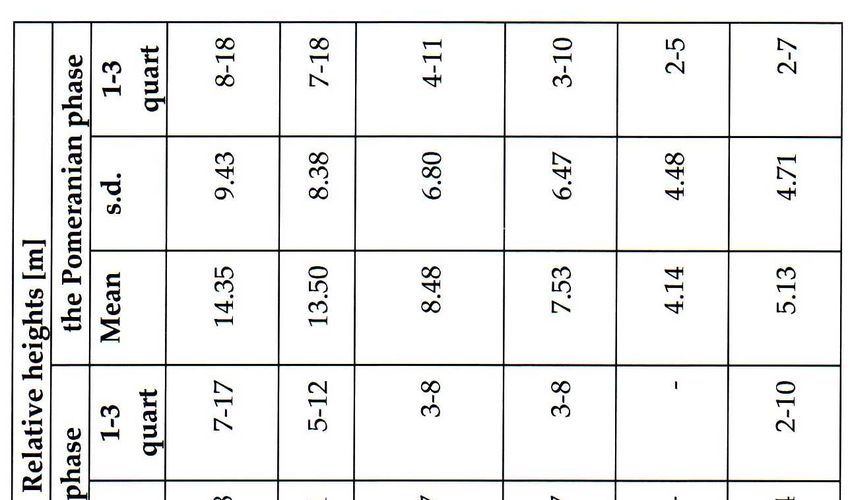
morphometric parameters were calculated for selected forms (tab. 2).
The carried out procedure of the morphometric analysis makes possible to dis-
tinguish some forms of the Pomeranian young-glacial landscape. Its main axis is the
central zone of end moraines (A), kames (B) and hummocky marginal zone
(according to the map edited by Starkel, 1980) as well as the undulated ground
moraine (C) with the relief intensity factor >9. This zone consists of the highest and
the most diversifying forms taking into consideration the relief – with the large
number of hummockies and hollows what is also presented in the longitudinal
profile a (fig. 4).
South of the central axis there is the zone of outwash plains (D) with the factor
from 6 to 9 (in a range of 1st-3rd quartile). The same values are characteristic of the flat
ground moraine situated north of the Pomeranian end moraines. Their surface is also
relatively diversified (fig. 4b) but values of relative heights are lower than it is in case
of the central axis. It must be emphasized that outwash plains are forms with the
largest range of the relief intensity factor values.
It results from different deposition conditions of fluvioglacial sediments. They
are connected with the dynamic state of the glacier and the deglaciation character (as
well as the changeability of the deposition conditions; Szafraniec, 2008a, 2008b).
Hence outwash plains proximal zones (usually deposited on the buried dead ice
blocks) have the diversifying surface with the factor even above 9. Typical outwash
fans, e.g. the Barlinek outwash fan, deposited during the maximum glacier extension
in mouths of ice-cored moraines gorges have the same morphometric parameters as
averages for outwash plains surface (tab. 2). Outwash plains deposited during the
extreme glacier floods reveal features typical for the proglacial stream valley with
the relief intensity factor below 6 (e.g. the Gwda outwash plain).
Proglacial stream valleys (E) and marginal lake basins (F) with the factor below
6 are the lowest and flattest forms (fig. 4c). Distinct edges usually separate them from
other forms.
Subglacial valleys were not distinguished in the table because their inner parts
could have different relief intensity factor values. The distinct separation in a form of
linear and parallel edges is their feature and it is visible on fig. 3.
249Fig.3. Map of the relief intensity of the Pomerania region : 1- lakes; 2-exam-ples of the pattern recognition
of selected young-glacial forms (see also table 2). Source: author’s compilation on the basis of DTM from
Wojskowy Ośrodek Geodezji i Teledetekcji, 2001 and maps edited by Mojski, 1974-1981.
Fig.4. Longitudinal profiles along selected
forms of the Pomeranian young-glacial land-
scape: a-along end moraines; b-along an out-
wash fan; c-along a proglacial stream valley.
Source: author’s compilation on the basis of DTM
from Wojskowy Ośrodek Geodezji i Teledetekcji,
2001; the vertical axis is 162.5 times outnumbered.
250Tab. 2. Relief intensity factor and relative heights for selected forms of the Pomeranian young-glacial landscape (the Poznań phase and the
Pomeranian phase of the Wisła glaciation distinguished.
Source: author’s compilation on the basis of DTM from Wojskowy Ośrodek Geodezji i Teledetekcji, 2001 and maps edited by Mojski, 1974-1981).
251FINAL REMARKS
The relief intensity factor makes possible to carry out the homogeneous morph-
ometric analysis for the region of any area.
It seems to be a good tool for the preliminary young-glacial forms classification
on the basis of DTMs and the analysis of their spatial relations. It also would be the
basis for next studies and for the test-areas selection to carry out any other studies
(e.g. geological).
The relief intensity factor gives similar results as regards the pattern recognition
and the forms morphometry, irrespective of the used model resolution (taking into
consideration average forms dimensions). The best model for regions with the area
as Pomerania is this one with the grid node of c. 3000-22500 m2 (from c. 55 x 55 m to
c. 150 x 150 m respectively). For areas of detailed studies the 10 x 10 m - 20 x 20 m
resolution seems to be more proper (c. 100-400 m2 of basic area in the terrain;
Szafraniec, 2008a, 2008b).
The presented method eliminates differences due to the location above sea level
as well as the relief freshness. Hence it is possible to compare analogous young-
glacial landscape forms in different latitudes (Szafraniec, 2008a, 2008b).
Acknowledgements
The author wishes to thank Wioletta Tomala-Kania who was so kind to check and
improve English of the text.
REFERENCES
Embleton, C., King, C.A.M., 1975: Glacial geomorphology. Edward Arnold, London,
ss. 573.
Galon, R., 1972: Pojezierze Pomorskie i przyległe wysoczyzny jeziorne [w:] Gomor-
fologia Polski. T. II. Niż Polski (red.): R. Galon. PWN, Warszawa, s. 129-156.
Goudie, A.S. (ed.), 2004: Encyclopedia of Geomorphology. Routledge Taylor &
Francis Group, Int. Ass. of Geomorphologists, London-New York, 1-2, ss. 1156.
Grygorenko, W., 1973: Liczbowe kryteria oceny wartości obrazu kartograficznego.
[w:] Polski Przegl. Kartogr., T. 5, nr 3, s. 117-125.
Jaroszewski, W., Marks, L. i Radomski, A., 1985: Słownik geologii dynamicznej.
Wyd. Geol., Warszawa, ss. 310.
Kondracki, J., 1994: Geografia Polski. Mezoregiony fizyczno-geograficzne. Wyd.
Naukowe PWN, Warszawa, ss. 340.
Kozieł, Z., 1990: Zmiany struktury kartograficznego obrazu energii rzeźby wywołane
różnymi układami i nałożeniami sieci pól odniesienia [w:] Polski Przegl.
Kartogr., T. 22, nr 3, s. 57-66.
252Lindner, L., 1992: Czwartorzęd. Osady, metody badań, stratygrafia. Wyd. PAE,
Warszawa, ss. 683.
Ławniczak, R., 2003: Próba zastosowania kartograficznej metody badań do okre-
ślania morfometrycznych cech rzeźby terenu. (w:) Polski Przegl. Kartogr., T. 35,
nr 1, s. 191-198.
Marks, L., Ber, A. i Gogołek, W., 2006: Mapa Geologiczna Polski, 1:500 000. Minister-
stwo Środowiska – Państwowy Instytut Geol., Warszawa, 1 arkusz.
Mizerski, W., Sylwestrzak, H., 2002: Słownik geologiczny. Wyd. Naukowe PWN,
Warszawa, ss. 242.
Mojski, E.J. (red.), 1974-1981: Mapa geologiczna Polski, 1:200 000, A – Mapa utworów
powierzchniowych. Instytut Geologiczny, Wyd. Geologiczne, Warszawa, arkusze:
Słubice, Pyrzyce, Gorzów Wlkp., Piła, Nakło, Toruń, Szczecin, Świdwin, Szcze-
cinek, Chojnice, Grudziądz, Dziwnów, Kołobrzeg, Koszalin, Słupsk, Gdańsk, Łeba,
Puck.
Mościbroda, J., 1981: Problematyka pola podstawowego w badaniach geografów
i kartografów polskich [w:] Polski Przegl. Kartogr., T. 13, nr 2, s. 56-66.
Numeryczny model terenu (NMT) dla Pomorza w formacie DTED, level 2, Wojskowy Ośrodek
Geodezji i Teledetekcji, Warszawa, 2001.
Richling, A., 1973: O sposobach przedstawiania urzeźbienia w terenach młodogla-
cjalnych [w:] Przegl. Geogr., T. XLV, z. 1, s. 109-117.
Starkel, L. (red.), 1980: Przeglądowa Mapa Geomorfologiczna Polski, 1:500 000. IGiPZ
PAN, Warszawa, arkusze Poznań i Gdańsk.
Szafraniec, J., 2008a: Sandry jako wskaźnik charakteru odpływu wód roztopowych
w świetle analizy morfometrycznej [w:] IV Międzynarodowy Rok Polarny (red.): A.
Kowalska, skrypt XXXII Międzynarodowe Sympozjum Polarne, Wrocław, s. 86-87.
Szafraniec, J., 2008b: Sandry jako wskaźnik charakteru odpływu subglacjalnego
lądolodu Wisły na Pomorzu (w świetle współczesnych procesów na Spitsbergenie
i Islandii). Praca doktorska, Uniwersytet Śląski, Sosnowiec, ss. 217 + załączniki.
Tadeusiewicz, R., Flasiński, M., 1991: Rozpoznawanie obrazów. PWN, Warszawa, ss.216.
253SUMMARY
The paper describes a relief intensity factor (RIF) as a method to: 1) recognize
main forms of the young-glacial landscape; 2) characterize their morphometry; 3) de-
termine their changes due time and different conditions, as well as 4) compare forms
on different altitudes. It consists of three factors: relative height RH and neighbor-
hood NH (counted on the basis of DTM) and also a structure of forms STR – their
grain composition GC and the shape FS (relied on geological maps). The model of
the Pomeranian relief intensity allows to predict characteristic values for selected
postglacial landscape forms. Taking into account the range of the I – III quartile,
these values are as follows: for marginal lake basins – 3-6 (mean 4.25); for proglacial
stream valleys – 4-7 (5.66); for outwash plains – 6-9 (7.88); for hills consisting of the
glacial till (end moraines, ground moraine) and also kames and eskers – 8-12, mean
9.20-10.33 (end moraines 10-12, mean 10.52).
254You can also read