Renewable Energy Technologies and the Broiler Poultry Industry - Cost reduction and income diversification
←
→
Page content transcription
If your browser does not render page correctly, please read the page content below
Renewable Energy
Technologies and the
Broiler Poultry Industry
Cost reduction and income diversification

A report for

By Ben Edser

2016 Nuffield Scholar

October 2018

Nuffield Australia Project No 1617

Supported by:

                                            1
© 2018 Nuffield Australia.
All rights reserved.

This publication has been prepared in good faith on the basis of information available at the date of publication
without any independent verification. Nuffield Australia does not guarantee or warrant the accuracy, reliability,
completeness of currency of the information in this publication nor its usefulness in achieving any purpose.

Readers are responsible for assessing the relevance and accuracy of the content of this publication. Nuffield
Australia will not be liable for any loss, damage, cost or expense incurred or arising by reason of any person using
or relying on the information in this publication.

Products may be identified by proprietary or trade names to help readers identify particular types of products but
this is not, and is not intended to be, an endorsement or recommendation of any product or manufacturer referred
to. Other products may perform as well or better than those specifically referred to.

This publication is copyright. However, Nuffield Australia encourages wide dissemination of its research, providing
the organisation is clearly acknowledged. For any enquiries concerning reproduction or acknowledgement contact
the Publications Manager on phone: (02) 9463 9229.

Scholar Contact Details

 Ben Edser
 23 Dovercourt Road, Toowong, QLD 4066
 Phone: 0438 337 960
 Email: ben.edser@gmail.com

In submitting this report, the Scholar has agreed to Nuffield Australia publishing this material in its edited form.

NUFFIELD AUSTRALIA Contact Details

Nuffield Australia
Telephone: (02) 9463 9229

Mobile: 0431 438 684

Email: enquiries@nuffield.com.au

Address: PO Box 1021, NORTH SYDNEY NSW 2059

                                                                                                                       2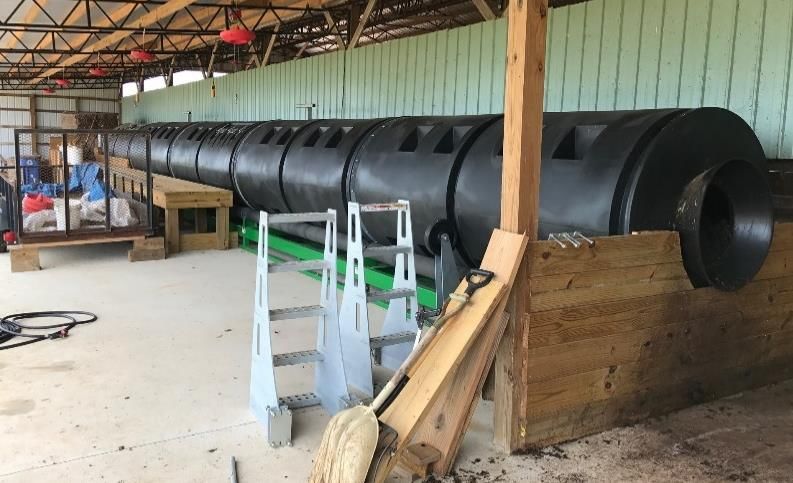
Executive Summary
The way things have been done in the past will not be the way things are done in the future.
The energy industry is ripe for disruption with a monopolistic energy sector, inconsistent
government energy policy, and titanic investment across numerous energy generating
technologies and storage. Large energy consumers are in the box seat to capitalise on this
momentum, with broiler farm owners possessing a few unique industry factors when it comes
to energy use and production.

Approximately 70% of operating costs at a broiler poultry operation fall into four key
operating cost areas – labour, electricity, gas and bedding. Significant operational advantages
exist where solutions can be implemented which tackle one or more of these items.

The political environment surrounding energy generation and supply in Australia is
inconsistent and lacks certainty. Australian farmers have experienced escalating electricity
and gas costs over the past ten years.

A technology solution which utilises large quantities of poultry manure as a feedstock input
to an anaerobic digestion (AD) renewable energy plant is now proven where sufficient
quantities of poultry litter are available or accessible. When this solution is implemented on
farm it has the potential to generate two to three times the energy required to run the farm,
creating the opportunity to generate an alternative income stream for the business through
selling the excess power.

Significant investment in renewable energy technologies internationally has seen substantial
reductions in the cost of renewables, particularly in the solar photovoltaic (PV) space.
Implementing a solar PV installation at some level at a broiler poultry operation today is a
viable investment. Scaling up this technology creates a diversified business opportunity where
a network connection is cost effective, and the exported power can be sold to an offtake third
party for a reasonable price.

Project funding assistance currently exists for the implementation of renewable energy
technologies in agriculture and more specifically, poultry.

Some very interesting alternative technology solutions exist to dispose of bird mortalities on
farm through enclosed vessel composting methodologies.

                                                                                             3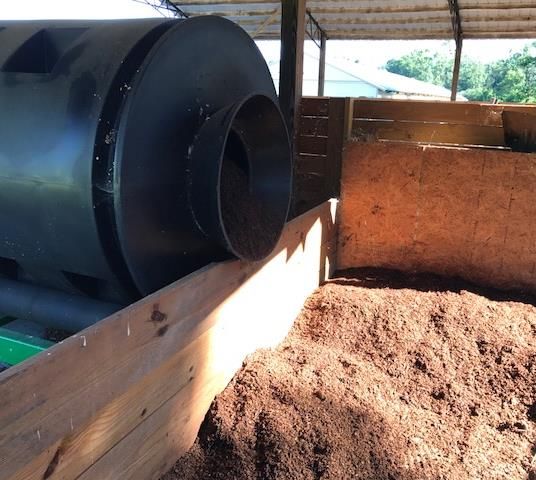
The opportunity for waste to energy and renewable energy technologies on a poultry farm to
offset energy costs (electricity and gas) has positive implications for the industry, farmers,
policy makers and the community as a whole.

                                                                                            4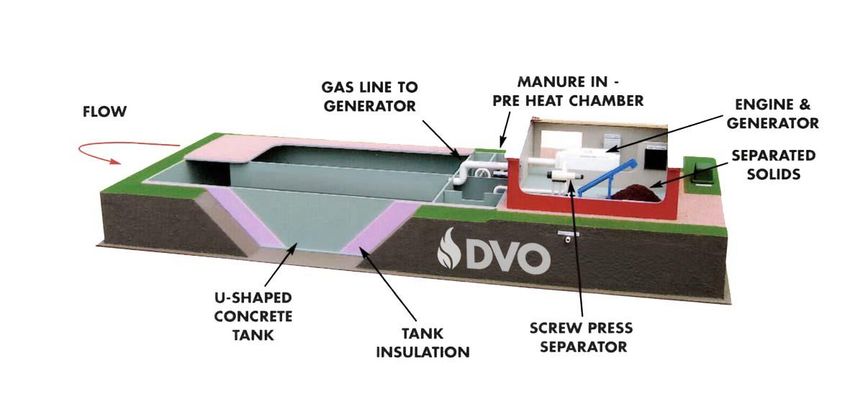
Table of Contents
Executive Summary.................................................................................................................... 3
Table of Figures .......................................................................................................................... 7
List of Tables .............................................................................................................................. 7
Foreword .................................................................................................................................... 8
Acknowledgements.................................................................................................................. 10
Abbreviations ........................................................................................................................... 11
Glossary .................................................................................................................................... 12
Objectives................................................................................................................................. 13
Chapter 1: Introduction ........................................................................................................... 14
   The Broiler Industry in Australia .......................................................................................... 14
       Key operating costs .......................................................................................................... 15
       Waste generation ............................................................................................................. 16
Chapter 2: The Australian Energy Climate ............................................................................... 18
   The Australian renewable energy policy and agenda .......................................................... 19
   Solar technology trends ....................................................................................................... 20
Chapter 3: Relevant Renewable Energy Technologies ............................................................ 22
   Litter to Heat ........................................................................................................................ 22
   Anaerobic digestion ............................................................................................................. 23
   Solar photovoltaic technology ............................................................................................. 24
Chapter 4: Global Perspective ................................................................................................. 25
   General ................................................................................................................................. 25
   Topic and report defining scholarship moments ................................................................. 26
       Case Study 1: Foresight Group ......................................................................................... 26
       Case Study 2: DVO Renewables ........................................................................................ 26
       Case Study 3: Xergi ........................................................................................................... 28
       Case Study 4: JinkoSolar, Canadian Solar, Trina Solar ...................................................... 30
Chapter 5: Knowledge Application and Opportunities Identification ..................................... 32
   Solar and Poultry .................................................................................................................. 32
       Potential energy generation - opportunity ...................................................................... 32
       On-farm energy requirement ........................................................................................... 33
       Two-way grid connection and export power ................................................................... 35

                                                                                                                                              5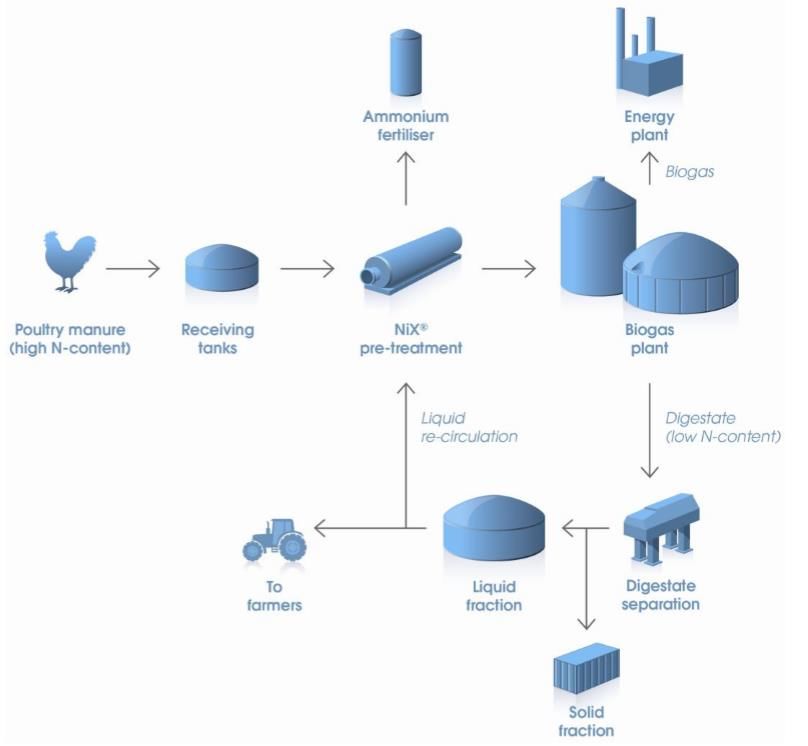
Solar and Storage ................................................................................................................. 36
   Anaerobic Digestion and Poultry ......................................................................................... 36
Chapter 6: Project Funding ...................................................................................................... 40
Conclusion ................................................................................................................................ 41
Recommendations ................................................................................................................... 43
Appendix A ............................................................................................................................... 44
   Stage 1 .................................................................................................................................. 44
      Projen................................................................................................................................ 44
      Wigley Farm ...................................................................................................................... 46
      Frogmary Green Farm....................................................................................................... 46
      Williams Industrial Services .............................................................................................. 47
      Moy Park ........................................................................................................................... 47
      James Cromie.................................................................................................................... 48
      Gilfresh.............................................................................................................................. 48
      Willen Biogas .................................................................................................................... 49
   Stage 2 .................................................................................................................................. 49
      Nuffield Global Focus Program ......................................................................................... 49
   Stage 3 .................................................................................................................................. 50
      United States of America – Georgia, Tennessee, and Alabama ....................................... 50
      UK AD & Biogas and World Biogas 2017 .......................................................................... 51
Plain English Compendium Summary ...................................................................................... 53

                                                                                                                                              6
Table of Figures
Figure 1: Australia's household energy prices and the consumer price index (Australian
Bureau of Statistics, 2015) ....................................................................................................... 18
Figure 2: Levelised cost of energy (Clean Energy Australia, 2016) .......................................... 20
Figure 3: Large-scale solar cost (Clean Energy Council, 2016)................................................. 21
Figure 4: Anaerobic digestion and the United Nations' Sustainability Goals (ADBA and WBA,
2017) ........................................................................................................................................ 23
Figure 5: Plug-flow digestate solid separation system (DVO Renewables, 2017) ................... 28
Figure 6: Photo of NGF Nature Energy in Holsted, Denmark (Source: Author) ...................... 30
Figure 7: Estimated average daily energy output of a solar PV system (Solari, 2017) ............ 32
Figure 8: Typical energy use of Australian broiler poultry farm with solar system overlay
based on actual interval data from poultry farm in South Australia ....................................... 33
Figure 9: Typical daily energy use for a poultry farm with a solar system's energy generation
overlayed (Solari, 2017) ........................................................................................................... 34
Figure 10: Poultry power opportunities (Xergi, 2017) ............................................................. 36
Figure 11: Photos showing Eco Drum composting vessels (Source: Author) .......................... 51

List of Tables
Table 1: Cost items as percentage of overall operating cost based on actual costs from
broiler farms in South Australia and Queensland ................................................................... 16
Table 2: Quantity of poultry manure with reference to poultry house based on personal
experience in dealing with product ......................................................................................... 17

                                                                                                                                               7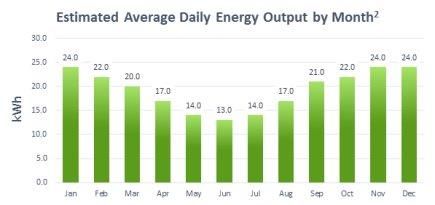
Foreword
Nuffield really is a journey… of a lifetime.

I became aware of Nuffield through an industry colleague and former Nuffield Queensland
poultry Scholar Jodie Redcliffe, when we were discussing progress in the poultry industry and
new ideas we were exploring in poultry farming in Queensland. We were working hard on
exploring alternative bedding materials and had started value-adding spent poultry manure
by composting it to create a high value soil conditioner. The seed idea of renewable energy
alternatives and waste-to-energy technology solutions had just been planted. I was strongly
encouraged to throw my hand up, and so the Nuffield journey commenced.

It was not until I arrived at the National Conference in Albury the enormity of the opportunity
and responsibility dawned on me.

We were advised that it is likely that the final report we would write may be slightly different
from that which we pitched and put forward in order to receive the scholarship. This certainly
held true for me.

Initially, a focus of my topic was to explore and further commercialise the potential associated
with the poultry manure waste stream which is generated from broiler farming operations,
with a focus on composting. However, it was the incredible notion associated with alternative
and renewable energy generation associated with a poultry farming enterprise which quickly
took over and became the focus.

The idea of an integrated renewable energy design utilising the by-product of an intensive
farming operation as an input into a renewable power plant that could generate energy far in
excess of its needs, whilst also harnessing the sun’s energy, was an idea that I was keen to
focus on and excited me.

With increasing electricity prices users are actively looking for an energy solution and with
significant investment having been deployed in the renewable energy sectors in recent times,
technology solutions are now more viable than before.

I had done significant research within Australia but continued to hear a similar response, that
large quantities of poultry manure could not be used as an input to an anaerobic digester. I
wanted to get in front of experienced industry professionals and meet some of the most

                                                                                              8
forward thinking and progressive farmers and technology providers who were operating in
the most innovative countries in the world, to get their view.

My travel took me to the United Kingdom (UK), Northern Ireland, Singapore, India, Qatar,
Turkey, France, United States of America (USA), Denmark and China.

I never expected to have the exposure, access, acceptance and holistic view that Nuffield
provided me. I saw more and learnt more than I ever expected possible.

I am proud to be able to report that I not only researched and analysed potential solutions
but am now looking at implementing these findings in Australia, through an opportunity to
start working for an agricultural and fund management company entering the poultry
industry.

                                                                                         9
Acknowledgements
The opportunity to undertake a scholarship, could not, and would not have been possible
without the devoted support of my wife Steph and both our families. At the time of being
awarded the scholarship, it was just the two of us that made up our beautiful family. During
the Nuffield journey, Steph and I were lucky enough to welcome our daughter Ivy. We also
renovated and sold a house, where most of the time I was either flying out or flying back in
right on time to line up with major life events. Steph kept everything going at home while I
travelled the world, so thank you.
To our India Global Focus Program (GFP) group – what a blast. We were fortunate to have
such an incredible group of people thrown together, who got along so well. It was like we had
known each other for decades. Australia, New Zealand, Ireland, Northern Ireland, and Canada
- quite the eclectic mix! We were energised and motivated, full of laughs and challenged each
other intellectually. Memories which are going to stay with me a lifetime.
I would like to extend a huge thank you to Rural Industries Research and Development
Corporation (RIRDC) Meat Poultry, now known as AgriFutures Australia, for standing behind
me and backing me to deliver on what I set out to achieve. I am grateful for the ongoing and
continued support I received during the scholarship tenure.
10Abbreviations
ABARES: Australian Bureau of Agricultural and Resource Economics and Sciences
AD: Anaerobic digestion
ARENA: Australian Renewable Energy Agency
AUD: Australian Dollar
CEFC: Clean Energy Finance Corporation
CHP: Combined Heat and Power
GBP: Great British Pound
GFP: Global Focus Program
GW: Gigawatt
kW: Kilowatt
kWh: Kilowatt-hour
LGC: Large-scale generation certificate
MW: Megawatt
MWe: Megawatt electric
m3: Cubic metres
PV: Photovoltaic
RET: Renewable Energy Target
RIRDC: Rural Industries Research and Development Corporation
USA: United States of America
USD: United States Dollar
UK: United Kingdom
W: Watt
11Glossary
Behind the meter Energy which is generated by and within an
operation and which is consumed by the
operation. Energy consumed does not come
from external sources (i.e. from the
network).
Grow-out period The time required to raise a broiler chicken
from a day old chick to a full-grown broiler
bird, ready for processing for meat
purposes.
kWh The kilowatt hour (symbolized kW⋅h as per
SI) is a composite unit of energy equivalent
to one kilowatt (1 kW) of power sustained
for one hour.
MW A unit of power equal to one million watts,
especially as a measure of the output of a
power station.
Solar PV Solar cells, also called photovoltaic (PV)
cells, convert sunlight directly into
electricity. PV gets its name from the
process of converting light (photons) to
electricity (voltage).
Solar module PV modules consist of PV cell circuits sealed
in an environmentally protective laminate
and are the fundamental building block of
PV systems.
12Objectives
• What can be done to reduce key operational expenditure on a poultry farm to increase
farm profitability.
• Understand what energy mitigation options exist, including renewable energy
technology solutions, and apply those most suitable to broiler poultry farming.
• Investigate and understand the strengths, weaknesses, opportunities and threats
associated with implementing an anaerobic digestion (AD) waste-to-energy solution
at a broiler poultry farm, looking at size and scale of operation.
• Understand whether it is technically possible to utilise large quantities of poultry
manure as a feedstock input in to an AD biogas plant.
• Investigate and understand the strengths, weaknesses, opportunities and threats
associated with implementing a solar solution at a broiler poultry farm, looking at size
and scale of operation.
• Analyse the investment and business case associated with applying any cost mitigation
or alternative income revenue opportunity that come with these two renewable
energy technologies; so that the outcomes are in a manner suitable for the industry
and Australian farmers.
• Understand the macro economic and political environmental factors associated with
these technology solutions in Australia.
• Ensure international solutions are suitable for Australia when applied.
• Enjoy the journey!
13Chapter 1: Introduction
When first applying for a Nuffield Scholarship, I was committed to gaining enough information
and knowledge to allow me, with a degree of confidence, on the suitability, relevance, and
ability to implement renewable technology options in an Australian poultry setting.
The broiler poultry industry has a relatively unique set of factors which are reserved to only a
few intensive farming industries. Broiler poultry operations are very large consumers of
energy and water. Further, livestock is held in very large poultry houses and operations
produce significant waste.
Energy use and cost is front of mind with price escalations continuing; and investment in
renewable energy technologies are at never-before-seen levels.
Perhaps the cost of energy has finally aligned to allow investment of alternative energy
solutions at poultry operations.
The Broiler Industry in Australia
Chicken is the fastest growing and most consumed source of animal protein in Australia, with
the Australian chicken industry producing more than 630 million birds per annum (The
Australian Chicken Meat Federation ((ACMF), 2011). The total volume of chicken consumed
in Australia grew at a compounding annual rate of approximately 4% per annum over the past
25 years to 2015, with chicken consumption almost doubling in this period. On a per capita
basis, Australian people consume just over 41 kilograms of chicken each per annum, and
chicken now represents over 35% of total animal protein consumed (ACMF, 2011).
The gross value of poultry meat at time of slaughter was forecast by the Australian Bureau of
Agricultural and Resource Economics and Sciences (ABARES) to total AUD2.179 billion in
2010–11, and the industry estimates that consumers currently spend approximately AUD5.6
billion per annum on chicken meat in retail outlets and restaurants. This is expected to grow
at a rate of 2.7% per annum to reach AUD7.6 billion by 2022 (ACMF, 2011). Chicken in
Australia is now the most affordable animal protein, having a 2.1 times price-per-kilogram
advantage over the next cheapest (being pork), and a 3.2 times price-per-kilogram advantage
over the most expensive protein (beef) in 2015 (ACMF, 2011)
14This growing affordability can be largely attributed to a phenomenal improvement in feed
conversion ratio, improved genetics, feed and nutrition, technology and the growing
environment. In 1975 it took 4.66 kilograms (kg) of feed and 64 days to grow-out a bird;
compared to 2011 where it required 3.4 kg of feed and 35 days to reach the same outcome
(ACMF, 2011).
With more than 95% of chicken meat grown and processed in Australia being consumed
domestically, the industry is well set-up to capitalise on further domestic and international
growth and opportunities.
To stay nationally competitive and drive international export opportunities, industry must
focus on mechanisms and innovative solutions which keep cost down, or at least, reduce the
rate of increase in relation key cost areas.
Key operating costs
The broiler poultry industry is typically structured such that poultry farmers hold
responsibility for the infrastructure that is required to house and grow broiler birds, including
sufficient quantity and quality of water. The farmer will enter into an agreement with a
processor, where the processor will supply day-old chickens, the feed required to raise and
grow birds and some veterinary and support services. The processor will pay an agreed base
rate to the poultry farmer (usually on a square metre or per bird basis), and often an incentive
or bonus component as well.
The farmer is responsible for all operational costs associated with the farming operation,
including labour, electricity, gas, bedding, litter removal and shed cleanout, water supply, any
rates and taxes, and any other costs and services required to operate the farm.
This structure incentivises the farm owner to innovate, analyse and potentially implement
technology or solutions that assist with farming and operational cost reductions.
In consultation with industry, analysis of the operational expenses associated with a broiler
poultry farm commonly shows that a few key items make up a large percentage of overall
operating costs. This is shown in Table 1 below.
15Cost item Average % of overall operating cost
Labour 33% (30-35%)
Electricity 17% (15-20%)
Gas 12% (10-14%)
Bedding 13% (10-15%)
TOTAL 75%
Table 1: Cost items as percentage of overall operating cost based on actual costs from
broiler farms in South Australia and Queensland
Outside labour, which is controlled largely by external policies and factors, any cost mitigation
strategy in relation to electricity, gas and bedding (which are responsible for approximately
40% of total operating expenses) will flow directly to the farms viability and profitability.
Waste generation
A broiler farmer is responsible for removing and disposing of spent litter at the end of a grow-
out period (up to 55 days).
Spent litter, or poultry manure, is made up of fresh bedding that was put in the sheds prior to
chicken placement and the broiler birds’ excreted waste accumulated throughout the grow-
out period. The spent product can be made up of anywhere between 20 to 50% of bedding,
and 50 to 80% of animal excrement. This balance is largely driven by whether the processor
has a single batch or multi-batch litter policy. A single batch policy requires the farmer to
completely remove all litter from the shed at the end of the grow-out period; whereas a multi-
batch policy allows a farmer to windrow a portion of the litter from the shed and reuse this
litter, with the addition of some fresh bedding, for subsequent grow-out periods. Different
processors in different states within Australia enforce different policies. For example,
Ingham’s growers in Queensland have traditionally been allowed to multi-batch their litter,
whilst Baiada has strictly enforced a single batch policy. There is inconclusive research as to
whether one policy is more favourable however those who run single batch policies indicated
that bio-security is the primary reason for this decision.
Table 2 outlines baseline estimates of the quantity of waste that can be generated from a
broiler poultry farm. N.B: this is based on a 165 metre x 16 metre broiler shed where the
processor requires the broiler farm to run a single batch policy. This assumes six grow-out
periods per annum.
16Number of sheds Spent litter per batch Spent litter per annum
6 1,080m3 (430t) 6,480m3 (2,600t)
13 2,340m3 (935t) 14,000m3 (5,600t)
40 6,000m3 (2,400t) 36,000m3 (14,500t)
Table 2: Quantity of poultry manure with reference to poultry house based on personal
experience in dealing with product
Traditionally, spent litter has been perceived as a problematic and onerous by-product of the
core business of broiler poultry farming. Poultry farmers have traditionally relied on
contractors to clean out and remove the poultry litter from sheds. This business model has
some different iterations, but most commonly little money will change hands, and the
contractor will provide the service for the value of the spent litter. Frequently the contractor
will take the product from shed to farm where it is used as manure fertiliser and soil
conditioner.
This background information is critical to analysis made later in this report, where it will be
outlined how this once problematic by-product has significant opportunity.
17Chapter 2: The Australian Energy Climate
Australians have experienced significant electricity price increases in recent times. Household
electricity prices doubled over the ten years between 2004 and 2014 (Clean Energy Australia,
2016).
Figure 1 below tracks the increase in household electricity prices in Australia against the
consumer price index.
Figure 1: Australia's household energy prices and the consumer price index (Australian
Bureau of Statistics, 2015)
A recent report outlined that between 2006 and 2016, electricity prices rose 136% in
Queensland, 118% in Victoria, 109% in New South Wales, and 87% in South Australia (Clean
Energy Council Australia, 2016).
The Australian Electricity Commission expects wholesale costs (the actual cost of generating
power) to rise over the next few years with the closure of the South Australian Northern
Power Station and the Hazelwood Power Station in Victoria (Clean Energy Australia, 2016).
A large percentage of Australia’s base load power plants are fuelled by gas, and with some of
our large energy companies committed to contracts to supply gas offshore to countries such
18as Korea, Japan and China, the economics of supply and demand have been skewed
unfavourably for the Australian energy consumer (Clean Energy Australia, 2016).
With intensive agricultural industries consuming significant quantities of both electricity and
gas, and with forecasts pointing to further increases, the luxury of simply ‘doing nothing’ and
relying on historical certainty and stability in the national energy sector, may no longer be an
option for farmers.
Farmers and large energy consumers must take it upon themselves to innovate and think
differently to underpin the future viability of their operations and their industries.
The Australian renewable energy policy and agenda
Investment in renewable energy has been challenging over the last number of years due to
the inability of policy makers to commit to any long-term plan for the electricity generation
sector (renewable and traditional energy). Renewable energy has been used as a political tool
in recent years which has created instability and hindered long-term planning by businesses
across all sectors. A bipartisan deal on Australia’s Renewable Energy Target (RET) was struck
in 2015, which provided some short-term relief in this space. The RET seeks to achieve a
33,000 gigawatt (GW)/hour target of large-scale renewable energy by 2020 (Clean Energy
Australia, 2016).
At the time of writing this report the Australian Government were considering the
implementation of the National Energy Guarantee which is focused on delivering lower
energy pricing for consumers in to the future and there has been ongoing discussion in
relation to a royal commission investigation in to the energy industry. However, just prior to
publishing this report the Prime Minister changed from Malcolm Turnbull to Scott Morrison
and it would seem the National Energy Guarantee is now off the table. This goes directly to
the heart of the issue, a political environment which lacks certainty and consistent long-term
policy. A change of government at the next federal election would again likely result in
another change in energy policy.
The business case for renewables continues to improve, and the Bloomberg New Energy
Finance analysis confirmed renewable energy is now the cheapest type of power generation
that can be built in Australia (Clean Energy Australia, 2017). The cost of large-scale solar
generation has dropped 40% in recent years, due to significant investment in the industry
19which has resulted in innovative steps forward in the cost of production. This has seen the
emergence of three significant multinational companies - Trina Solar, Canadian Solar and
Jinko. These three companies alone have a combined market capitalised value of circa USD3
billion (Clean Energy Australia, 2016).
Figure 2: Levelised cost of energy (Clean Energy Australia, 2016)
In addition to federal policies, Australia’s States and Territories have also been proactive in
their agendas. For example, Queensland has set a policy of generating 50% of its power use
being renewable energy by 2030, and South Australia has set of target of 50% renewable
energy by 2025 (Clean Energy Australia, 2016).
Solar technology trends
Globally, the solar power generation capacity is 305 GW. More than 76GW of this capacity
was built in 2016, which was an increase from 50GW the previous year (Clean Energy Australia
Report, 2016). The rapid increase in investment, particularly solar photovoltaic (PV)
technology, is driving competition and huge reductions in production costs (Clean Energy
Australia, 2016).
Deutsche Bank has noted that total module costs of leading Chinese solar companies have
decreased from around USD1.31/watt (W) in 2011 to around USD0.50/W in 2014, and
approximately USD0.40/W in 2017. This was confirmed with a pricing request from one of the
top three panel manufacturers at USD0.38/W. These cost reductions, to a large extent, are a
20result of reductions in manufacturing costs, the fall in polysilicon costs and improvement in
conversion efficiencies. That represents a fall of around 60% in just three years. (Clean Energy
Australia, 2016).
Figure 3: Large-scale solar cost (Clean Energy Council, 2016)
21Chapter 3: Relevant Renewable Energy
Technologies
When considering a typical broiler poultry operation, and with an understanding of the
strengths of some of the renewable energy technologies available, some technologies present
themselves more favourably for further consideration. The enclosed housing structure of a
broiler shed means poultry farms have a large amount of roof surface area available for use.
Further, as outlined previously, there is a significant quantity of waste produced as a by-
product of broiler poultry operations. Given this, the renewable energy technologies that
should be considered are:
• Litter to heat.
• Anaerobic digestion.
• Solar PV energy generation.
Litter to Heat
There are a number of technology options which exist which use poultry litter as a feedstock
to generate heat. Some include incineration, pyrolysis and gasification. All are premised on
the requirement to utilise poultry manure as a feedstock to generate thermal energy in the
form of steam, hot water and electricity usually in the form of a boiler and steam turbine.
Utilising poultry litter as a feedstock in a renewable energy plant in this form generates a by-
product low carbon ash, or high carbon biochar.
Based on initial business case and feasibility investigations, these technologies were not
pursued in a detailed analysis due to inability to gain levels of comfort and confidence around
the by-product which was generated by the process, being biochar, and to which the business
case required as income stream to apply in order to make feasible.
There is industry discussion of the high value nature of biochar in the marketplace. However,
whenever these discussions were pursed in order to understand the detailed commercial
practicalities of achieving the discussed high prices (for example + $1,000 / tonne), there did
not appear to be an established fluent market trading in the quantities and at the rates
required to enable a business case to be built. The value of composted poultry manure is
understood and there is awell understood market operating and trading in these product
22lines. As a result, detailed further analysis and investigation was not undertaken in relation to
this technology area.
Anaerobic digestion
Anaerobic Digestion (AD) is the principal biological technology which forms the foundation of
this report. AD can be used to recover energy from organic waste and involves the conversion
of biodegradable organic matter to energy by microbiological organisms in the absence of
oxygen. The biogas produced in the process is a mixture of methane and carbon dioxide and
can be used as a fuel for heating and electricity production. The residue left behind, known
as digestate, is semi-solid and has further opportunities as a liquid and solid fertiliser (Warren
et al, 2013).
This technology solution, not only delivers an outcome for energy and gas, but as was outlined
at the UK AD and Biogas and World Biogas Expo 2017 (attended as part of the travel program),
AD and biogas can also help reach the United Nations’ Sustainable Development Goals due to
its ability to provide a sustainable energy source, which outlines 17 specific targets that were
to be adopted by countries in 2015 to end poverty, protect the plant and ensure prosperity
for all as part of a new sustainable development agenda (Warren et al, 2013).
Figure 4: Anaerobic digestion and the United Nations' Sustainability Goals (ADBA and
WBA, 2017)
23Solar photovoltaic technology
Solar panels use energy from the sun to generate electricity. The conversion of sunlight into
electricity takes place in cells of specially fabricated semiconductor crystals (Clean Energy
Council, 2016). When sunlight is absorbed by these materials, the solar energy knocks
electrons loose from their atoms, allowing the electrons to flow through the material to
produce electricity. This process of converting light (photons) to electricity (voltage) is called
the photovoltaic effect.
24Chapter 4: Global Perspective
General
The overall strategy applied to personal travel was to focus on countries which are
experiencing significant investment and uptake in renewable energy technologies, to see and
experience the latest in the renewable energy space and state-of-the-art generators.
In addition to visiting and interacting with as many farmers as possible, the author met with
technology and industry experts to allow the ability to investigate the fundamental issues,
solutions and finer details of what was being investigated. It was also important to gain a
holistic and comprehensive understanding of these technologies to ensure they were fully
understood improving confidence around recommending the adoption of these solutions in
an Australian setting.
Travel was therefore broken down in to three key trips. The structure of this report provides
for a general overview, with a detailed trip visit breakdown included in Appendix A. There
were a few key visits which were topic-defining moments which are included in the body of
the report. These include Foresight Group in London, DVO in the United States, Xergi in
Denmark, and the three solar manufacturing plants in Shanghai, China.
The first trip involved the Contemporary Scholars’ Conference in Ireland, followed by personal
travel and topic investigation in the UK. This involved meetings with AD scientific experts,
incineration technology experts, a large number of different farms with on-farm anaerobic
digesting units, and a meeting with an asset and renewable fund manager who is investing in
renewables in Australia.
By the end of this first stage of travel, industry experts, technology and engineering providers
and technology operators had helped further an understanding of the ancillary and add-on
opportunities that some waste-to-energy technology solutions could provide. Meetings with
financing companies also enabled a good understanding of what is required to fund a project.
This stage of travel identified a major challenge in the initial thinking. All the experts,
technology providers and operators saw a major issue with a high chicken manure input AD
proposal. It was also clear that all stakeholders involved in this renewable energy space
25required certainty from Australia’s policy makers to ensure the offtake agreement required
to underpin a feasible project would not be clouded with ambiguity.
It was evident that countries where a lot of investment in this technology was occurring,
generally had some form of secure long-term renewable energy subsidy in place.
The second trip was the Global Focus Program (GFP). This included visiting Singapore, India,
Qatar, Turkey, France and the USA.
The third and final trip occurred after the GFP. This provided the ability to apply what was
learned from the first two trips and focus on a well-planned program. It also allowed time to
better understand the challenges raised so further travel could be targeted at investigating
how to overcome these identified issues. This trip included the USA, Denmark, UK and China.
Topic and report defining scholarship moments
Case Study 1: Foresight Group
London
The author was aware of the creation of the Australian Bioenergy Fund, which was being
managed by the Foresight Group and where the Clean Energy Finance Corporation (CEFC) had
committed AUD100 million as a cornerstone investment in a new equity fund for bioenergy
and energy from waste. The Foresight Group has approximately GBP1.8 billion (AUD3 billion)
of funds under management (CEFC, 2015). The author met Nigel Aitchison who leads and
manages the origination, execution and monitoring of Foresight’s investments in the
bioenergy and waste infrastructure sectors. This allowed the opportunity to dig down into the
structuring and return expectations for an investment manager and fund, like Foresight. They
engaged and worked through the feasibility and financial modelling requirements for a
‘bankable’ project. Shortly after, the Foresight Group had employed an Australian-based
company representative who the author has met with a number of times.
Case Study 2: DVO Renewables
Steve Dvorak, Wisconsin, USA
Much of the technology seen in Europe was based on a continuous stir tank system (Appendix
A), it was clear that DVO Renewables (DVO) offered a very different ‘plug-flow’ technology
solution.
26DVO is North America’s largest biogas company and the company has a two stage Linear
Vortex patented technology solution.
As had been clearly outlined earlier in the UK, unless other waste streams can be sourced and
added, or a large amount of water is utilised to dilute the manure, AD plants cannot run on
poultry manure alone. This was a scholarship defining moment.
Steve Dvorak from DVO did not hold the same reservations for a high content chicken manure
AD system, advising that his system can run on 100% chicken manure as a feed input. As
broiler poultry manure is around 60% solids and 40% moisture, without some form of
technology solution these solids would have to be diluted to 7 to 10% for the digester to
handle feed input.
However, even where this recirculation problem is overcome there is another issue with 100%
poultry manure as an input. With continuous liquid recycling comes an accumulative build-up
of ammonium/ammonia (nitrogen). At levels above 3,500 parts per million this build-up
becomes toxic to the methogenic bacteria and the digester will fail. The high protein poultry
manure biodegrades first into amino acids, and then from amino acids into ammonium
(Dvorak, 2017).
DVO has a multi-solution system which deals with this issue and allows the digester to run
only on poultry manure. Part of this solution is in the ‘plug-flow’ tank system, see Figure 5.
DVO has developed a digester system that uses digestate after it has been through a solids
separation system. The solids separation system reduces the total solids content of the
digestate so that this effluent water is suitable for dilution of the high solids content poultry
manure. DVO also have a solution which removes the ammonium/ammonia from the liquid
digestate to bring this below the toxic level which effect the methogenic bacteria. This process
also creates a valuable high-nitrogen fertiliser product for use in agriculture (Dvorak, 2017).
A large number of DVO digesters are used in the dairy industry in the USA, where DVO also
provides another technology solution that screw separates the solid from the liquid in the
digestate, allowing the solid form digestate to be reused in the dairy barn as bedding.
There was also a visit to a local DVO plant at a dairy farm. Unfortunately, due to a disease
outbreak, access to the poultry farm digester was not possible.
27DVO’s set-up and the system was impressive. It provided a solution to a major challenge – a
high quantity of chicken manure feedstock. Steve and his family gave many generous hours
of their time during the visit.
Figure 5: Plug-flow digestate solid separation system (DVO Renewables, 2017)
Case Study 3: Xergi
Denmark
The author’s interest in the Willen Biogas operation (see Appendix A), led to ongoing
communication with Xergi, in Denmark. Xergi highlighted how they had been running a pilot
scale 100% chicken manure AD plant for a number of years, and were currently building a
plant in Northern Ireland which would run on 100% poultry manure.
The author met Xergi’s Country Manager Jorgen Fink at their head office in Stovring, followed
by Foulum, where they were operating their test facility which included the chicken manure
pilot plant. Following this, there was a visit to Holsted plant which was the latest AD plant that
Xergi had constructed. The Foulum plant is situated at the Aarhus University Faculty of
Engineering. The plant consists of a full-scale biogas production plant and a test plant.
In addition to the actual production plant on site, which runs a 625 kilowatt (kW) engine, the
author was particularly interested in the research and testing centre.
The test plant consists of four digesters of 2 x 30m2 and 2 x 10m2 respectively. The plant is
one of the world’s largest facilities for biogas research and enables development of biogas
and manure separation technologies (Fink, 2017).
28The site has a well-equipped lab together with conference facilities which make the plant a
central point for Danish biogas research. Xergi’s own research and development department
is based at the research centre with a number of lab and pilot scale test plants, including the
chicken manure pilot scale plant which has been successfully running for two years.
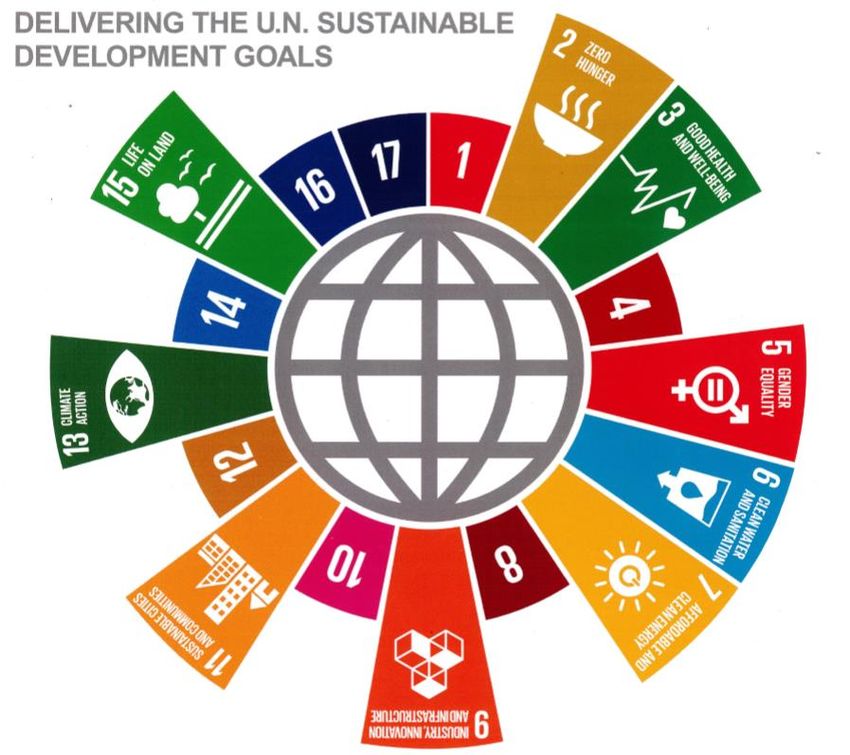
There was a visit to NGF Nature Energy Holsted, Denmark, and a biogas plant based on animal
slurry, deep litter and industrial food waste. The plant is owned by the Danish energy
company NGF Nature Energy, and the local farmers supply the plant and Xergi.
NGF Nature Energy wants to replace natural gas with bio-methane. The produced biogas is
cleaned and upgraded to bio methane. The annual bio methane production is approx. 13
million m3. This corresponds to the annual energy needs of approximately 8,000 households
which is enough biogas to run continuously a generator set of approximately seven megawatt
electric (MWe). The bio methane is of the same quality as natural gas and is compressed and
fed in to the national natural gas grid (Fink, 2017).
It was an extremely impressive and cutting-edge energy solution and provided an
understanding to the scale of the engineering that is required to deliver a successful AD and
biogas solution project.
Xergi also highlighted some of the detail around their Ballymena project. The Northern Ireland
plant, which is currently under construction, is to run on a high quantity of chicken manure
feedstock. The plant will will generate three megawatt (mW) of renewable electricity from up
to 40,000 tonnes of chicken litter each year. The electricity will be sold through the electricity
network and is enough energy to power 4,000 homes. The capital cost of the plant will be
approximately GBP20 million. The project is being developed by Irish-based renewable energy
development firm, Stream BioEnergy, and will be co-financed by funds managed by Foresight
Group and Invest Northern Ireland (Fink, 2017).
Xergi will use the pre-treatment technology NiX (Nitrogen Extraction) in the Ballymena plant
to pre-treat the chicken manure feedstock which is high in nitrogen. The nitrogen is isolated
as ammonium sulphate, which can be disposed of or used as commercial fertiliser.
29Figure 6: Photo of NGF Nature Energy in Holsted, Denmark (Source: Author)
Case Study 4: JinkoSolar, Canadian Solar, Trina Solar
Shanghai, China
The author had a keen interest in visiting Shanghai as the largest solar PV companies in the
world had a base in and around this area. Factory tours were arranged with the top three
largest solar PV module suppliers (by shipment) in 2016.
In any solar project, solar modules and panels accounted for approximately 50% of total
project cost, and any major steps forward in technology solutions and cost savings are going
to be driven by the power producing cells.
The author was keen to see first-hand the manufacturing and production processes these
companies undertake that allows the supply of such a significant quantity of solar PV modules
to the market, which continues to grow.
These companies have become corporate powerhouses, each with a market capitalisation of
circa USD1 billion, meaning these three companies have a combined market presence of circa
USD3 billion (AUD3.8 billion) in the global market (Bloomberg, 2017). Jinko Solar for example,
had shipments in 2016 of approximately 3.7 GW of solar PV modules.
Firstly, a visit to Canadian Solar at Suzhou New District, Jiangsu, China. The company has state-
of-the-art facilities in Canada, China, South East Asia and Brazil; and employs around 9,000
people worldwide.
30The factory tour was insightful as it became obvious how automated, mechanised and robotic
the production floors were. The majority of the process is completely automated, and every
module and solar cell is checked for production and performance before being packed. Every
module is trackable and traceable.
Next, a visit to Jinko Solar, just under two hours outside of Shanghai, near Yuanhuazhen.
JinkoSolar distributes its solar products and sells its solutions and services to a diversified
international utility, commercial and residential customer base in China, USA, Japan,
Germany, the UK, Chile, South Africa, India, Mexico, Brazil, the United Arab Emirates, Italy,
Spain, France, Belgium, and other countries and regions. JinkoSolar has an integrated annual
capacity of 5.0GW for silicon ingots and wafers, 4.0GW for solar cells, and 6.5 GW for solar
modules, as of March 31, 2017.
JinkoSolar’s manufacturing is also completely automated, mechanised and robotic. The
author spent time in the research and development department with the engineers working
on cutting-edge technologies and advances in solar PV.
The final visit was to Trina Solar, a Changzhou factory outside of Shanghai. This visit to Trina
confirmed that all three market and production leaders have invested heavily and achieved a
very productive, efficient and automated manufacturing process with the use of robots
wherever possible, driving down costs of production. In addition to solar module, it was also
possible to see the Solar Best, which focuses on storage and the use of battery technology,
which provided the opportunity to discuss and explore the use of storage integration in a solar
installation, something seen as crucial in the analysis of the overall solar renewable business
case.
Canadian Solar, JinkoSolar and Trina Solar all have an Australian presence and Australian
headquarters. They provide comparable guarantees and warranties offering ten-year
manufacturing warranties and a 25-30-year guarantee on power output. A strong
recognisable Australian-suitable warranty is critical when considering solar modules,
particularly when considering a poultry shed can have a life expectancy of over 25 years.
31Chapter 5: Knowledge Application and
Opportunities Identification
Solar and Poultry
When considering and analysing the suitability of solar PV systems for broiler poultry farms
four factors must be considered:
• the potential for energy generation.
• on-farm energy use requirements.
• network connection.
• potential power export ability.
Potential energy generation - opportunity
“Every few minutes enough energy hits the earth’s surface to satisfy requirements for an
entire year, if we could suitably harness, capture and utilise it” (Clean Energy Regulator, 2016)
Australia has a climate which is well suited to generating power from the sun. A poultry farm’s
location will therefore provide the first key criteria in establishing the suitability of a solar PV
installation.
Solar generation also changes depending on the intensity of the irradiance and energy
received at different times of the year. A system’s typical variance between summer and
winter is illustrated in Figure 7.
Figure 7: Estimated average daily energy output of a solar PV system (Solari, 2017)
32A solar PV system will only generate energy when the sun is shining, and the quantity of
energy that a system will produce will vary throughout the day.
On-farm energy requirement
A poultry farm’s energy use is driven by a number of factors.
A poultry operation will usually grow-out approximately 5.5 to 6 cycles of broiler chickens per
annum. Each of these grow-out periods can be up to 55 days in length. This means there can
be up to ten days between batches, with no chickens on site. A farm will generally have a
greater requirement for cooling when birds are larger and the density of chickens in sheds is
highest.
Energy use is also seasonally dependent, with a greater requirement for cooling in the
summer and a larger gas use requirement for heating in the winter.
Figure 8 provides an example of electricity used at a typical poultry farm in Australia during a
12-month period, as well as the typical energy generation of a solar PV system. Increases in
electricity use at a broiler farm correlate with grow-out periods and vary at different times of
the year.
Typical Poultry Farm Energy Use Graph kWh
90
80
70
60
50
40
30
20
10
0
Figure 8: Typical energy use of Australian broiler poultry farm with solar system overlay
based on actual interval data from poultry farm in South Australia
33Figure 9: Typical daily energy use for a poultry farm with a solar system's energy
generation overlayed (Solari, 2017)
Unlike the energy use requirements of a broiler poultry farm, a solar PV system’s generation
typically runs at stable levels throughout the year. As such, the technology has not
traditionally been considered feasible. However, as has been outlined, the continuing fall in
solar module pricing and the escalating energy costs in Australia have rendered the use of
these technologies at poultry farms feasible.
Research has indicated that where farms are paying in the vicinity of AUD0.10-0.15/kilowatt-
hour (kWh) during peak times, solar PV investments where installations offset on-farm energy
usage are able to achieve good return on investment.
A solar PV system cannot however be thought of as a solution to ‘take the farm off the grid’
but rather a solution to help mitigate costs, and possibly provide a diversified income
opportunity.
In considering solar PV, it is particularly important to understand how electricity retailers
structure billing and how different tariffs work. Typically, electricity agreements are made up
of a few key components, two of which account for the majority of the bill.
34The usage component is directly linked to actual consumption of electricity and can have a
number of rates charged at cents per kWh (i.e. peak and off-peak). The agreement will also
have a network component to account for the infrastructure required to bring power to the
site (poles and wires). The usage and network split on the agreement is important to
understand, as solar will allow the reduction of usage but not generally network cost, as the
farm still requires a network connection and infrastructure. A possible strategy to reduce
network costs could be to consider a storage technology, like a battery, to try and lessen the
draws on the system.
Two-way grid connection and export power
With a solar PV system installed, the opportunity to diversify income and help reduce energy
costs is presented to a farming operation when two factors align:
• its location enables it to obtain a two-way grid connection at a reasonable cost.
• an offtake agreement can be struck with a third party to purchase the power
generated on site which is export to the network.
The challenge here, is that commonly network infrastructure is not set up or able to accept
exported power, as the transformers and substations are not designed to or capable of taking
exported load back to the system.
When both these factors align however, the opportunity exists to install further solar PV at
the farm and increase the energy sold to the network. If the limiting factors and hurdles of
the network’s capacity to handle electricity coming back to the network at that location and
finding a third party to purchase the surplus electricity at a reasonable price can be overcome,
investment in solar PV is scalable. Here the farm asset owner has the ability to mitigate
electricity costs and diversity farm income with an onsite renewable energy power plant.
A solar PV installation in some form will generally make a good business decision right now
for broiler poultry farmers. Further, because solar PV is acquired in circa 300W panels, in the
future where an increase in generation becomes feasible for a farm, these systems can be
easily added to and expanded. Scaling the technology provides the ability to negotiate a
better price for the offtake agreement, and also disperse potential capital, if required, to
obtain a two-way network and export connection.
35You can also read