Review of Graphene-based Thermal Polymer Nanocomposites: Current State of the Art and Future Prospects
←
→
Page content transcription
If your browser does not render page correctly, please read the page content below

Review of Graphene-based Thermal Polymer
                                                  Nanocomposites: Current State of the Art and
arXiv:2008.10752v1 [physics.app-ph] 24 Aug 2020

                                                  Future Prospects
                                                                Jacob S. Lewis, Timothy Perrier, Zahra Barani, Fariborz
                                                                Kargar and Alexander A. Balandin
                                                                Phonon Optimized Engineered Materials (POEM) Center, University of California,
                                                                Riverside, CA 92521, USA
                                                                Materials Science and Engineering Program, Bourns College of Engineering,
                                                                University of California, Riverside, CA 92521, US
                                                                Department of Electrical and Computer Engineering, Bourns College of Engineering,
                                                                University of California, Riverside, CA 92521, USA
                                                                E-mail: jlewi014@ucr.edu, balandin@ece.ucr.edu

                                                                26 August 2020

                                                                Abstract. We review the current state-of-the-art of graphene-enhanced thermal
                                                                interface materials for the management of heat the next generation of electronics.
                                                                Increased integration densities, speed, and power of electronic and optoelectronic
                                                                devices require thermal interface materials with substantially higher thermal
                                                                conductivity, improved reliability, and lower cost. Graphene has emerged as a
                                                                promising filler material that can meet the demands of future high-speed and high-
                                                                powered electronics. This review describes the use of graphene as a filler in curing
                                                                and non-curing polymer matrices. Special attention is given to strategies for achieving
                                                                the thermal percolation threshold with its corresponding characteristic increase in the
                                                                overall thermal conductivity. Many applications require high thermal conductivity
                                                                of the composites while simultaneously preserving electrical insulation. A hybrid
                                                                filler graphene and boron nitride approach is presented as possible technology for
                                                                independent control of electrical and thermal conduction. Reliability and lifespan
                                                                performance of thermal interface materials is an important consideration towards the
                                                                determination of appropriate practical applications. The present review addresses
                                                                these issues in detail, demonstrating the promise of the graphene-enhanced thermal
                                                                interface materials as compared to alternative technologies.

                                                  Keywords: graphene, boron nitride, reliability, thermal management, thermal perco-
                                                  lation, synergistic enhancement, thermal conductivity, electrical conductivity, thermal
                                                  interface material, accelerated aging
Review of Graphene-based Thermal Polymer Nanocomposites                                 2

1. Introduction

The extraordinary increase in transistor density in semiconductor products has
revolutionized our society and introduced new challenges towards its continued progress
[1]. Though the decreasing feature sizes that enables ever-increasing densification has
typically brought with it per-transistor energy efficiency enhancements, this does not
make up for the overall waste heat production resultant from having more switches
in total in the same area [2, 3]. This has led to a general trend for very large
scale integration (VLSI) chips to increase in thermal design power (TDP) at every
generation, with notable deviations from this trend usually coming in the form of
vast architectural improvements or splitting the die into multiple logical cores. The
increase in dissipated heat is problematic for VLSI semiconductor chips because their
functionality can unacceptably alter at high temperatures, due for instance to hot carrier
degradation and bias temperature instability [4–6]. Now that devices are manufactured
in the sub-10-nanometer process, it is becoming more difficult to manage waste heat
production due to ever more important factors like leakage current and Joule heating
in interconnect circuit elements of decreasing cross-sectional area. Each of these serve
to make improved thermal dissipative solutions increasingly essential. In parallel, the
growing fields of LED lighting and solar energy along with continuation of aerospace
products all require similar and improved heat dissipation solutions [7–14].
     The scale of the waste heat problem in semiconductors is often lost in the numbers
even among researchers. The average power density of some modern silicon VLSI chips
can reach as high as 1/100 of the power density at the top of the sun’s photosphere,
which is approximately 6,300 W/cm2 . However, when one takes a more detailed look at
a modern VLSI chip they will find local spots in which the heat density is substantially
higher than the average [15]. VLSI chips operate at such reasonable temperatures
despite their staggering heat production solely because of their accompanying engineered
thermal dissipation solutions.
     The most common technique to remove heat from VLSI chips and other
semiconductor circuits is to bring metals – termed heat sinks – in contact with the chip
so the heat may diffuse into this additional component. Then the heat sink would be
cooled down by the environment with a presumably infinite thermal reservoir capacity.
Often the heat sink employs heat pipes – sealed tubes with an often phase-changing fluid
inside of it – that add convection and heat of vaporization at each end as mechanisms of
heat transfer along with the conduction of the metallic pipe material [16, 17]. The heat
sink class of thermal dissipation solutions are cheap, reliable, small, and ubiquitous.
     All thermal dissipation solutions in which a solid heat-producing device is placed
in contact with a solid heat sink suffer from a physical junction thermal interface
resistance. Between any two solid, non-compliant materials the total percentage of
surface area making contact can be quite low, with a strong dependence on factors
such as microscopic scale surface roughness, material plasticity, and mounting pressure
[18–20]. A low proportion of direct surface contact at a physical junction inevitably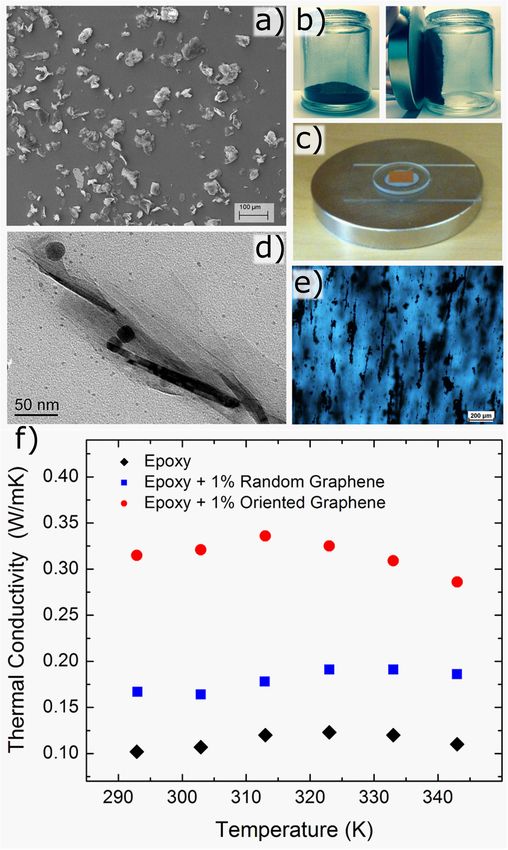
Review of Graphene-based Thermal Polymer Nanocomposites                                 3

means that gaps are filled with air, which has very poor heat transfer characteristics
relative to the metals on each side of the junction. The heat flow from source to drain is
analogous to and often thought of as an electrical circuit, in which the metal components
of the dissipative solution are low resistance wires with the junction thought of as a
resistor. The thermal resistance of between two physical junctions is often termed as
contact resistance, RC . In a junction with a TIM the resistance is then:
                        BLT
              RT IM =         + RC1 + RC2                                              (1)
                         K
     where BLT is the bondline thickness, K is the thermal conductivity (TC) of the
TIM itself, and RC1 and RC2 are the contact resistances of each junction surface with
the TIM [21–23]. For an appropriate TIM, RT IM < RC . It is clear from Equation 1
that for increasing BLT the TC becomes an ever more important factor in RT IM .
     The resistance of the junction is typically reduced with the use of an interstitial
material called a thermal interface material (TIM) to take the place of air [24]. The
thermal resistance of the junction can be substantially reduced in this manner but thus
far has not been comparable to the ideal of uninterrupted copper with no junction.
Figure (1a) shows a schematic highlighting the benefit of TIMs in an exaggeratedly
imperfect junction in which a greater portion of the junction’s surface area is used for
heat dissipation with TIMs applied versus without.
     Metal TIMs to date have achieved the lowest thermal interface resistance. There
can be variations in precisely the functionality of this class of TIM, but they typically
are introduced to the junction as a hot liquid and are frozen to a solid between the
two surfaces. However, they can exist in either a permanently liquid state or alter
between the two. Metal TIMs can achieve a TC over 86 W/mK – that of Indium
– and an interfacial resistance of 0.005 Kcm2 /W [25–28]. The thermal transport in
metallic TIMs is predominantly contributed to by their substantial population of free
electrons, as in all metals, carrying heat mostly freely within the material’s spatial
confines. Though these TIMs remain at the time of this article as the best-performing
at application, they are marred with reliability problems and are more expensive than
alternatives. Due to the reliability concerns of metallic TIMs, it is a very active area
of research for the materials [25, 29–34]. The reason for this poor lifespan performance
of metal TIMs is that they freeze into a solid that has a different coefficient of thermal
expansion (CTE) with the materials on either side of it. As the temperatures of the
junction are inevitably varied a disadvantageous thermal stress is inadvertently applied
to the TIM and eventually cracks it, leading to substantially reduced performance.
That same thermal expansion mechanic can result in pushing fluid TIMs out of the
junction in a process called “pumping out.” This can be very problematic in the more
modern, permanently fluid metal TIMs because there is a risk of spilling onto electrical
components susceptible to electrical shorting failures. Another common class of TIMs
are the elastomeric thermal pads. These TIMs are a very spongy and flexible solid
pad that pushes itself into gaps in the junction due to its resistance to mechanical
deformation. The highest TC achieved in this class of TIM in industry known by the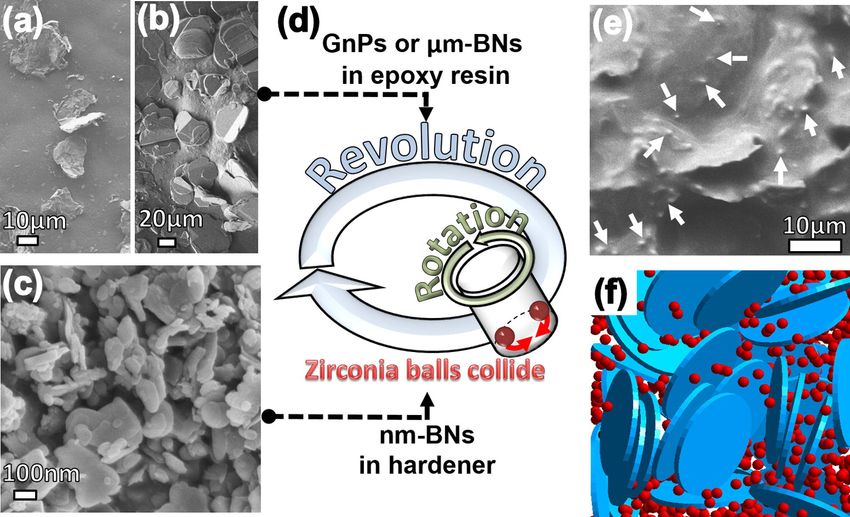
Review of Graphene-based Thermal Polymer Nanocomposites                                               4

a)                                                  b)

c)                                                  d)

              Figure 1. a) Top: a primarily air-gapped exaggerated physical interface in which
              noteworthy heat dissipation only occurs at a small point of contact. Bottom: The same
              junction after a TIM has been applied allowing substantially more heat dissipation
              over the otherwise air-gapped regions. b) Uses for different types of TIMs. c) Material
              properties of a selection of popular filler materials. d) Typical composite properties for
              different TIMs with un-oriented fillers. Panel b adapted with permission from ref [35].
              Published under CC License by UC Riverside.

authors is 62.5 W/mK. Though the TC of these are impressive, they suffer from large
contact resistances that ultimately leads to a modest overall thermal resistance.
     Similarly, a solid polymer or clay material can be used in the direct encapsulation
of less complex semiconductor circuits than modern VLSI chips for protection from
environmental contaminants. Though chips encapsulated in this manner will have less
heat-producing circuit elements than in VLSI chips, devices of this class can include high-
power GaN amplifiers with substantial lifespan sensitivity to operating temperature [36].
The thermal performance of the encapsulation material is an important parameter,
analogous to a classic TIM. Because of this, chip encapsulation materials are considered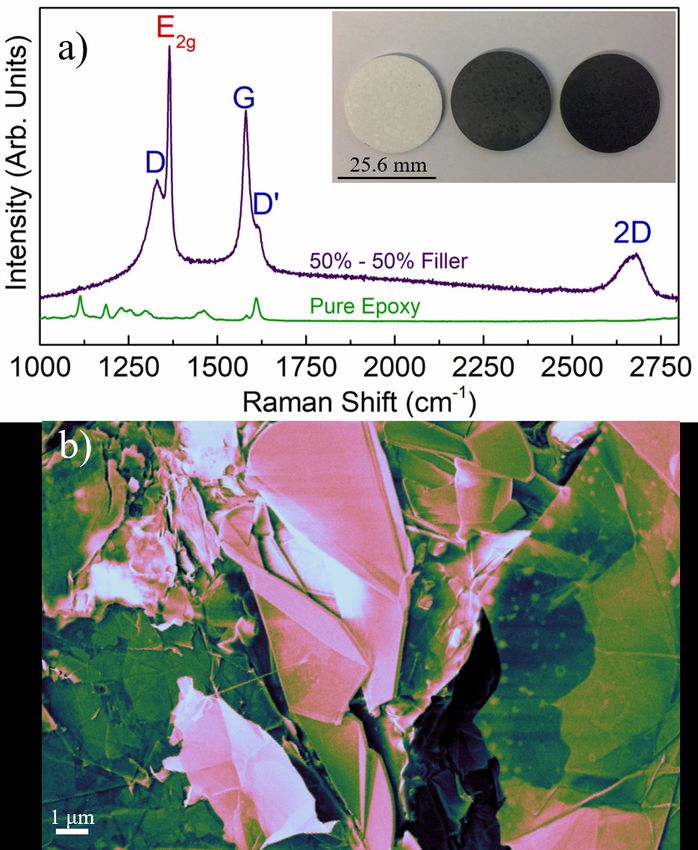
Review of Graphene-based Thermal Polymer Nanocomposites                                    5

a type of TIM. Encapsulation TIMs are typically even more sensitive to electrical
conductivity (EC) due to their direct contact with active circuit elements [37]. Figure
(1b) shows different types of TIMs and the applications in which they are typically used.
     TIM materials are often composed of metal solders, mechanically compliant pads,
and polymers typically composited with filler materials [38]. Each type of TIM has
its own strengths and weaknesses. By far the most common class of TIM is that of
the polymeric type. These TIMs have a polymer matrix in which a highly thermally
conductive filler is almost always added to form a composite. This class of TIMs have a
higher thermal resistance than metal-based TIMs but benefit from being stable at higher
temperatures and substantially simpler to work with, especially when re-application is
necessary. To date, these TIMs tend to have a lower TC than thermal pads, with a bulk
TC in industry between 0.5 W/mK and 7.0 W/mK at high filler concentration, but
have much less contact resistances, leading to overall slightly better performance [39].
It should be noted that the BLT and contact resistances are influenced by the TIM’s
rheological properties, particularly viscosity, and often increasing the filler loading, thus
K, of the composite comes at the sacrifice of larger BLT, RC1 , and RC2 .
     Polymeric TIMs have seen considerable research into potential materials that could
be used as conductive fillers. Some common polymers used are mineral and silicone oil,
epoxy, poly(methyl methacrylate) (PMMA), and polyethylene [40–42]. Performance of
base polymers can vary widely by preparation. For instance, varying the stoichiometric
ratio of diglycidyl ether of bisphenol-A (DGEBA) – a common type of epoxy used in this
field of research – can result in a factor of two alteration in its thermal diffusivity [43].
One constant requirement of all filler materials is that their physical dimensions must
be small enough that a consistent mixture may be formed within the TIM. Filler
materials either in industrial or research use include silver, copper, Al2 O3 , AlN, boron
nitride, ZnO, diamond, graphite, carbon nanotubes, few-layer graphene (FLG), and
many others [44–56]. A selection of works into these filler materials is summarized in
Table 1 at the end of this article. Figure (1c) shows the bulk material properties for a
selection of potential filler materials. For each specific geometry of filler, there exists a
maximum practical filler loading that can be achieved often called the workability limit
due to an unacceptable increase in composite viscosity [57, 58]. High TIM viscosity can
complicate preparation and result in ever-increasing contact resistance in a junction.
The resulting composite thermal and electrical properties that is typical for composites
with randomly oriented fillers of a particular species is shown in Figure (1d).
     Research into graphene-filled polymeric TIMs have flourished after the discovery
of graphene’s extraordinary thermal conductivity ranging from 2000 to 5300 W/mK
[59–67]. Early studies showed graphene-filled TIMs with thermal conductivities as
high as 5 W/mK at room temperature (RT) with graphene filler loading fractions of
around 10 vol. %, further spurring graphene TIM research [68, 69]. More recent studies
into randomly-oriented graphene TIMs in a cured epoxy polymer matrix have achieved
thermal conductivities of ≈12 W/mK [70–72]. Counter-intuitively but interestingly,
graphene has been included into aerogel and displayed a sharp and unprecedented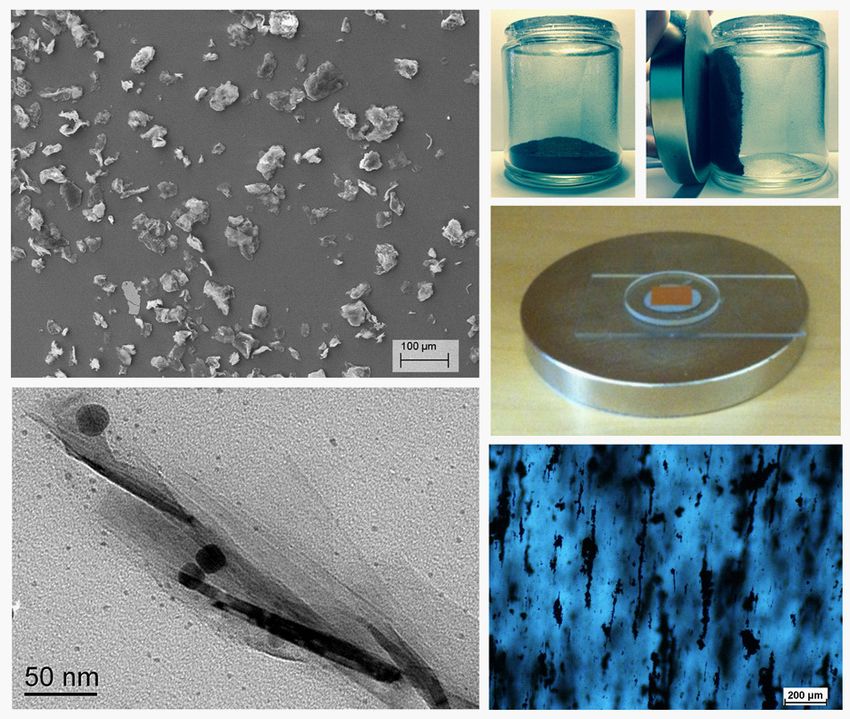
Review of Graphene-based Thermal Polymer Nanocomposites                                      6

reductionin TC to between 4.7 ×10⁻³ and 5.9 ×10⁻³ W/mK at RT, though these results
are far from typical for graphene composites [73]. Graphene has promising potential in
developing the next generation of TIMs. In a closely-related vein of research, graphene
has been composited with thermosetting plastics with the intention to increase the
polymer’s fracture resistance, often with little consideration for the composite thermal
properties [74].
      From a practical standpoint, graphene has the potential to be a cheap filler material
due to its composition of abundant carbon, given maturity in synthesis techniques.
Liquid-phase exfoliation has stood out as a promising graphene synthesis method with
the potential for future economic scaling [75–78]. This technique employs a high energy
sonicator to vibrate the layers of a thick stack of graphite bound by weak van der
Waals forces suspended in a fluid apart into few-layer graphene. Another interesting
and scalable technique is electrochemical exfoliation in which bulk graphite is used as
an electrode and solute ions intercalate into the graphite. This intercalation results in
inter-layer stretching that either leads directly to exfoliation or leads to easier exfoliation
when a sonication is applied [79]. This technique also affords the ability for easy
functionalization of the resulting graphene flakes. It is also very common and economical
to oxidize graphite into graphite oxide via Hummers’ Method, liquid-phase exfoliate
the much simpler oxide, then finally reduce the resulting graphene oxide to a form of
pure graphene [80–85]. However, these processes have drawbacks primarily resulting in
defects degrading advantageous properties of the graphene, with substantial defects in
graphene derived from the reduction of graphene oxide [86–92].
      In TIM research, the term “graphene” refers to a mix of single-layer graphene
(SLG) and FLG up to a few nanometers in thickness [93]. Graphene’s in-plane
thermal conductivity is reduced with increasing layers up until ≈8 total monolayers,
at which point the TC stabilizes to that of high-quality graphite at ≈2000 W/mK but
still remains more mechanically flexible [94–96]. However, the thermal conductivity
reduction resultant from contact between graphene and a dissimilar material is far more
dramatic. Though there is a reduction of intrinsic TC for increasing graphene layers,
there is a competing mechanism to consider where in FLG the outer layers of graphene
can insulate interior layers from the substantial TC degradation from phonon scattering
resultant from contact to other materials, in this case polymer matrix [97–103]. The
two-dimensional geometry of the graphene is an important factor leading to composites
composed of graphene having typically much better TC enhancement relative to the
one-dimensional carbon nanotube. However, it is important that the graphene exist in
the composite with little bending lest it suffer a substantial reduction in performance
[104, 105].
      Many applications require TIMs with electrically insulating properties. Polymer
TIMs can vary widely in their EC depending primarily on the type, concentration, and
morphology of the filler used. An electrically conductive filler material can be used to
fill a polymer TIM for such an application up to a certain level – termed the electrical
percolation threshold – where the overall EC of the composite raises orders of magnitude,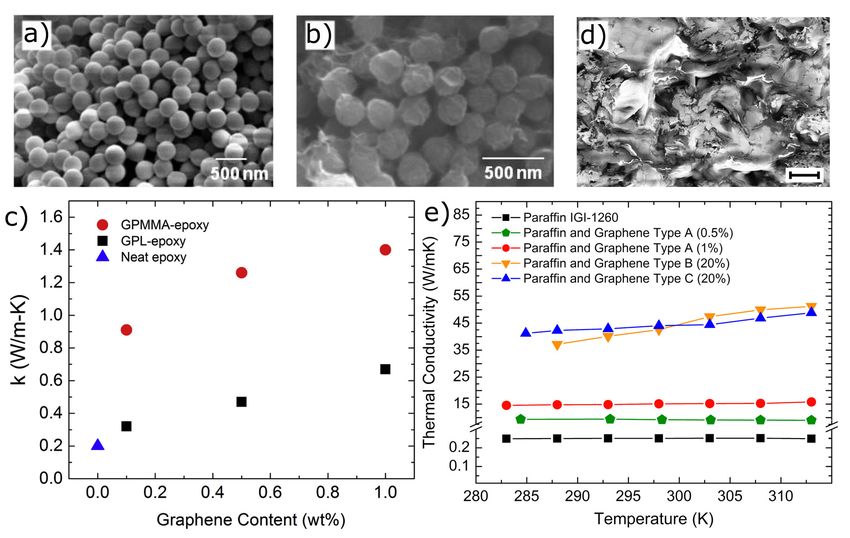
Review of Graphene-based Thermal Polymer Nanocomposites                                           7

as seen in Figure (2a) [106–110].

               a)

               b)
                 Hot                                                      Cold

              Figure 2. a) EC of a composite above and below the electrical percolation threshold
              with electrically conductive graphene fillers. b) Left: A TIM between a hot and cold
              surface with low filler loading with natural size variations. Right: The same scenario
              with more fillers and the development of a low-resistance percolation pathway. Panel
              a adapted with permission from ref [111]. Copyright 2019 John Wiley & Sons.

      Of considerable importance to TIMs, electrical percolation threshold has analogous
behavior in TC known suitably as thermal percolation threshold. The percolations of
these two material parameters are governed by the concentration and morphology of
filler material required for large-scale, uninterrupted paths to become opened up from
one filler particle to the next. At this point, a low resistance pathway, be it thermal or
electrical, from one end of the TIM to the other becomes available and each respective
property enhances substantially. Figure 2 shows two idealized hot and cold surfaces
with a filler material between them. In the left schematic, the concentration of spherical
fillers is low enough that most fillers are isolated from one another. In the schematic
on the right the concentration is high enough that fillers make contact, making long-
Review of Graphene-based Thermal Polymer Nanocomposites                                    8

range contact with one another allowing for a low-resistance pathway between the two
surfaces. A common trend in research is to add a filler material with poor EC to allow
the use of superior thermally conductive but also electrically conductive filler without
an unacceptable increase in overall TIM EC [112].
      This paper covers recent advances in the promising graphene and graphene/boron
nitride hybrid filled TIMs. A greater depth discussion of the thermal percolation
threshold and role that adding different types of fillers – often known as hybrid, binary,
tertiary, etc. filling – can have on it. Also considered is the all-too-often overlooked
lifespan performance of these TIMs.

2. Recent advances of graphene TIMs

Some of the most thermally conductive polymeric TIMs have employed the quasi-
2D graphene as filler material, occasionally including a second filler as an additional
component. Normally, filler materials are in general randomly-oriented by a classic
mixing procedure. This random orientation of fillers is less efficient than if directionally-
selective processes were employed considering that the latter scenario serves to effectively
increase the size of the flake and thus unobstructed pathway along a desired direction in
dimensionally constrained fillers. Studies concerned with selectively aligning graphene
fillers have proven to be useful in increasing TC improvement per graphene loading level
efficiency [113].
      The first work on TIMs with graphene-like materials used as a filler known to the
authors was conducted in 2006 [81,114,115]. This work started with typical, macroscopic
graphite that was oxidized and then exfoliated. The thickness of the obtained filler
material was ≈10 nm with lateral dimensions of ≈15µm, a geometric portfolio typically
referred to as “few-layer graphene” today.
      Tremendous interest in graphene as a filler of TIMs followed an early demonstration
of a TC enhancement of 2300 % at only 10 vol. %filler loading in an epoxy matrix [68],
shown in Figure (3). These results have since been confirmed by independent studies
[69, 71]. Also studied was an unprecedented enhancement of a commercial TIM from
≈5.8 W/mK to 14 W/mK with a small addition of 2 vol. %of graphene. The Maxwell-
Garnett effective medium approximation that is known to be effective for lower loading
fractions was used to analyze the data [116, 117]. By treating graphene and carbon
nanotubes as dramatically oblate and prolate spheroids, respectively, superior TC of
graphene composites is effectively modeled. Following is the derived expression for a
graphene-filled composite’s TC
                       "                                 #
                         3Km + 2f (Kp − Km )
              K = Kp                                                                     (2)
                     (3 − f )Kp + Km f + RB KmK
                                             H
                                               pf

    where RB is the microscopic interfacial resistance between graphene and matrix,
Kp is the TC of the flakes, Km is the TC of the matrix, f is the loading fraction, and
H is the thickness of the flakes.
Review of Graphene-based Thermal Polymer Nanocomposites                                      9

                                     a)               b)

              Figure 3. a) Enhancement of pure epoxy with increasing load level up to 10 vol.%.
              “Graphene-MLG-Hybrid Epoxy A” corresponds to a composite that was mixed for
              ≈12 h at 15,000 RPMs and “Graphene-MLG-Hybrid Epoxy B” corresponds to a less
              mixed composite that went through ≈10 h of 5,000 RPMs of mixing. b) Temperature-
              dependent TC for graphene and few-layer graphene TIMs at different load levels.
              Adapted with permission from ref [68]. Copyright 2012 American Chemical Society.

      In all TIMs one must consider the microscopic interfacial (Kapitza) resistance
of fillers within the material, a situation quite analogous to the macroscopic contact
resistance that the TIM is employed to ameliorate.             There is an unfortunate
mismatch of phonon vibrational frequencies between graphene and polymer matrix that
functionalization can address [118, 119]. Research has been conducted to decrease the
microscopic filler interfacial resistance in graphene TIMs through a functionalization
process of the fillers [120, 121]. Using this technique, a TC of 1.53 W/mK in an epoxy
resin polymer was achieved with 10 wt. %of functionalized graphene [122]. It was
shown in molecular dynamics simulations, effective medium theory, and others that the
reduction of microscopic filler interfacial resistance resulted in an increase of overall
composite TC [123–127]. Figure (4a) and (4b) show schematics of a linear hydrocarbon
chain grafted to a graphene sheet to produce a functionalized surface. In Figure (4c)
the thermal conductivity, K ∗ , of a simulated composite is analyzed at varied graphene
lateral dimensions with different hydrocarbon areal densities, σ, on the graphene flakes.
Interestingly, the functionalized graphene composites achieved higher TC until a filler
length of ≈5 µm, at which point the non-functionalized graphene composite began
to perform better. Alternatively, graphene functionalization can be useful to prevent
agglomerations and to attach components that can be used to orient the graphene
flake [128].
      Using typically very defected graphene derived from the reduction of graphene
oxide, an improvement of 0.196 W/mK to 0.416 W/mK was seen in a polyamide with a
graphene loading of 10 wt. % [129]. In this study, a surface functionalization process was
conducted that helped to increase the thermal coupling between the reduced graphene
oxide and the polymer matrix. Using a similar reduced graphene oxide at only 1.5 wt.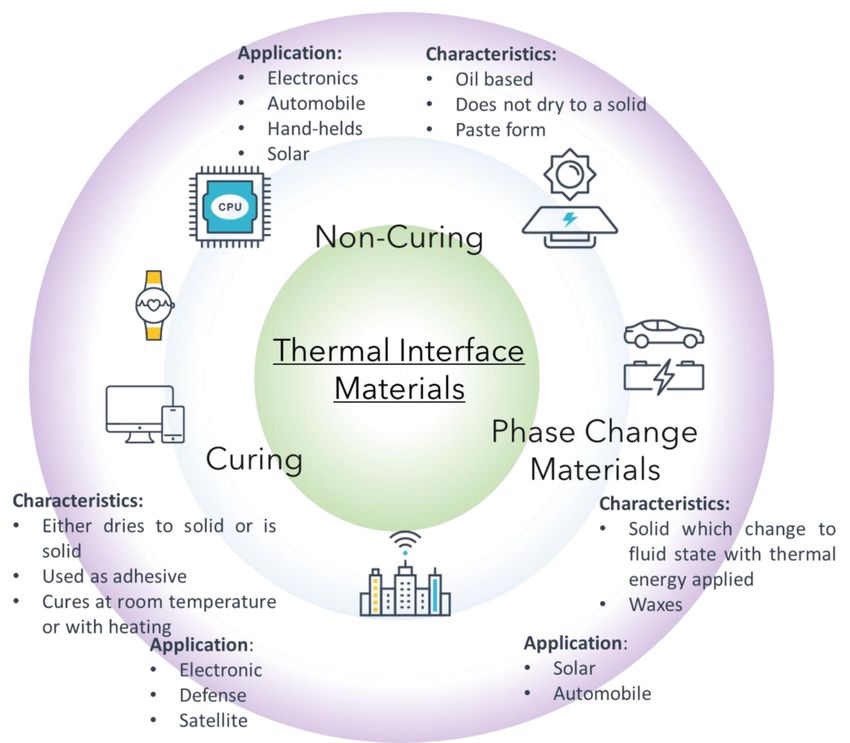
Review of Graphene-based Thermal Polymer Nanocomposites                                         10

 a)                                    c)

 b)

              Figure 4. a) Section of a graphene flake with 2 linear hydrocarbon chains grafted on.
              b) 6 linear hydrocarbons grafted to graphene. c) Non-equilibrium molecular dynamics
              simulation composite TC with different areal densities of grafted hydrocarbons (σ)
              per square Angstrom. Increasing density of hydrocarbon attachments results in better
              performance until the length of graphene approaches approximately 5 microns, at which
              point the intrinsic graphene TC reduction becomes a more dominant mechanism in the
              composite. Adapted with permission from ref [123]. Published under the CC license
              by Taylor & Francis.

%and an additional functionalization step, a silicone matrix composite achieved a TC
of 2.7 W/mK [10]. This TIM was then applied to bridge an LED chip and a heat sink
with a smaller temperature difference between the two when the TIM TC increases. In
a very similar study, a graphene derived from graphene oxide and polyamide composite
achieved 5.1 W/mK with functionalization and 3.34 W/mK without functionalization
at 5 wt. % [9]. Functionalization has been applied to graphene composites using gallic
acid to attach a monomer and help with the dispersion of graphene in DGEBA [130].
In a similar research strategy, functionalization has been used to attach silver particles
to graphene to also prevent graphene from agglomerating in the composite [131]. The
contribution of the functionalization process to TC enhancement can be seen most
starkly when comparing the prior results to one in which an epoxy polymer was filled
with 2 wt. %non-functionalized reduced graphene oxide and achieved a very modest
enhancement from 0.18 W/mK to 0.24 W/mK [132].
     Researchers have used graphene functionalization to attach magnetic particles, such
as Fe3 O4 , to the sheets. Then, once the functionalized graphene is dispersed within
the polymer a magnetic field is applied. Because the graphene sheets are attached
to them, they are aligned along the magnetic field, leading to the ability to increase
the thermal transport along a particular direction. In a study with an epoxy polymer
matrix, the addition of 1 vol. %randomly oriented graphene raised the TC of the
composite from 0.17 W/mK to 0.41 W/mK [133]. However, when the graphene was
functionalized with Fe3 O4 and magnetically aligned the composite achieved a rough
TC of 0.57 W/mK when aligned parallel to the direction of thermal characterization
Review of Graphene-based Thermal Polymer Nanocomposites 11
and 0.25 W/mK when perpendicular. These results were verified later and shown in
Figure (5f) that orienting graphene in this manner is more efficient at enhancing the
TC than when using a random orientation approach [128]. Alternatively, alignment of
graphene has been achieved by a clever use of interfaces between two different polymer
materials to preferentially trap graphene sheets at the interface [134]. This serves to
both locally increase the loading level and allow for directional orientation along the
interface. Another intentional filler orientation work reported a TC of 2.13 W/mK, an
enhancement of 1231%, with only 0.92 vol. %of graphene [135]. Recently, graphene
alignment by way of a freeze-casting method that uses ice crystals to preferentially
orient the flakes has grown in popularity [136–140]. An interesting technique to realize
semi-controllable graphene orientation is to fix graphene to a 3-D structure, with a
morphology similar to sponges, then cure the graphene with or without the scaffold in
a polymer of choice [141, 142].
The directional control of graphene fillers is primarily of interest because its
potential to achieve order-of-magnitude improvement over current composites in the
cross-plane direction (from source to sink). Selective alignment along the plane of a TIM
remains an area of important inquiry but has less immediately practical implications
as these composites are not well-suited for passing heat along a thin interface [143].
General TIM composite techniques tend to naturally result in greater in-plane TC
than in the cross-plane direction, as can be seen in most studies that measure in both
directions [144, 145]. In very thin composites of hundreds of µm in thickness, often
referred to as “paper TIMs”, the in-plane TC can be greater than in the cross-plane
direction by orders of magnitude due to the in-plane orientation of fillers [143,146–154].
A study in 2014 analyzed the thermal performance increase resultant from filling
DGEBA with graphene [155]. In this work a modest enhancement of TC was observed
relative to what others would find with a similar loading fraction of 10 wt. %graphene
fillers of 0.67 W/mK, compared to 0.18 W/mK measured of the pure epoxy. Similar
results were obtained previously with a thermal conductivity of 0.65 W/mK with a
similar filler, loading level, and polymer matrix [156]. In each of these instances, the
lateral dimensions were relatively small, as small as 3 µm, requiring thermal dissipation
to often traverse through the highly-insulating matrix. Additionally, graphene intrinsic
TC diminishes with reducing lateral size even if larger than the grey phonon mean free
path of ≈750 nm [60, 157]. Since functionalization can aid in the thermal coupling
between graphene and matrix, if small flakes are used the benefit of functionalization
is more pronounced. Study has been done that directly examined the benefit of
functionalization versus graphene size [158]. It was determined that functionalization
can inhibit composite TC by harming large graphene flake intrinsic TC, establishing a
critical flake size at which point any larger flakes would result in composites harmed by
the process.
Epoxy polymer TIMs have been crafted and cured directly into an ASTM D5470-
inspired copper interface for testing [159]. An interfacial resistance of 3.2 and 4.3
mm2 K/W for 5 and 10 vol. %, respectively, was measured at 330 K. The TC of eachReview of Graphene-based Thermal Polymer Nanocomposites 12
Figure 5. a) SEM image of graphene derived by liquid-phase exfoliation. b)
Photograph showing the response to the magnetically-functionalized graphene powder
to an applied magnetic field. c) Functionalized graphene between two copper foils and
placed on a permanent magnet for filler alignment. d) TEM micrograph of graphene
flake with attached Fe3 O4 . e) Optical microscopy image with low concentration
of aligned filler. f) Apparent thermal conductivity at different temperatures. The
superiority of intentionally oriented graphene flakes to randomly orientated graphene
and pure epoxy is evident. Adapted with permission from [128]. Copyright 2015
Elsevier.Review of Graphene-based Thermal Polymer Nanocomposites 13
sample was measured to be 2.8 and 3.9 W/mK. These results highlight the need to
consider the potential increases in RC1 and RC2 that an increasing viscosity resultant
from an increase in filler level could cause. This outcome of the superior thermally
conductive composite having a greater interfacial resistance was observed elsewhere in
a polyolefin polymer matrix and was attributed to its mechanical properties [160].
Using graphene derived from Chemical Vapor Deposition (CVD) and subsequently
exfoliated, a method that produces graphene of greater quality than that from the
reduction of graphene oxide, a TC of 4.9 W/mK was achieved with a 30 wt. %loading
in an epoxy resin [161]. Additionally examined in this study was the TC at different
temperatures. There is a reduction of performance at higher temperature as one would
expect, but the extent of the reduction proved to be modest, showing positive signs
for thermal stability. In a similar work, an epoxy composite with 8 wt. %of graphene
achieved a 627% improvement in TC, resulting in 1.18 W/mK [162]. The performance of
composites based on these constituent materials can vary substantially from researcher
to researcher, displaying the great many influencing parameters that determine their
properties. At a similar graphene loading of 8 wt. %, another study reported a TC
of ≈0.5 W/mK in an epoxy composite [163]. These factors that can alter composite
performance can range from being intentional and knowable to being difficult to identify.
Generally, graphene without defects is desirable because its TC reduces with
increased defect density. However, in a non-equilibrium molecular dynamics simulation,
a mechanism for increased TC in a liquid n-octane and graphene composite was
established with increasing vacancy defects [164]. Upon introducing vacancy defects
to graphene at concentrations up to 8%, the thermal conductance of the composites
is increased because the graphene fillers become more structurally flexible, with a
corresponding decrease in its in-plane and out-of-plane phonon frequency. This
reduction in out-of-plane vibrational frequency aids in the thermal coupling of the
graphene and polymer. This highlights the need to take holistic considerations when
designing a composite as opposed to what is traditionally good for an individual
component of the composite. Viewing this and other works suggest that defect-based
enhancements depend on the type of defect and polymer type [165].
An interesting and relatively recent strategy has been to attach graphene to
another larger material to achieve a desired larger-scale placement and orientation. This
technique was used to make PMMA balls coated with graphene that were then used to
fill an epoxy [166]. SEM micrographs of varying graphene loadings and magnifications
are in Figure (6a-b). Using this technique, the researchers achieved ≈ 1.4 W/mK at
1 wt. %, versus only ≈ 0.6 W/mK of equivalent loading graphene without PMMA
grafting, shown in Figure (6c). A similar idea was applied to attach reduced graphene
oxide to thermoplastic polyurethane balls and then hot-press mold the balls together,
achieving a TC of 0.8 W/mK at 1.04 wt. % [168].
Graphene fillers have been applied to phase change materials, often used in TIMs
and thermal energy storage [169]. An aerogel material’s TC has been increased from
0.18 W/mK to 2.64 W/mK with the inclusion of approximately 20 vol. %of grapheneReview of Graphene-based Thermal Polymer Nanocomposites 14
c)
Figure 6. In this study, graphene was grafted onto PMMA spheres to provide
structure to the graphene. a) SEM image of pure PMMA spheres. b) PMMA
spheres with 16wt.% graphene c) TC results of graphene attached to PMMA spheres
(GPMMA) as red dots and graphene without PMMA attachment (GPL) as black
squares. d) SEM micrograph of graphene and phase-change material. e) TC
performance of graphene-enhanced Paraffin over realistic battery temperatures. Panels
adapted with permission from: a, b, c, ref [166] and d, e, ref [167], copyrights 2015
and 2016 Elsevier.
oxide [170]. The phase-changing polymer icosane’s TC was enhanced by a factor of
400% to ≈2.1 W/mK through the inclusion of 10 wt. %of graphene [171]. These
results will allow for better temperature uniformity within each phase-changing polymer
due to the enhanced heat flow characteristics with important implications in the ever-
more-important lithium battery field [167]. Figure (6d) an SEM micrograph of a
prepared graphene and paraffin composite is shown. In Figure (6e), TC of different
graphene-enhanced composites for realistic battery temperatures are presented with
>45 W/mK performance at slightly above RT. In a lauric acid phase change material a
TC enhancement of 230 % was seen with as little as 1 vol. % [172].
3. Percolation
As mentioned previously and illustrated in Figure (2), when a composite is loaded past
a critical level there can be precipitous increase in conductive ability, whether it be
electrical or thermal. This is the case because as the concentration of conductive filler
particle increases eventually full pathways from filler to filler forms to allow large-scaleReview of Graphene-based Thermal Polymer Nanocomposites 15
low resistance network through the composite. Electrical percolation of composites
employing electrically conductive fillers such as metals or carbon allotropes is very
strongly supported by research [81, 173–177]. The EC of composites are well described
by a power law, σ ≈ (f − fE )t , where σ is the EC, f is the filler volume fraction, fE is
the percolation threshold loading level, and t is the critical exponent.
The exact nature and efficacy of thermal percolation in composites was up until
recently not considered a settled issue in science [66,178–185]. It is clear that the change
of composite thermal properties resultant from percolation is more modest than that of
EC, which can span over ten orders of magnitude, strongly depending on the matrix and
fillers used [186]. The less of obvious observable signs of thermal percolation relative
to electrical percolation is often attributed to the simple fact that the span of available
materials’ TC is far more constrained than in the case of EC. The dynamic range of TC
– a total ratio of Kf /Km ≈ 105 – in materials that one could use in practical applications
is much lower than that of EC – a total ratio of σf /σm ≈ 1015 , resulting in effectively no
polymer electrical conduction while still providing some thermal conduction [70, 180].
Since the ratio of Kf /Km is often ten orders of magnitude less than σf /σm , the TC
enhancement at the percolation threshold is less precipitous as EC enhancement at its
respective percolation threshold.
More recent works have more conclusively shown the onset of a thermal percolation
in graphene and h-BN composites [70,185]. Figure (7a) and (7b) shows TC performance
of graphene and h-BN showing superlinear TC enhancement after a certain filler loading
fraction – the percolation threshold [178, 182–185, 187–189]. The thermal percolations
were observed at about 30 vol. %in the graphene composites and 23 vol. %in the h-
BN composites. The enhancement of TC as the loading fraction is increased was fit
to Maxwell-Garnett, Agari, and finally with fantastic agreement, the semi-empirical
Lewis-Nielsen model [190–194]. This specific behavior is somewhat different to a
previous study into graphene composite percolation in which pre-percolation behavior
was found to match Nans’ model and post-percolation matched the adjusted critical
power law [185, 195]. The Lewis-Nielsen TC model is
K 1 + ABf
= (3)
Km 1 − BΨf
where A is equal to kE − 1 where kE is the generalized Einstein coefficient,
B = (Kf /Km − 1)/(Kf /Km + A), and Ψ = 1 + ((1 − φm )/φ2m )f where φm is the
maximum packing fraction [196]. The values of parameters A and φm are unknown for
quasi-2D fillers like graphene and h-BN and were treated as fitting parameters.
It was found that loading beyond the thermal percolation threshold placed
considerable importance on the cross-plane TC of the graphene fillers because thermal
transport in this direction facilitated the passing on of heat from one flake to the next
in the percolation network. The graphene composites exhibited consistently higher
TC than their h-BN counterparts. This fact is due to the superiority of graphene
intrinsic TC relative to that of fh-BN, at a still impressive experimentally-determinedReview of Graphene-based Thermal Polymer Nanocomposites 16
a) b)
c) d)
Figure 7. Thermal conductivity versus volume fraction with linear and Lewis-Nielsen
trend lines for comparison. a) graphene composites. b) h-BN composites. The superior
TC of graphene composites h-BN composites is attributed to the superior intrinsic TC
of graphene. c) Thermal flux versus distance between flakes shown in schematic. Each
line corresponds to a simulation result with a different cross-plane TC, varying from
0.2 to 200 W/mK. d) Same plot for varying flake lateral dimensions. Adapted with
permission from ref [70]. Copyrights 2018 American Chemical Society.
TC of ≈230 W/mK to ≈480 W/mK at RT and up to ≈1000 W/mK when determined
theoretically [197–203].
Using the Lewis-Nielsen model, a surprisingly low apparent TC of ≈ 37 W/mK was
determined for the graphene materials used inside of the TIM. This lower-than-expected
TC was attributed to the unexpectedly important impact of filler cross-plane TC to the
overall thermal transport. If the composite is filled past its percolation threshold, much
of its heat will be transporting from one flake to another laying on top of it, forcing
transport in the cross-plane direction. TC in this direction can be 2 orders of magnitude
less than in the in-plane direction. It is also possible that the matrix and filler defects
can induce TC-harming phonon scattering, however the amount of scattering necessary
to alone explain the low apparent TC of graphene seems less likely. The effect of
microscopic contact resistance – Kapitza resistance – is likely a contributor and could
be greatly diminished in future works with functionalization processes [204–206].Review of Graphene-based Thermal Polymer Nanocomposites 17
Figure (7c) shows a comparison of thermal transport for different composite
parameters from a finite element heat diffusion numerical simulation. The subset
schematic in subfigure (7c) shows a quasi-2D filler within an epoxy matrix. This filler
has a heat applied and that heat is transported via diffusion away from the schematic’s
exposed face towards the end of the flake, then the heat traverses primarily vertically
through the epoxy, across a distance d, and into another filler. Plotted in (7c) is the
thermal flux of flakes with high-quality graphite’s in-plane TC of 2,000 W/mK and
various cross-plane TCs with different distances between the adjacent flakes. Evident
from the plot is the considerable importance of the overall thermal flux, amounting
to a factor of ≈5, on the cross-plane thermal conductivity when the fillers are making
contact, such as in the thermal percolative state. In figure (7d) the total thermal flux
versus distance between flakes is considered for varying flake lateral sizes and fixed
thicknesses. The importance of large flakes below the percolation threshold, and thus
large inter-planar distance, is clear and is due to the opening of long, low resistance
pathways and the reduction of reliance on the comparatively low cross-plane TC.
Recently, a new composite TC differential equation model was reported that agrees
well with this work [207]. The model is written as,
" #
dX 1 R1 (1 − Λ) BΛ(R2 − X)X
= + (4)
dφ 1−φ 3 R2 + (B − 1)X
where X is the ratio of the final composite thermal TC to the pure matrix TC, φ is
the filler volume fraction, R1 and R2 are the ratios of the filler effective TCs to that of
the matrix, Λ is the volume fraction of particles that are in tight clusters resultant from
imperfect mixtures, and B characterizes how particles and their clusters deviate from
a spherical shape. This model is aware of thermal boundary resistances, percolative
networks, and imperfect mixture agglomerations.
4. High Loading Non-Curing Graphene Thermal Interface Materials
Cured, solid form TIMs receive a more attention in research possibly because of the ease
of working with them relative to non-curing forms, in addition to their direct comparison
to chip encapsulation materials. However, a more representative comparison between
the TIMs used in VLSI package and heat sink junctions can be made in studies of
non-curing, at least semi-fluid TIMs, despite their relative difficulty to work with. It is
common for non-curing TIMs to be out-performed by curing TIMs, all other things being
held equal including polymer base TC. Current commercial non-curing TIMs currently
have a bulk thermal conductivity range of 0.5 to 7 W/mK and are needed to reach 20
to 25 w/mK to allow for next-generation devices [39, 208].
Research into graphene-enhanced non-curing TIMs was up until recently exclusively
studied using commercial TIMs as the matrix. These matrix materials typically start
at a relatively high viscosity primarily due to having their own filler materials already
incorporated, leaving little headroom in which one may add additional fillers. In spite ofReview of Graphene-based Thermal Polymer Nanocomposites 18
this, addition of small quantities of graphene into these materials has shown impressive
TC improvements [68,209–211]. The presence of the commercial TIMs’ undisclosed filler
materials makes detailed analysis of the observed behavior difficult.
This group worked on a graphene-based non-curing TIM with a simple mineral
oil base matrix for both greater insights into material properties and more room
with respect to viscosity to further load with graphene [212]. The ≈15 µm lateral
dimension graphene were mixed in with the mineral oil in addition to acetone to prevent
agglomeration [213, 214]. After mixing, the acetone was removed from the mixture by
exposure to 70 ◦ C for ≈2 hours in a furnace. It was suspected that the incorporation of
acetone in the mixing process helped preserve the filler quality.
Using the popular ASTM-D5470 steady-state technique, the junction thermal
resistance and TCs of these composites were characterized between two parallel plates.
The thermal resistances of the composites between the two plates at different distances
and composite concentrations are shown in Figure (8a). The inverse of the slope for every
fitted line for each composite corresponds to its TC. The y-intercept of this fitted line
is the sum of RC1 and RC2 in equation 1, which are equivalent to one another given the
top and bottom junctions were identical. The reduction of the slope of the composites’
fitted lines with increasing graphene content indicates the steady increase of bulk TC
for increasing filler loadings. As previously discussed, the increasing importance of TIM
TC in real-world BLTs of 300 µm is clearly presented by these findings.
Using the inverses of slopes from Figure (8a), Figure (8b) shows the derived TCs of
the tested composites. The error bars are convey the from errors in the linear regression.
A sharp increase of TC, from 0.3 W/mK to 1.2 W/mK, is seen after applying a relatively
low loading of 1.9 vol.% indicating an early onset of thermal percolation, followed by
the beginning of saturation behavior at 8.5 vol.%. This behavior is well matched with
a power scaling law, KT IM = A(φ − φth )p , where A is a fitting parameter related
to the effective TC with consideration to boundary resistance, φth is the percolation
threshold, and p is the universal exponent. TC saturation in non-curing TIMs has been
observed previously though is generally absent in works into curing composites [215–217].
The saturation of TC is attributed to an increase of filler interface resistance as the
concentration of graphene increases as a specific interaction between the filler and this
individual polymer matrix [218].
Figure (8c) shows the contact resistance of the tested composites, with increasing
contact resistance for increasing loading fraction. Assuming the bulk TC of the
composite is negligible in comparison to that of the mating faces in the junction, the
contact resistance can be described by the following semi-empirical model:
! !n
ζ G
RC00 1 +C2 = 2RC00 =c (5)
kT IM P
√
where G = G02 + G002 . G0 and G00 are the storage and loss modulus of the TIMs, P is
the applied pressure of atmosphere in this case, ζ is the average roughness of the two
identical surfaces, and c and n are empirical coefficients [215]. Predicting the thermalReview of Graphene-based Thermal Polymer Nanocomposites 19
a) b)
d)
c)
Figure 8. a) Thermal resistance per unit area versus BLT. b) TC as a function of
volume fraction determined from the inverse of the slopes in a. c) Contact resistance
versus volume fraction with behavior dominated by the role of viscosity relating the
two parameters. d) Comparison of graphene TIMs studied with claims of TIM vendors
studied with ASTM-D5470. Adapted with permission from ref [212]. Copyright 2020
John Wiley & Sons, Inc.
contact resistance with any accuracy from successive experiments at constant pressure
is challenging given that the two remaining parameters – kT IM and G – are affected by
graphene loading and oppose one another in the determination of RC00 . This equation
exposes that in TIMs well-described by it there is an optimum filler loading in which
kT IM may be substantially enhanced with little increase in RC00 .
The bulk TC of the present 19.8 vol.% graphene TIM is compared with high end
commercial TIM products in Figure (8d). Industry self-reports TCs higher than 11
w/mK but do not disclose the technique used to arrive at those values. Here we present
all of the TIM TCs measured with the ASTM-D5470 technique compared with the values
reported by the manufacturer’s. The 19.8 vol.% graphene TIM performs better than all
tested commercial TIMs. The closest performing TIM – PK Pro-3 – uses ≈90 wt.% of
Aluminum and Zinc Oxide fillers, over two times the loading level of the graphene TIMReview of Graphene-based Thermal Polymer Nanocomposites 20
Figure 9. a) Temperature of a solar cell over time under 70x natural solar illumination
with different TIMs applied between it and a heat sink. b) The corresponding open-
circuit Voltage of the solar cell resultant from the device temperature. Adapted with
permission from ref [13]. Published under the CC license by MDPI.
compared.
These TIMs have been applied to solar cells to study the reduction of performance
resultant from operating at elevated temperatures [13]. The poorer performance appears
as a decrease in the voltage across the cell’s two terminals. For every increase in
operating temperature in degree Celsius above 40 ◦ C there is an efficiency loss of 0.35%
to 0.5% [219, 220]. Silicon-based solar cells are known to reach temperatures up to 65
◦
C, corresponding to up to a 12.5% decrease in efficiency.
It is common practice in solar cell research to analyze its performance under
simulated sun light and at greater-than-natural illumination to among other reasons,
provide the heat elevate the device in test above RT [221,222]. In this study, a solar cell
was fixed to a heat sink with different TIMs applied between and was illuminated with
70x and 200x natural solar illumination levels, the former being considered at present.
Figure (9a) shows the temperature change of a solar cell over time with different TIMs.
It is evident that when the solar cell had the higher graphene concentration TIMs
the temperature that it reached remained lower, showing a better thermal coupling to
its heat sink. Figure (9b) shows the corresponding open-circuit voltages – a common
photovoltaic metric of efficiency – that displays the increased efficiency gained for
maintaining a lower operating temperature.
5. Hybridization and Control of Electrical Conductivity
Researchers have long noted a beneficial TC performance of composites that employ
multiple types of fillers, a filling strategy known as hybridization or binary, tertiary,
etc. filling [46, 223–233]. This synergistic effect is seen when including multiple filler
materials at a certain constituent ratio can achieve a greater TC enhancement than
with either individual filler at identical overall loading level. This effect arises fromReview of Graphene-based Thermal Polymer Nanocomposites 21
the differing morphology of the two filler materials and how they can aid one another.
Despite the phenomenal intrinsic TC of graphene that one could reasonably expect
to overpower any potential synergistic effect, it has been widely reported in graphene
composites [68, 234–237]. This benefit occurs due to a second filler’s ability to prevent
graphene agglomeration in a composite and its ability to bridge gaps between graphene
flakes that would otherwise force heat transport through the resistive polymer.
Due to the frequent desire for high TC but low electrical conductivity TIMs,
hybridization is a promising way to leverage the extremely high TC graphene fillers
while controlling the resulting composite electrical conductivity that they cause. It was
shown previously that a hybrid composite of very disparate geometries of graphene flakes
and boron nitride nanoparticles could achieve synergy and a suppression of composite
electrical conductivity [71]. In this work the electrically conductive graphene flakes were
effectively isolated from one another by the smaller electrically insulating boron nitride
materials fitting between them, allowing thermal but not electrical conduction. This
can be seen in Figure (10a) and (10b) in a SEM image and a schematic showing smaller,
red boron nitride fitting between blue graphene flakes. The superiority of composites’
TC with a hybridization of filler material along with a reduction in EC can be seen in
Figure (10c).
This research group prepared hybrid composites of graphene and h-BN flakes of
similar geometries to investigate both whether one can achieve a more finely-tuned
control on electrical conductivity and as a contrapositive verification of each filler’s
dissimilar geometries in producing a synergistic effect [186]. Figure (11a) shows
a schematic of the use of hybrid fillers to selectively control composite electrical
conductivity while preserving useful TC. The graphene and h-BN flakes used both had
thicknesses up to 12 nm and lateral dimensions up to 8 µm. It was hypothesized that
if the two materials were of comparable geometries then they would be less effective at
isolating one another than had been observed before.
Figure (11b) shows Raman signatures of a 44 vol. %composite with 50% constituent
fraction of graphene and 50% of h-BN. Characteristic peaks of graphene and its disorder
are present as well as the E2g peak of h-BN [238–241]. The inset image shows selected
high loading samples. Figure (11c) shows a pseudo-colorized fractured surface of
composite with pink, electrically charging h-BN flakes dispersed among green and blue
electrically conducting graphene flakes. This image shows at least in one instance
the isolation that would not have occurred if h-BN flakes were not substituted in for
graphene.
These composites’ thermal diffusivities were measured using the common laser
flash analysis (LFA) technique [242, 243]. Using densities determined from Archimedes’
principle and heat capacity calculated from the rule of mixtures, thermal conductivity is
calculated from the classic relation K = α×ρ×cp , where α is the thermal diffusivity, ρ is
the volumetric mass density, and cp is the specific heat capacity. LFA directly measures
α, but combining LFA with techniques to determine the other material parameters is
an exceedingly popular TC measurement strategy. The heat capacity was calculatedReview of Graphene-based Thermal Polymer Nanocomposites 22
c)
b)
Figure 10. a) Schematic showing mixed graphene flakes and smaller boron nitride
particles. b) SEM image of an epoxy composite with arrows pointing out boron
nitride particles. c) Plot of TC and EC of composites with total filler loading of
17 vol.% composed. “nm-BN” corresponds to composites filled with boron nitride of
200 nanometers in lateral dimensions. “µm-BN” corresponds to composites of boron
nitride of approximately 40 microns. “Hybrid 1” is 15vol.% of µm-BN and 2 vol.% of
nm-BN. “Hybrid 2” is 16vol.% of GnP and 1 vol.% of nm-BN. Note the increase of
TC relative to the composite of pure GnPs, which is certainly a result of synergy, as
well as the sharp reduction of EC. Adapted with permission from ref [185]. Copyright
2015 American Chemical Society.
using 0.807 J/gK for h-BN and 0.72 J/gK for graphite, which only notably deviates
from graphene to the ZA phonon dispersion in graphite whose states can be unfilled
below 100 K [244–248].
Figure (12a) displays the TC of color-coded composites of 11.4 vol.%, 18.1 vol.%,
25.5 vol.%, and 43.6 vol.%. In all instances as the total filler level is increased the
overall TC is enhanced relative to that constituent fraction at a lower total loading.
As the constituent fraction of the composites moves to higher levels of graphene (left
to right on the x axis), the TC is uniformly enhanced. This result shows that a
synergistic enhancement was not observed in these composites. In all tested composites,
the superiority of graphene to that of h-BN remained the dominant factor. This
provides contrapositive verification of the attribution of synergy to dissimilar filler
geometries. The increased data scatter in the 25.5 vol.% is ascribed to that filler loading
percentage’s proximity to the percolation threshold in composites of this matrix and
filler geometry. This would result in some composites stochastically achieving better
percolation networks than others, whereas composites above or below this loading are
either firmly within or outside of a percolative filling regime. The asymmetric error
bar on the 100% graphene sample at 43.6 vol.% is attributed to clear error in theYou can also read