Scanning Fabry-Perot Interferometer of the 6-m SAO RAS Telescope
←
→
Page content transcription
If your browser does not render page correctly, please read the page content below
Astrophysical Bulletin, 2021, vol. 76, No.3, pp. 316 - 339                                                    September 7, 2021
                                               Translated from Astrofizicheskij Byulleten, 2021, vol.76, No.1, p. 381 - 407

                                                   Scanning Fabry–Perot Interferometer of the 6-m SAO RAS
                                                                          Telescope
                                                                                                      A.V. Moiseev

                                                    Special Astrophysical Observatory, Russian Academy of Sciences, Nizhnij Arkhyz, 369167 Russia

                                                    the date of receipt and acceptance should be inserted later

                                                    Abstract. The scanning Fabry–Perot interferometer (FPI) — is the oldest method of optical 3D spectroscopy.
arXiv:2109.01802v1 [astro-ph.IM] 4 Sep 2021

                                                    It is still in use because of the high spectral resolution it provides over a large field of view. The history of the
                                                    application of this method for the study of extended ob jects (nebulae and galaxies) and the technique of data
                                                    reduction and analysis are discussed. The paper focuses on the performing observations with the scanning FPI
                                                    on the 6-m telescope of the Special Astrophysical Observatory of the Russian Academy of Sciences (SAO RAS).
                                                    The instrument is currently used as a part of the SCORPIO-2 multimode focal reducer. The results of studies
                                                    of various galactic and extragalactic objects with the scanning FPI on the 6-m telescope—star-forming regions
                                                    and young stellar objects, spiral, ring, dwarf and interacting galaxies, ionization cones of active galactic nuclei,
                                                    galactic winds, etc. are briefly discussed. Further prospects for research with the scanning FPI of the SAO RAS
                                                    are discussed.

                                                    Key words. techniques: interferometric—techniques: image processing—techniques: imaging spectroscopy—
                                                    instrumentation: interferometers

                                              1. Introduction                                                   velocities can only be measured in separate regions of the
                                                                                                                nebula that satisfy the condition of maximum interference:
                                              Fabry–Perot interferometers (FPI) based on the princi-
                                              ples that were first described by Fabry & Perot (1901)            nλ = 2lµ cos θ,                                             (1)
                                              have been used for more than one hundred years to study
                                              motions of ionized gas in various astrophysical objects.          where l and µ are the gap and refraction index of the
                                              Successful measurements of the distribution of line-of-           medium between the interferometer plates and θ is the
                                              sight velocities in the Orion nebula were performed using         beam incidence angle converted into the radius of the
                                              an interferometer made of two parallel mirrors shorty be-         interference ring. The idea of a scanning interferometer
                                              fore World War I (Buisson et al., 1914). After a short pause      consists in varying the right-hand part of formula (1).
                                              this technique of the study of gaseous nebulae was revived        Although the possibility of mechanically moving the plates
                                              in Marseille Observatory (Courtès, 1960); it became in-          in a FPI was implemented as early as in the 1920s, obser-
                                              creasingly popular and improved progressively. In Soviet          vations were first performed using more reliable schemes
                                              astronomy such observations were introduced mainly by             that involved tilting the interferometer with respect to the
                                              P. V. Schcheglov (Sheglov, 1963). The FPIs developed by           line of sight or varying the pressure and hence the µ value
                                              Shcheglov were used to perform extensive studies of the           of the medium where the etalon is placed. For a detailed
                                              kinematics of supernova remnants and other emission neb-          description of the history of the development of various
                                              ulae on the 48- and 125-cm telescopes of the Crimea sta-          technical solutions, which ended in the use of piezoelec-
                                              tion of Sternberg Astronomical Institute of Moscow State          tric scanning systems allowing controlled variation of l see
                                              University (Lozinskaya, 1969, 1973).                              Atherton (1995).
                                                  The result of observations with a FPI with a fixed dis-           In 1969 observations of the motions of ionized gas
                                              tance between the plates (the “Fabry–Perot etalon”) is an         in the Hα line in the M 51 galaxy were made on the
                                              image —an interferogram where spatial and spectral in-            2.1-m telescope of Kitt Peak Observatory using a FPI
                                              formation is mixed, so that each point (x, y) in the image        scanned by varying pressure. Photographic plates scanned
                                              plane corresponds to a wavelength λ varying with distance         on a microdensitometer after exposure were used as de-
                                              from the optical axis (Fig. 1). In such a frame the Doppler       tectors. This technique made it possible to reconstruct a
                                                                                                                set of emission-line spectra filling the image of the galaxy
                                              Send offprint requests      to:   Alexei    Moiseev     e-mail:   considered (Tully, 1974). Similar principles were used in
                                              moisav@gmail.com                                                  “Galaxymetr” device employed to reconstruct gas veloc-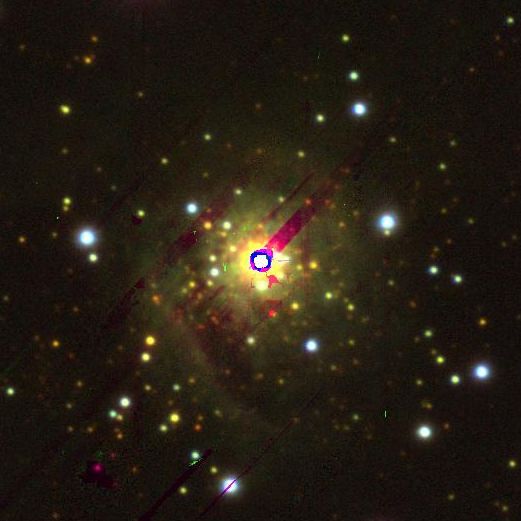
2 Moiseev: Fabry–Perot Interferometer of the 6-m telescope
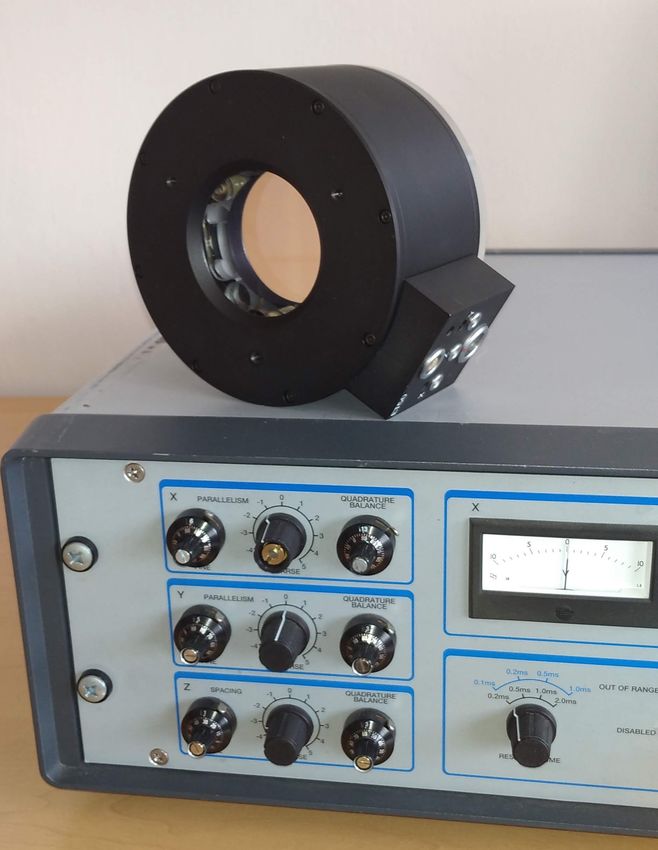
Fig. 1. Left: ET50-FS-100 scanning FPI and CS100 controller used in observations on the 6-m telescope. Right: the
initial data cube of “raw” interferograms acquired with SCORPIO-2 in Hα line in February 2020; every sixth channel
is shown. The uniformly bright rings represent night-sky airglow emission lines in different interference orders. The
footprints of H II regions of the NGC 4535 galaxy can be seen.
ity fields in galaxies of various types (de Vaucouleurs & from the broadening of emission lines in star-forming re-
Pence, 1980). gions (Roy et al., 1986; Melnick et al., 1987).
Before the end of the 20th century the number of neb-
These observations marked the beginning of panoramic ulae and galaxies studied using scanning FPIs was per-
(aka 3D) spectroscopy operating with the concept of haps greater than the number of such objects observed
“data cube” in the (x, y, λ) space. Here wavelengths λ (or using all other 3D spectroscopy methods. Let us point out
Doppler velocities of a certain line) are the third (spec- the contribution of such systems as TAURUS (Taylor &
tral) coordinate. Spectrographs can be subdivided into Atherton, 1980), TAURUS-2 (Gordon et al., 2000), HIFI
two main types by the method used to register the data (Bland & Tully, 1989), and CIGALE (Boulesteix et al.,
cube (Monnet, 1995): those with simultaneous and sequen- 1984) operated on telescopes with diameters greater than
tial recording. Integral-field spectrographs (IFS) simulta- 3 meters. Unfortunately, listing all devices and the results
neously record spectra from all spatial elements made in obtained is beyond the scope of this review. Let us just
the form of an array of microlenses (Bacon et al., 1995), point out two important trends. First, the need to perform
fiber bundle (Arribas et al., 1991), or a system of image scanning under changing atmospheric conditions makes it
slicer mirrors (Weitzel et al., 1996; Bacon et al., 2014). The efficient to use the strategy of repeated acquisition of inter-
best solution for spectrophotometric tasks proved to be a ferograms with short exposures. Image Photon Counting
combination of microlenses and optical fibers (Courtes, Systems (IPCS), which in other areas have been super-
1982), which was first implemented in the MPFS spec- seded by CCDs with higher quantum efficiency, proved to
trograph attached to the 6-m telescope of the Special perform well in that case. Second, scanning FPIs are cur-
Astrophysical Observatory of the Russian Academy of rently much less popular compared to IFS. This is due
Sciences (SAO RAS) (Afanasiev et al., 1990b, 2001). both to higher versatility of the latter in observations in
small (< 10 ) fields of view and to the fact that the data
In spectrographs with sequential registration (FPIs
acquired with FPI are often considered to be too “compli-
and Fourier spectrographs) the third coordinate in the
cated and peculiar” from the point of view of the analysis
data cube appears as as a result of additional exposures.
and interpretation compared to classical spectroscopy1 .
In the case of a scanning FPI we are dealing with a set of
However, in their dedicated fields, such as the study of
interferograms acquired by varying the optical path lµ be-
the kinematics and morphology of ionized gas, FPIs can
tween the mirrors (Fig. 1). This solution allows achieving a
be used to carry out mass homogeneous surveys. For ex-
large field of view combined with high spectral resolution,
albeit in a narrow wavelength range. High spectral resolu- 1
Here we do not discuss the instruments used with solar
tion is important for studying the gas velocity dispersion telescopes, where FPIs play a very important role.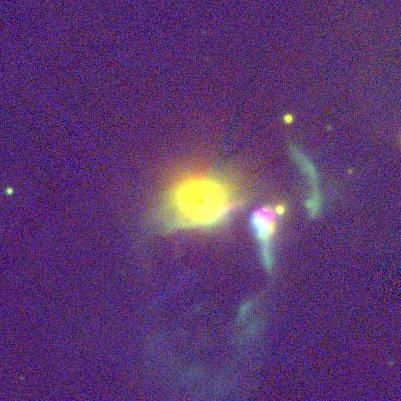
Moiseev: Fabry–Perot Interferometer of the 6-m telescope                                  3

Table 1. Systems with a scanning FPI on large and medium-sized telescopes

           Telescope/Device             FOV, 0             R            Detector             References
           10.4-m GTC/OSIRIS               8                400–8001     CCD                González et al.   (2014)
           10-m SALT/RSS                   8                    1 500    CCD                 Mitchell et al.   (2015)
           6.5-m Magellan/MMTF            27              400–1 0001     CCD                 Veilleux et al.   (2010)
           6-m BTA/SCORPIO-2               6.1   5001 , 4 000, 16 000    CCD          Afanasiev & Moiseev      (2011)
           4.2-m WHT/GHαFaS                4.7                 15 000    IPCS             Hernandez et al.     (2008)
           4.1-m SOAR/SAM-FP               3                   11 000    CCD       Mendes de Oliveira et al.   (2017)
           2.5-m SAI MSU/MaNGaL            5.6                  5001     CCD                 Moiseev et al.    (2020)
           2.1-m OAN/PUMA                 10                   16 000    CCD                 Rosado et al.     (1995)
           1
             tunable filter mode

ample, the GHASP project, which resulted in the study of        2. History of the FPIs on the SAO RAS 6-m
the kinematics of 203 spiral and irregular galaxies (Epinat        telescope
et al., 2008).
                                                                The idea of using a focus-shortening facility (focal reducer)
     Table 1 lists the characteristics of current systems       was proposed and implemented by Courtes back in the
based on scanning FPIs operating on medium- and large-          1950–1960s (Courtès, 1960). The focal reducer provides
diameter telescopes with results published in recent years:     optimal match between the angular size of star images and
name of the telescope and the instrument, field of view         detector elements and decreases the equivalent focal ratio,
(FOV), spectral resolution R = λ/δλ, detector type, and         which is important for the study of extended objects. The
a reference to the description. Unfortunately, the current      optics of the focal reducer allows it to be mounted in the
list contains fewer items than a similar list compiled more     parallel beam between the collimator and the camera of
than 30 years ago (Bland & Tully, 1989) despite the fact        the dispersing element (grisms or FPI), thereby convert-
that a number of telescopes listed in Table 1 were not yet      ing the reducer into a multimode spectrograph. It was a
constructed at the time. Moreover, according to the infor-      team from Marseilles Observatory in cooperation with col-
mation provided on the websites of the respective observa-      leagues from SAO RAS that began studying the motions
tories some of the instruments listed in the table were ei-     of ionized gas in galaxies on the 6-m telescope using an
ther under reconstruction (the system on SALT telescope)        FPI equipped with a guest reducer providing an equivalent
or decommissioned (MMTF) at the time of writing this            focal ratio of F/1.5–F/1.6 in the primary focus. The first
review. One third of the list represent FPIs with low spec-     interferograms of the NGC 925 galaxy were acquired di-
tral resolution operating in the tunable filters mode with a    rectly on photographic plates (October 28, 1978), during
10–20 Å bandwidth: the corresponding data cube usually         observations in September 1979 a two-stage image RSA
contains just a few channels (images taken in the emission      tube was mounted in front of the photo cassette. The ac-
line and in the nearby continuum).                              quired data were used to construct the Hα line-of-sight ve-
    As is evident from Table 1, the 6-m Big Telescope Alt-      locity field. Despite averaging of observed velocities over
Azimuth (BTA SAO RAS) remains the worlds’s largest              rather large 1400 × 1400 “pixels” it was possible not only
telescope used for regular 3D spectroscopic observations        to reconstruct the rotation curve of the galaxy, but also
with a scanning FPI of high (R > 10 000) spectral resolu-       estimate perturbations in the gas motions induced by the
tion. The telescope is also equipped with low (R < 1 000)       spiral density wave (Marcelin et al., 1982). In October
and intermediate-resolution (R ∼ 5 000) interferometers.        1980 and January 1981 the first interferograms of emission
It is not surprising that such a wide range of capabil-         lines of ionized gas in M 33, NGC 925, and VV 551 were
ities combined with more than four-decades long history         acquired with Marseilles’ IPCS “COLIBRI” (“Comptage
of the use of this method on the 6-m telescope contributed      linéaire de Brillance”, Boulesteix et al., 1982). The ve-
to performing many interesting studies of the interstellar      locity field of the NGC 2403 spiral galaxy and its rotation
medium both in the Milky Way and beyond. Below we dis-          curve were inferred from the four interferograms (Marcelin
cuss the history of the succession of generations of instru-    et al., 1983).
ments using scanning FPIs on the 6-m telescope and the              In 1985 a focal reducer for interferometric observa-
characteristics of this method when used in SCORPIO-2           tions providing a focal ratio of F/2.2 was made at SAO
device (Section 2). Then, after discussing the data reduc-      RAS based on commercial camera lenses. A Queensgate
tion and analysis (Section 3), we consider concrete pub-        Instruments Ltd. (UK) piezoelectrically-scanned FPI was
lished results concerning the study of the kinematics of        acquired within the framework of a joint project with
galaxies of various types (Section 4) and of the influence of   CNRS (France). The detector employed was a 512 × 512
star formation on the interstellar medium on scale lengths      KVANT (Afanasiev et al., 1987) photon counter with
ranging from several parsecs to ten kiloparsecs (Section 5).    a scale of 0.4600 /px. This system described in detail by
In Conclusions (Section 6) we discuss further prospects of      Dodonov et al. (1995) was usually referred to as CIGALE
using this method on our telescope.                             (“Cinématique des Galaxies”) named after its prototype,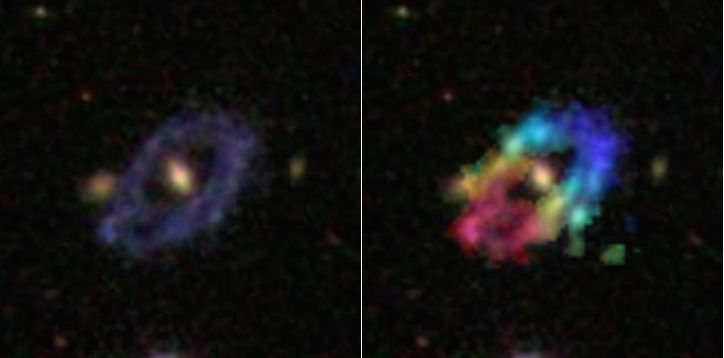
4                                 Moiseev: Fabry–Perot Interferometer of the 6-m telescope

the automated focal reducer with a scanning FPI and              Table 2. Parameters of scanning FPIs in SCORPIO-2 (for
IPCS made by the Marseilles team for the 3.6-m CFHT              λ = 6563 Å)
telescope (Boulesteix et al., 1984). The first publication
based on the results obtained from observations made with                         IFP20    IFP186    IFP751    IFP501
CIGALE on the 6-m telescope appears to be the study of                  n            20        188       751       501
the kinematics of the active galaxy Mrk 1040 (Afanasiev                 ∆λ, Å      328       34.9       8.7      13.1
et al., 1990a). In 1997 the KVANT photon counter was                    δλ, Å       13        1.7      0.44      0.80
replaced by a low readout noise 1k×1k CCD.                              F            25         21        20        16
    Within the framework of the same Franco-Souviet co-                 nz            –         40        40        36
operation observations were organized using a scanning
FPI at the 2.6-m telescope of Byurakan Astrophysical
Observatory (BAO) in Armenia (Boulesteix et al., 1987).          spheric conditions resulted in about 50% of all nights on
Initially, the French colleagues brought the original            the 6-m telescope since 2006 being allocated to observa-
CIGALE system from CFHT, which was also earlier used             tions performed with SCORPIO (Afanasiev & Moiseev,
with the 6-m telescope. Later, a new reducer was assem-          2011). However, the instrument has become quite obso-
bled for the 2.6-m telescope using a CCD operating in half-      lete over more than ten years of its operation, and this is
obscured mode. Note that both the FPIs and the set of            combined with ever mounting needs and requests of the
band-splitting filters often travelled from one observatory      observers. That is why a new focal reducer, SCORPIO-2,
to another to different sides of the Caucasus Mountain           was developed at SAO RAS under the supervision of
Range. From 1991 it also meant travelling between dif-           V. L. Afanasiev. The first observations with the new in-
ferent countries. In the early 2000s, under an agreement         strument were carried out on June 22, 2010.
the colleagues, the high-resolution interferometer and fil-          Since 2013 FPI observations on the 6-m telescope are
ters were transferred to the SAO RAS s to conduct joint          performed only with SCORPIO-2. The instrument has the
studies (see Section 5).                                         same equivalent focal ratio, and uses a 4612 × 2048 E2V
    Despite such shortcomings as poor seeing at the edge         42-90 CCD with a pixel size of 13.5 µm as a detector
of the field of view, low transmission of the optics, and the    since 2020, resulting in the same angle image scale as in
lack of automation, the focal reducer described above was        the case of old SCORPIO. Since 2020 observations are
used with the 6-m telescope for over ten years, until it be-     performed with a new camera based on a 4096×2048 E2V
came necessary to fundamentally upgrade it. In 1999 the          261-84 CCD with a physical pixel size of 15 µm, resulting
work began on the development of a new SCORPIO fo-               in a scale of 0.00 8 and 0.00 4 in the 4 × 4 and 2 × 2 readout
cal reducer under the supervision of V. L. Afanasiev with        modes, respectively. With both “rectangular” CCDs the
the participation of the author of this review (Afanasiev        full detector format is used only in observations in spectral
& Moiseev, 2005). The instrument saw first light on              modes, whereas in the FPI and direct imaging modes a
September 21, 2000.                                              2048 × 2048 px square fragment is cut out.
    SCORPIO2 was a multimode instrument where the                    All the above nitrogen-cooled CCD cameras were made
FPI was just one of the options for observations along with      at the Advanced Design Laboratory of SAO RAS as de-
direct imaging, grism spectroscopy, and spectropolarime-         scribed in Ardilanov et al. (2020).
try. The equivalent focal ratio in the primary focus of the
6-m telescope was F/2.6 (the initial focal ratio before the      2.1. FPI Kit at SAO RAS
replacement of the optics in 2003 was F/2.9). The detector
employed before 2003 was a 1024 × 1024 TK1024 CCD,               The list of ET50-FS-100 type scanning piezoelectric in-
which was later replaced with a EEV 42-40 2048 × 2048            terferometers (clear aperture 50 mm) available for obser-
CCD. This resulted in a minor change of the field of view        vations with SCORPIO-2 is provided in Table 2. Here
(from 5.0 4 to 6.0 1), because the geometric pixel size of the   n is the interference order at the center of the field of
above CCDs was equal to 24 and 13.5 µm, respectively.            view for observations in rest-frame Hα line; ∆λ = λ/n
Observations with the FPI are usually performed in the           is the distance between the neighboring orders that de-
binning mode in order to reduce the readout time and             termines the free wavelength interval; δλ, FWHM of the
readout noise and increase the signal-to-noise ratio. In the     instrumental contour, which determines the spectral reso-
case of EEV 42-40 4 × 4 or 2 × 2 px2 binning was mostly          lution; F = ∆λ/δλ, the finesse, which primarily depends
applied, which corresponds to a scale of 0.00 72 and 0.00 36,    on the properties of reflecting coatings of the interferom-
respectively.                                                    eter mirrors; nz , the number of channels into which the
    The universal layout of the instrument, its high quan-       free wavelength interval is partitioned, it determines the
tum efficiency, and the fact that it allows fast change          dimension of the data cube along the “spectral” coordi-
of observing programs depending on the current atmo-             nate. The lowest-order interferometer (IFP20) is used for
                                                                 observations in the tunable filter mode when only a small
    2
   After the reconstruction performed in 2019 the instrument     part of ∆λ is scanned, and therefore the parameter nz is
continued to be operated with the 6-m telescope under the        unimportant in that case. More details about this type of
name of SCORPIO-1.                                               observations can be found in Moiseev et al. (2020).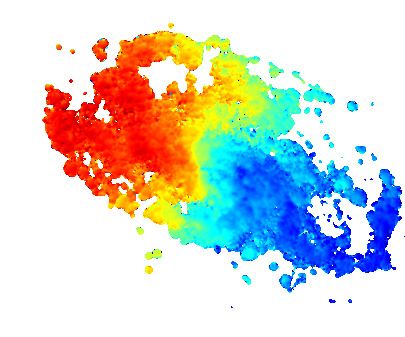
Moiseev: Fabry–Perot Interferometer of the 6-m telescope                                  5

Fig. 2. Dependence of the fractional distance between close lines on interference order (at the Hα wavelength). The
lines of different types show different variants of λ1 –λ2 pairs. The horizontal dashes indicate the domain of “good
separation”, where the observed distance between the lines is within (0.5 ± 0.2)∆λ. The gray-filled regions corresponds
to the range of n, where this condition is fulfilled.

    The interferometers IFP751, IFP186, and IFP20 were         Note that the width of the operating range of observed
manufactured for SAO RAS by the UK company IC                  velocities is equal to ∆v ≈ 390 km s−1 , which is less than
Optical Systems Ltd3 (former Queensgate Instruments) in        the scatter of velocities in interacting or active galax-
2009, 2012, and 2016, respectively. The IFP501 interfer-       ies. Therefore a line at wavelength λ cannot be distin-
ometer was used for observations with CIGALE system            guished from a component with Doppler shift λ + ∆λ
back in the 1980-1990s, and later for observations with        based on interferometer data alone. In some cases this
SCORPIO. It is still in working condition, however IFP751      can be achieved using additional information, e.g., ob-
should be preferred for most of the tasks performed with       tained from long-slit spectroscopy. At the same time, ob-
high spectral resolution. The old interferometer operat-       servations with IFP186 ( ∆v ≈ 1600 km s−1 ) allow practi-
ing in n(Hα)=235 and used in CIGALE and SCORPIO                cally unambiguous interpretation of such kinematic com-
is currently in nonoperable state and is was replaced with     ponents, but this is achieved at the expense of the loss of
IFP186.                                                        resolution (FWHM ≈ 77 km s−1 ).
    The need to work with different n is due to two factors.       Yet another problem in observations with a scanning
First, like in the case of classic spectroscopy, low resolu-   FPI arises in the “red” wavelength interval, where the
tion allows achieving higher signal-to-noise ratio in each     wavelength difference between closely located bright lines
spectral channel with the same exposure, i.e., makes it        of ionized gas is as small as about 15 Å, which is less than
possible to observe fainter objects than with high resolu-     ∆λ for n > 400. This is the case for Hα+[N II]λ6548, 6583
tion. However, in the cases where the redshifted line of       and [S II]λ6716, 6731 line systems. The narrow-band fil-
the object is located at practically the same wavelength       ters with FWHM = 12–25 Å described in the next section
as night-sky emission lines, higher resolution may become      cannot completely suppress the emission from neighboring
necessary. Second, given the technical challenge of achiev-    lines and therefore it is important that their wavelength
ing F > 30, high interference orders n are needed to           difference would not be equal to a multiple of ∆λ. The op-
achieve high spectral resolution δλ:                           timum line separation is when their wavelengths λ1 and
                                                               λ2 differ by half-order, i.e.:
                        λ    λF
                  R=       =    = nF.                                                                 λ1
                        δλ   ∆λ                                |λ2 − λ1 | = (0.5 + k)∆λ = (0.5 + k)      ,               (2)
                                                                                                      n
    This, in turn, reduces the distance ∆λ between the
neighboring orders, thereby restricting the velocity inter-    where k = 0, 1, 2.... Fig. 2 illustrates the problem of choos-
val available for unambiguous determination of this quan-      ing n for optimal separation of all the above close pairs
tity. Thus IFP751 produces for Hα an instrumental profile      of spectral lines, which correspond to different slanting
with FWHM ≈ 20 km s−1 , which allows studying the dis-         lines in the plot. It is evidently impossible to achieve the
tribution of velocity dispersion and multicomponent struc-     ideal fulfillment of condition (2) for all pairs, but a softer
ture of emission lines in star-forming regions (Section 5).    criterion—requiring for the lines to be separated within
                                                               (0.3–0.7)∆λ can be satisfied by several intervals of in-
 3
     https://www.icopticalsystems.com/                         terference order values n. The first one corresponds to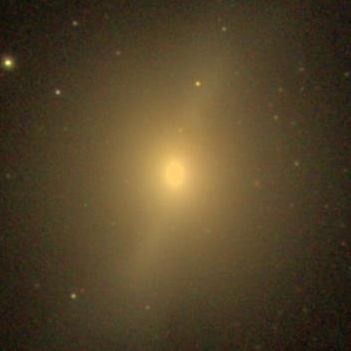
6                                 Moiseev: Fabry–Perot Interferometer of the 6-m telescope

k = 0 and n ≈ 150–200. The parameters of IFP186 were             the WHAM instrument used to study the diffuse gas of
chosen based on this criterion. The next “optimum” do-           both the Milky Way (Haffner et al., 2003) and the Large
main with n ≈ 750 corresponds to the IFP751 interferom-          Magellanic Cloud (Ciampa et al., 2021). High spectral res-
eter. In the third domain with n ≈ 1100 practically all line     olution and sensitivity are achieved using two fixed-gap
pairs satisfy the “hard” criterion (2). Such interferometers     Fabry–Perot etalons, but the low angular resolution (1◦ )
(n = 1051, 1353) were used to perform the first observa-         prevents its use for studying most galaxies and nebulae.
tions on the 6-m telescope of SAO RAS (Marcelin et al.,              A simple and common solution to isolate the required
1982). However, in that case ∆v < 300 km s−1 in the Hα           part of the spectrum is to use narrow bandwidth filters
line, which is too small for many tasks of extragalactic         FWHM≈ ∆λ. However, in this case several factors limit
astronomy. Moreover, given that the width of interference        the efficiency of observations. First, a set of filters with
rings decreases with R, care must be used to ensure bona         overlapping transmission curves centered on the corre-
fide resolution of rings across the entire field of view (i.e.   sponding systemic velocities is needed to isolate the emis-
FWHM>2 px).                                                      sion lines of galaxies in a given redshift range. Second,
    It goes without saying that the best solution would          manufacturing interference filters of sufficiently large di-
be using a single FPI allowing the gap between the               ameter, with a bandwidth of a few nanometers and peak
plates to be accurately varied from 10 to 500 µm, which          transmission no lower than 70–80% is quite a challenging
would cover the entire required range of n. Unfortunately,       technical task. Such filters are available from only a few
this is impossible to achieve with commercially avail-           manufacturers in the world and are quite expensive. The
able piezoelectric interferometers, and laboratory devel-        cost of a set of 10–15 such filters is close to that of scan-
opments have not yet been completed (Marcelin et al.,            ning FPI with the same light diameter. Third, the trans-
2008).                                                           mission profile of such filters is usually close to Gaussian.
                                                                 This can lead to significant transmission variations within
                                                                 the operating wavelength range, as well as to light from
2.2. Narrow-Band Filters                                         neighboring orders of interference in the wings of the filter
                                                                 transmission profile. Note also that the peak transmission
According to formula (1), in the case of non-                    wavelength of narrow-band filters varies significantly (in
monochromatic radiation, each pixel of the interferogram         FWHM units) with the ambient temperature.
contains a signal at wavelengths corresponding to different          The observers often consider the lines of the object
interference orders, so that nλ = const. When consider-          “coming” from neighboring interference orders as a par-
ing the data cube, this means “packing” light with differ-       asitic pollution. There are papers whose authors mistook
ent wavelengths within a narrow spectral interval (see our       the [N II] emission from other orders as the second sub-
Fig. 3 as well as Fig. 2 in the paper Daigle et al., 2006). It   system of ionized gas in the Hα line. On the other hand,
is therefore necessary to isolate the spectral interval under    if the condition (2) was fulfilled when choosing the inter-
study in order to reduce stray illumination from the object      ferometer parameters and the emission lines in the ob-
and from the night sky lines. The ideal solution would be        ject studied are narrow enough for their confident sep-
to use a narrow-band filter with a rectangular transmission      aration, it becomes possible to investigate the gas kine-
profile with a width of ∆λ wide centered on the required         matics using the data for two emission lines. In the case
emission line. This ideal could be closely approximated by       of Hα+[N II] we are dealing with lines with different ex-
a system of two FPIs with widely differing interference          citation mechanism. It becomes possible to study effects
orders tuned so that in the case of scanning their trans-        related with shocks with nitrogen line emission intensified
mission peaks would always coincide at the desired wave-         relative to the Balmer lines. Therefore, the brightness and
length. The spectral resolution is set by a large-gap inter-     the line-of-sight velocity distribution of these lines may
ferometer (n ≈ 200–1000), and the free spectral interval is      differ. Figure 3 shows an example of simultaneous observa-
determined by an interferometer with n = 10–30. The lat-         tions of the nitrogen and hydrogen lines in the NGC 1084
ter gives ∆λ = 200–600 Å for the Hα line. Isolating such a      galaxy (see also Section 5). This mode of observation can
wide band is not a problem for modern intermediate-band          also be useful for studying ionized gas in early-type galax-
interference filters and is practically realized in the case     ies where Hα line in the central regions is hidden in a
of the FPI operating in the tunable filter mode (Veilleux        contrast underlying absorption of the stellar population
et al., 2010; Moiseev et al., 2020). Systems based on dual       spectrum, whereas [N II] continues to be visible. At the
FPIs have long been efficiently operated on solar tele-          same time, the Hα line is much brighter than [N II] in the
scopes (see, for example Kentischer et al., 1998) and have       H II regions at the periphery of the stellar disk. An ex-
even been used to observe bright comets (Morgenthaler            ample of simultaneous reconstruction of the line-of-sight
et al., 2001).                                                   velocity fields in these lines for the NGC 7742 galaxy can
    Unfortunately, the author do not known about effi-           be found in Sil’chenko & Moiseev (2006).
ciently working systems for night observations using a               The filters available in SCORPIO-2 allow observing
dual scanning FPI, although the corresponding projects           objects with line-of-sight velocities ranging from −200 to
have been repeatedly announced (Rangwala et al., 2008;           13 500 km s−1 in the Hα line, to about 6 000 km s−1 in
Marcelin et al., 2008). A possible partial exception is          the [S II]λ6717 line and to about 17 000 km s−1 in the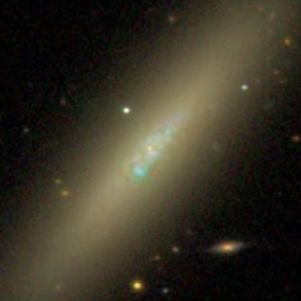
Moiseev: Fabry–Perot Interferometer of the 6-m telescope                                  7

                                                                grams in Fig. 1. A good tradeoff between size and cost are
                                                                the 50 mm wide square filters from Custom Scientific, Inc.
                                                                (USA). They almost completely cover the SCORPIO-2
                                                                field of view.
                                                                    Based on experience in separating close lines from
                                                                neighboring orders, our team at SAO RAS currently
                                                                prefers filters with FWHM ≈ 30 Å, which are twice wider
                                                                than those with which we began FPI observations on the
                                                                6-m telescope. One of the advantages of these filters is
                                                                their near-rectangular transmission curve in contrast to
                                                                the Gaussian profile of the more narrow-band filters.

                                                                3. Data reduction and analysis
                                                                Primary reduction of the data acquired with the scanning
                                                                FPI includes both the standard procedures for CCD frame
                                                                reduction (bias subtraction, flatfielding, and cosmic-ray
                                                                hit removal) and specific procedures: channel-by-channel
                                                                photometric correction and wavelength calibration taking
                                                                into account the phase shift. A sufficiently detailed de-
                                                                scription of the basic principles and algorithms can be
                                                                found in several works (Bland & Tully, 1989; Gordon
Fig. 3. Lines of ionized gas in the NGC 1084 galaxy             et al., 2000; Moiseev, 2002). A detailed description of the
(Moiseev, 2000). Top: the relative location of the              IFPWID software package used for processing SCORPIO
Hα+[N II] lines (the gray filled area) and the narrow-band      FPI can be found in Moiseev & Egorov (2008), where the
filter (the thick line) in the wavelength scale. The num-       technique of glare subtraction are discussed and the ac-
bers indicate interference orders (n = ..) separated by ∆λ      curacy of velocity and velocity-dispersion measurements
gaps. Bottom: spectrum observed with the FPI.                   with different FPIs is evaluated. Additional procedures
                                                                used to improve the accuracy of the wavelength scale by
                                                                using the “Λ-cube” are described in Moiseev (2015).
[O III]λ5007 line. Of course, other lines can also be ob-
served with this filter set. Finkelman et al. (2011) recon-
structed the polar ring falaxy velocity field at z = 0.06       3.1. Sky Background Subtraction
(Vsys ≈ 18 000 km s−1 ) in the Hβ line. The current list of
filters is available in the web page of the instrument4 ; one   Let us now consider in detail the procedure for subtracting
can also download from this site the latest version of the      the night-sky background in the IFPWID package, where
program for choice the optimum filter for the given line,       some important modifications have been made that were
redshift and air temperature.                                   not described in the papers published in 2002–2015. In ob-
     This filter kit has been collected at SAO RAS over         servations with the photon-counting system, variations in
many years as a result of various cooperative pro-              the brightness of the sky background (emission lines of the
grams and grants. The collection started with several           Earth’s upper atmosphere, scattered light from the Moon,
filters for observations near the Hα line, which was            etc.) are averaged into the final cube by repeat scanning
provided by colleagues from Byurakan Astrophysical              cycles with short (10–30 s) integration times of individ-
Observatory and manufactured by Barr Associates Inc.            ual interferograms. This allows the sky background to be
(USA) at the request of Marseilles Observatory. This set        subtracted from the wavelength-calibrated spectra by av-
was extended with filters manufactured for SAO RAS              eraging over areas free of the emission from the object, like
by the Institute for Precision Instrument Engineering           it is usually done in classical spectroscopy. Such a princi-
(IPIE, Moscow). Later, filters manufactured by Andover          ple was used in the ADHOC software suite (J. Boulesteix)
Corporation (USA) were purchased from different sources.        developed for processing CIGALE data. Modern modifica-
Unfortunately, after 15 years of operation use the fil-         tions of this algorithm are described Daigle et al. (2006).
ters manufactured by the IPIE were partially degraded.          However, in the case of CCD observations, several minutes
Now these filters are almost all replaced with analogs from     long exposures are needed because of the non-zero noise
Andover Corporation. Most filters have a clear aperture         and readout times. Here one can no longer neglect back-
of 50 mm (2 inches)—a common standard among many                ground variations within the resulting cube; it must be
manufacturers. Unfortunately, this size is not sufficient to    subtracted from each frame even before wavelength cali-
cover the field of view diagonally, so there is vignetting      bration by averaging the sky emission over the azimuthal
in the frame corners, which is noticeable in the interfero-     angle ϕ in concentric rings (Moiseev, 2002). It is impor-
                                                                tant to accurately determine the center of the system of
 4
     https://www.sao.ru/hq/lsfvo/devices/scorpio-2/             interference rings from the sky lines. The IFPWID package
8 Moiseev: Fabry–Perot Interferometer of the 6-m telescope
Fig. 4. Subtraction of night-sky lines in the case of observations of the UGC 4115 galaxy. The top row shows the
observed frames and the bottom row shows the same frames in polar coordinate system (r, φ). Left to right: the initial
interferogram, substraction of sky emission in the case of simple averaging (zero-order polynomial) and by fitting the
night-sky lines by a fourth-order polynomial.
provides an automatic mode to search for the center by of the instrumental contour taken into account. A simi-
the minimizing the deviation of the averaged background lar approach was used, for example, for the MUSE FPI
profile from the observed profile. (Streicher et al., 2011; Soto et al., 2016) data reduction.
In the case of observations of low surface brightness
objects deviations of the sky background pattern from
3.2. Representation and Analysis of the Data Cube
a simple concentric model become significant because
of the variations of the instrumental contour across the The problem of optimal visualization and presentation of
field due to optical aberrations, FPI settings, detector data cubes, both in the process of analysis and in pub-
tilt, etc. The deviations increase towards the edge of the lications, is common to all methods of 3D spectroscopy.
field of view, where the interference rings are thinner and Despite the well-known progress in the dynamic visual-
the background model should be as accurate as possible. ization of “3D” spectral data (Punzo et al., 2015), it is
Previously, we used averaging the background over indi- more convenient to operate with two-dimensional maps
vidual sectors by the angle ϕ. This technique works well and graphs for interpreting the data and explaining the
for objects fitting into a small field of view (Moiseev & results to the colleagues. The specificity of the FPI data
Egorov, 2008). A better result can be obtained by con- cubes (large field of view and small extent along the spec-
structing the background model in the polar coordinate tral coordinate) allows visualization methods to be used
system. Here the background intensity at a given radius similar to those employed in the analysis of radio observa-
r can be represented as a simple function Ir (ϕ). Figure 4 tions of molecular and atomic gas. Figure 5 demonstrates
shows examples of the description of this function by a this with the example of the dwarf galaxy NGC 428 stud-
polynomial, where the zero degree corresponds to simple ied with the FPI on SCORPIO-2 (Egorova et al., 2019).
azimuthal averaging Ir (ϕ) = const. As is evident from The channel maps reveal the spatial arrangement of re-
the figure, the fourth-degree polynomial provides a better gions with different kinematics. The “position–velocity”
result of background subtraction. (P-V) diagram focuses on the line-of-sight velocities and
Currently, given the increasing number of tasks involv- the shape of the spectral lines along a given direction. The
ing observations of objects that occupy the entire field of brightness distribution map in the Hα emission line is use-
view of the instrument (construction of mosaics for nearby ful for highlighting individual H II regions whose profiles
galaxies, etc.), we are working on modelling the intensity can be viewed individually. The line-of-sight velocity dis-
distribution of the sky emission lines with the variations tribution (velocity field) can be described by some modelMoiseev: Fabry–Perot Interferometer of the 6-m telescope 9 Fig. 5. Different representations of the data cube for the NGC 428 galaxy. Top: channel maps with every third channel shown. The line-of-sight velocities are labelled. Middle: the PV diagram along the major axis of the galaxy (left) and examples of Hα emission-line spectra near the nucleus (right). Bottom: maps constructed as a result of approximating the spectra by the Voigt profile: emission-line flux and line-of-sight velocity, velocity-dispersion fields. approximations (Section 4.1), and the σ line-of-sight ve- imation of the original profile not subject to instrumen- locity dispersion map can be used to study turbulent gas tal broadening). The width of the instrumental contour is motions (Section 5). To obtain such maps, the spectral determined by the calibration lines. For a more detailed line profile is fitted by the Voigt function, which is a con- description of the methodology for constructing velocity volution of the Lorenz profile (describing the instrumental dispersion maps corrected for instrumental broadening see contour of the FPI) and the Gaussian profile (an approx- Moiseev & Egorov (2008).
10                               Moiseev: Fabry–Perot Interferometer of the 6-m telescope

3.3. Observations in Absorption Lines                           4. Observational results: objects with dominating
                                                                   circular rotation
Above we discussed only the application of the scanning
FPI for 3D emission line spectroscopy of ionized gas. This      In this section we briefly discuss the studies made with the
is the most popular application for this technique. At the      FPI on the 6-m telescope of galaxies whose gas kinemat-
same time, FPI can obviously be used for the 3D spec-           ics is dominated by regular circular rotation. Often the
troscopy in absorption lines. Overlap of the signals from       aim of these studies was to search for deviations from this
neighboring orders and modulation of the observed spec-         symmetric pattern. We therefore first discuss the methods
trum produced by the narrow-band filter (Section 2.2 give       used to extract the circular component from observational
a certain problem. It is therefore important for the spectral   data.
line studied to have a sufficiently high contrast and have
no blend within the free wavelength interval of the FPI.        4.1. Analysis of the Velocity Fields of Rotating Disks
In the 1990s, a series of successful observations of stars in
globular clusters (Gebhardt et al., 1995) and selected areas    The observed line-of-sight velocity of a point moving in
toward the Milky Way bar (Rangwala et al., 2009) were           an orbit tilted by angle i with respect to the sky plane is
made using a FPI in the Ca II λ8542 line with the 1.5- and      given the by the following formula:
4-m Cerro Tololo Inter-American Observatory telescopes.
In the latter case, it was possible to measure both the line-   VOBS = VSYS + VR sin ϕ sin i +
of-sight velocities and to estimate the metallicity for more
                                                                        Vϕ cos ϕ sin i + VZ cos i,                       (3)
than 3000 stars from EW (Ca II). At the time, this method
was a serious competitor to multi-object spectroscopy for       where R and ϕ are the radial and azimuthal coordinates
this particular task. The same technique was used on the        in the orbital plane, respectively; VSYS is the systemic ve-
0.9-m telescope of the same observatory to acquire the ve-      locity, and Vϕ , VR , and VZ are the azimuthal, radial, and
locity field of the stellar component and measure the an-       vertical components, respectively, of the velocity vector.
gular velocity of the bar rotation in the early-type galaxy         The methods used to determine the parameters that
NGC 7079 (Debattista & Williams, 2004). Note the works          describe the motion of ionized gas in galaxy disks from 3D
of the same team carried out on the CFHT telescope using        spectroscopy data can be subdivided into several groups:
the scanning FPI combined with an adaptive optics sys-
tem (Gebhardt et al., 2000) to study the stellar dynamics       1. Independent search for parameters appearing in for-
in the center of the globular cluster M 15.                        mula (3) in narrow rings of the velocity field along the
                                                                   radius—the “tilted ring” method.
    Because of the lack of filters for isolating the red cal-   2. Harmonic expansion of the line-of-sight velocity distri-
cium line, in our observations carried out with SCORPIO            bution along the azimuthal angle within narrow rings.
on the 6-m telescope we tried to measure velocities of          3. Fitting of the entire line-of-sight velocity field. It can
stars in clusters by their Hα absorption lines. In test ob-        be be accompanied by the use of the map of other mo-
servations of the globular cluster M 71 we simultaneously          ments determined from the line profile (surface bright-
determined the line-of-sight velocities of about 700 stars         ness and velocity dispersion) or results of numerical
down to mv ≈ 18m , with individual measurements accu-              simulations.
rate to within 2–4 km s−1 (Moiseev, 2002). This method          4. Modelling of the entire data cube in the given emission
was subsequently applied to measure the line-of-sight ve-          line.
locities and identify members of open clusters of the Milky
Way within the framework of A. S. Rastorguev’s applica-            Let us now consider these methods in more detail.
tion (Sternberg Astronomical Institute of Moscow State
University). In 2002–2003 such measurements were carried        4.1.1. Search for Parameter Values in Narrow Rings
out for several clusters, unfortunately, the results have not
yet been published.                                             The “tilted-ring” method was initially used to analyze the
                                                                velocity field obtained from 21-cm H I radio data (Rogstad
    We also carried out experiments on the 6-m telescope
                                                                et al., 1974). Its classical description, which became the
to reconstruct the velocity fields of stars in galaxies using
                                                                basis of the popular ROTCUR procedure included into
FPI observations in the Ca II λ6495 line, but the accu-
                                                                GIPSY and AIPS radio-data reduction software, can be
racy of measurements proved to be low because of the
                                                                found in a number of papers (Begeman, 1989; Teuben,
low contrast of the line. On the other hand, the reflec-
                                                                2002). Below we briefly describe the basics of this tech-
tive coatings of IFP186 and IFP751 are optimized for
                                                                nique adapted for the analysis of line-of-sight velocity
observations, including observations in the 8500–9500 Å
                                                                fields of ionized gas (Moiseev et al., 2004; Moiseev, 2014b).
wavelength, and the new E2V 261-84 detector has rela-
                                                                    In the case of purely circular rotation of a thin flat
tively high sensitivity in this range almost without fringes.
                                                                disk (VR = VZ = 0, Vϕ = VROT ) the observed line-of-sight
Therefore, mapping extended objects in the Ca II triplet
                                                                velocity is equal to:
lines with SCORPIO-2 may have interesting prospects if
the appropriate filters are acquired.                           VOBS (r, P A) = VSYS + VROT (R(r)) ×
Moiseev: Fabry–Perot Interferometer of the 6-m telescope 11
cos(P A − P Akin ) sin i Fourier analysis of velocity fields to recover the full three-
× , (4)
(1 + sin2 (P A − P Akin ) tan2 i)1/2 dimensional velocity vector of gas in the disk under cer-
tain assumptions about the nature of the spiral structure
where r is the apparent distance from the rotation center
(Section 4.2). Unfortunately, the proposed method of the
in the sky plane and P A is the position angle. The distance
reconstruction of the velocity vector was not widely used.
from the rotation center in the plane of the galaxy is:
Possible reasons were the need for a very painstaking anal-
R(r) = r(1 + sin2 (P A − P A0 ) tan2 i)1/2 (5) ysis involving photometric data, because the result often
proved to be sensitive to the choice of the disk orientation
In formula (4) P Akin and P A0 are the position angles parameters. On the other hand, the use of Fourier analysis
of the kinematic axis and line-of-nodes of the disk, respec- to describe the line-of-sight velocity fields of both the gas
tively. In the case of purely circular motions P Akin ≡ P A0 . and the stellar component in galaxies has recently become
The observed velocity field is subdivided into elliptic rings popular because of Kinemetry program (Krajnović et al.,
defined by equation (5) for R = const. In each ring the 2006). The algorithm involves generalizing the decompo-
observed dependence VOBS (P A) is fitted by model (4) via sition of surface brightness distributions to higher-order
χ2 minimization. As a result, we obtain for the given R the moments of the line-of-sight velocity distribution function:
set of parameters that characterize the orientation of or- to the line-of-sight velocity (first moment), velocity disper-
bits (P Akin , i), velocity of circular rotation, and systemic sion (second moment), etc. Note that the method does not
velocity. require the assumption of a flat disk and can be applied
Ifthe disk is not strongly warped, we can assume that even to stellar-kinematics data in early-type galaxies. And
the inclination and systemic velocity do not depend on in the case of gas in disk galaxies Kinemetry can be used
the radius (i = i0 , VSYS = const), in this case radial vari- as a high spatial frequency filter isolating the regular com-
ations P Akin reflect features of the distribution of noncir- ponent of the velocity field.
cular components of the velocity vector. In particular, the
radial gas flows caused by the gravitational potential of
the galactic bar result in a“turn” of P Akin with respect to 4.1.3. Modelling the Entire Field
P A0 of the disk. A comparison with the orientation of el-
liptical isophotes allows us to distinguish the case of a bar The “tilted rings” method allows one to adequately
(i.e., a change of the shape of orbits in the galactic plane) enough understand the pattern of motions in a flat disk.
from that of an inclined or warped disk (i.e., circular or- If the disk plane is warped, a first approximation for the
bits in another plane)—see a discussion and references in warp parameters can be inferred. However, the parame-
Moiseev et al. (2004); Egorova et al. (2019). ter estimates obtained by fitting observations in a narrow
The “tilted ring” method is quite flexible and allows ring by formula (4) are unstable, especially in the case
one to test hypotheses about the behavior of gas motions of incomplete ring filling by data points with bona fide
by fixing different parameter combinations in equation (4). velocity measurements. First, there is a VROT –i degener-
One can also estimate the amplitude of radial motions by acy, especially for small tilt angles i < 30–40◦ . Indeed, for
setting Vr 6= 0 in equation (3), which is applicable for col- M rings we obtain that the total velocity field with fixed
liding ring galaxies (Bizyaev et al., 2007). Sil’chenko et al. dynamical center is described by 4 × M free parameters.
(2019) used a modification of the method, which allows the For FPI observations of several arcmin-sized galaxies as
motion of gas in strongly warped disks to be described by in Fig. 5 this number can amount to several hundred (the
successive iterations even in the case of poorly filled ve- width of the rings is close to the spatial resolution). This is
locity fields. obviously excessive. In practice, VROT , i, and P Akin vary
smoothly with radius, and simple analytical formulas for
4.1.2. Harmonic Expansion radial variations of the orbital orientation and rotation
curve can be obtained by setting VSYS = const.
The perturbation of circular motion by non-axisymmetric
gravitational potential (spiral wave, bar, tidal interaction) Describing the velocity field in terms of a single two-
results in harmonic terms of the form Aj cos jϕ, Bj sin jϕ, dimensional model with several free parameters highly in-
j = 1, 2... appearing in the right-hand part of equation (3). creases the stability of the solution. Thus Coccato et al.
In other words, the distribution of line-of-sight velocities (2007) were able to describe quite well the field of gas line-
in the narrow ring at a given radius, VOBS (ϕ), is expanded of-sight velocities in the NGC 2855 and NGC 7049 galax-
into a Fourier series where the systemic velocity—is the co- ies based on VIMOS instrument data using a warped disk
efficient at zero harmonic, etc. Sakhibov & Smirnov (1989) model with only seven parameters. The line of sight could
were among the first to apply this idea to determine the cross the disk several times in the case of strong warps and
parameters of the spiral density wave from the velocity therefore it was important to simultaneously take into ac-
fields acquired with FPI. Franx et al. (1994) used a simi- count the brightness distribution in the emission line. We
lar technique to determine the shape of the gravitational applied a similar approach to study the orientation of or-
potential of early-type galaxies. Lyakhovich et al. (1997) bits of a highly tilted and warped disk in the Arp 212
consistently described the idea of applying the method of galaxy (Moiseev, 2008). We could find a stable model so-12 Moiseev: Fabry–Perot Interferometer of the 6-m telescope
lution to describe the kinematics of ionized gas distributed and measure the pattern speed of the spirals and bar (in
in individual isolated H II regions. NGC 925). Further development of this method was stim-
In the case of a flat weakly perturbed disk the two- ulated by the studies of the Mrk 1040 (NGC 931) galaxy,
dimensional model allows its orientation parameters, even which is distinguished by its double-peaked rotation curve
in the case of “face on” orientation (i < 20◦ ) to be reli- with an unusually sharp jump in the rotation velocity 10
ably determined. An example is our FPI-based study of a kpc from the center and noticeable non-circular motions
nearly circular gas ring in the Hog Object (Fig. 6) with in the disk. These peculiarities were interpreted either as
i = 18 ± 4◦ . In that case we were able to choose between an unusually large (20 kpc) bar, invisible due to dust
a flat and a slightly warped (Finkelman et al., 2011) ring extinction in the strongly inclined disk (Amram et al.,
model. Another example of flat disk modelling is repre- 1992), or as the presence of vortex structures (Afanasiev
sented by the Fathi et al. (2006) study, which uses a stel- & Fridman, 1993). The latter interpretation is associated
lar exponential disk model to parameterize the rotation with the hypothesis of hydrodynamic generation of spiral
curve. waves in the gaseous disk (Morozov, 1979), an alterna-
In addition, one can directly compare the data of nu- tive to the classical stellar disk density wave theory. The
merical hydrodynamic simulations with the observed ve- hydrodynamic mechanism required an abrupt jump of ro-
locity fields, e.g., in the case of barred galaxies (Fathi tation velocity similar to that observed in Mrk 1040, which
et al., 2005). is also reproduced in laboratory experiments on rotating
shallow water (Fridman et al., 1985). Giant vortices ro-
tating in the direction opposite that the rotation of the
4.1.4. Modelling the Data Cube galaxy (anticyclones) should also be observed in the co-
ordinate system associated with spirals in the case of the
The power of modern computers makes it possible to move
classical generation mechanism. However, their location
from fitting two-dimensional velocity fields and brightness
differs from what is predicted by hydrodynamic theory.
distributions to a more informative approximation of the
The corresponding criteria can be found in the paper by
entire data cube. Like in the case of the tilted-ring method,
Lyakhovich et al. (1997) dedicated to the method of re-
such algorithms were first applied to radio data cubes,
constructing the pattern of three-dimensional gas motions
because in the case of 21 cm line observations the spa-
on the basis via Fourier analysis of velocity fields.
tial resolution is usually not very high and the effect of
averaging the line-of-sight velocities within a synthesized Within the framework of the joint ‘Vortex’ project
beam pattern (beam smearing) is important. Given that (SAO RAS, INASAN RAS, and SAI MSU) several dozen
the brightness in this line is linearly related to H I density, velocity fields were acquired using observations made on
the intensity distribution can often be set in the form of a the 6-m telescope and Fourier analysis was performed for
smooth function of radius. A good example is the popular them. Unfortunately, only the results of the reconstruction
TiRiFiC package (Józsa et al., 2007), which allows one to of three-dimensional velocity vectors in the disks of spiral
study warps and other features of the spatial structure of galaxies NGC 157 (Fridman et al., 2001a) and NGC 3631
gas disks. (Fridman et al., 1998, 2001b) have been published. In both
In the case of optical data cubes, such is primarily use- cases, giant vortex structures associated with the classi-
ful for gas kinematics in galaxies at large redshifts, where cal density wave generation mechanism were found. Also
the beam smearing effect is just as important, because the Fridman et al. (2005) published the results of the analysis
spatial resolution is comparable to the size of the objects of the kinematics of the other 15 galaxies galaxies of the
studied. Here we point out GalPak3D (Bouché et al., 2015) sample using “tilted ring” method. For these objects the
and 3D BAROLO (Di Teodoro & Fraternali, 2015) software rotation curves were constructed free from the influence of
packages. The latter can also be used analyze the cubes non-circular motions, and numerous regions with peculiar
obtained with the FPI (private communication). Bekiaris kinematics of ionized gas were identified where the de-
et al. (2016) have already demonstrated the possibility of viations from circular rotation amount to 50–150 km s−1 .
such analysis with the GBKFIT package for the case of Two kinematic components in the line-of-sight projection
FPI observations of disk galaxies in the GHASP survey. are observed in some cases. Such large peculiar velocities
are not associated with spiral waves, but are rather due
to either “galactic fountains” caused by star formation
4.2. Spiral Galaxies (section 5), or interactions with the environment, includ-
ing accretion of gas clouds. Some of these peculiar regions
The first observations with FPI on the 6-m telescope
were detected during the early long-slit spectrograph ob-
(Section 2) revealed perturbations of the line-of-sight ve-
servations on the 6-m telescope (Afanasiev et al., 1988,
locity fields in NGC 925 and NGC 2903 related with their
1992), while FPI allowed them to be studied in detail.
spiral arms (Marcelin et al., 1982, 1983). These data were
later analyzed using the method of harmonic decomposi- Of interest is the NGC 1084 galaxy with a complex
tion (Sakhibov & Smirnov, 1989), which made it possible structure of emission-line profiles found in its periphery. In
to determine the parameters of the two-arm density wave, this galaxy the brightest in the Hα system of H II-regions
understand the direction of radial gas motions in the arms, looks like an emission “spur” extending perpendicular toYou can also read