Sea anemone genomes reveal ancestral metazoan chromosomal macrosynteny
←
→
Page content transcription
If your browser does not render page correctly, please read the page content below
Sea anemone genomes reveal ancestral metazoan chromosomal macrosynteny Ulrich Technau ( ulrich.technau@univie.ac.at ) University of Vienna https://orcid.org/0000-0003-4472-8258 Sophia Robb Stowers Grigory Genikhovich University of Vienna https://orcid.org/0000-0003-4864-7770 Juan Montenegro University of Vienna Witney Fropf Stowers Lukas Weinguny University of Vienna Shuonan He Stowers Institute for Medical Research https://orcid.org/0000-0001-6709-9648 Shiyuan Chen Stowers Institute for Medical Research https://orcid.org/0000-0001-9805-2906 Jessica Lovegrove-Walsh University of Vienna https://orcid.org/0000-0002-4362-4177 Eric Hill Stowers Katerina Ragkousi Stowers Daniela Praher University of Vienna David Fredman University of Vienna Yehu Moran The Hebrew University of Jerusalem https://orcid.org/0000-0001-9928-9294 Matthew Gibson Stowers Bob Zimmermann University of Vienna https://orcid.org/0000-0003-2354-0408 Page 1/32
Biological Sciences - Article Keywords: sea anemones, chromosome-level genome assemblies, Nematostella vectensis, Scolanthus callimorphus Posted Date: August 17th, 2021 DOI: https://doi.org/10.21203/rs.3.rs-796229/v1 License: This work is licensed under a Creative Commons Attribution 4.0 International License. Read Full License Page 2/32
Abstract
Draft genome sequences of non-bilaterian species have provided important insights into the evolution of
the metazoan gene repertoire. However, there is little information about the evolution of gene clusters,
genome architectures and karyotypes during animal evolution. Here we report chromosome-level genome
assemblies of two related anthozoan cnidarians, the sea anemones, Nematostella vectensis and
Scolanthus callimorphus. We find a robust set of 15 chromosomes with a clear one-to-one
correspondence of the chromosomes between the two species. We show that, in contrast to Bilateria, Hox
and NK clusters of investigated cnidarians are disintegrated, indicating that microsynteny conservation is
largely lost. In line with that, we find no evidence for topologically associated domains, suggesting
fundamental difference in long-range gene regulation compared to vertebrates. However, both sea
anemone genomes show remarkable chromosomal conservation with other cnidarians, several
bilaterians and the sponge Ephydatia muelleri, allowing us to reconstruct the putative cnidarian and
metazoan chromosomes, consisting of 19 and 16 ancestral linkage groups, respectively. These data
suggest that large parts of the ancestral metazoan genome have been retained in chromosomes of some
extant lineages, yet, higher order gene regulation may have evolved only after the cnidarian-bilaterian
split.

Introduction
Draft genomes comprising hundreds to thousands of scaffolds, while helpful to identify gene repertoires,
were neither suitable to reconstruct the evolutionary history of chromosomes nor did they always allow
researchers to investigate long-range cis-regulation of genes. Recent chromosome-level genome
assemblies refueled the opportunity to compare the content and localization of homologous genes
between distantly related species. This led to the reconstruction of ancestral linkage groups among
Chordata1,2 and Spiralia3,4. However, these analyses remained restricted to bilaterians and did not provide
insights into the origin of metazoan chromosomes or their diversification. In this regard, representatives
of Cnidaria, the sister clade to Bilateria, are crucial.

Cnidaria constitute a large clade of basally branching Metazoa, dating back between 590 and 690 Mya5–
7.Their robust phylogenetic position as sister to Bilateria makes them the key group to study the
evolution of bilaterian features, such as axis organization, mesoderm formation and central nervous
system development8. The genome of the edwardsiid sea anemone Nematostella vectensis became the
first non-bilaterian animal genome to have a draft scaffold-level sequenced in 2007, and revealed
uncanny conservation of gene content to vertebrates as well as first hints for macrosyntenic
conservation9. By now, genomes of the representatives of all five cnidarian classes have become
available10–18 providing valuable insight into various aspects of the cnidarian gene complement and
genome organization. However, these genomes originated from fairly distantly related species, and a
cornerstone to genomic inquiry has long been the conservation signals of recently diverged taxa19. The
 Page 3/32
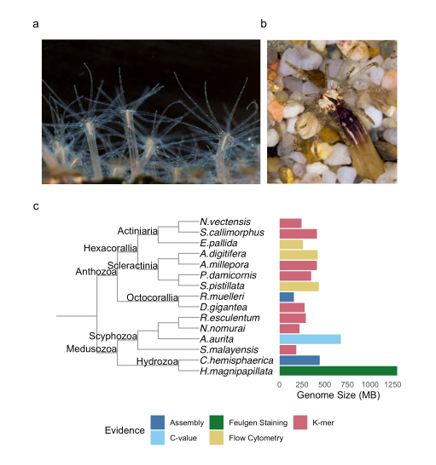
“starlet sea anemone” Nematostella (Figure 1a), which has been developed into an important model
organism, belongs to the family of Edwardsiidae within the Actiniaria. Yet, to date no genome sequence
of another edwardsiid sea anemone has been reported. An interesting and closely related sea anemone of
the edwardsiid family is the “worm sea anemone” Scolanthus callimorphus (Figure 1b), dwelling in
European seawater20,21, which according to our molecular clock calculations has separated from
Nematostella approximately 174 Mio years ago (EDF 1, see Materials and Methods for details).

Main Text
High Quality Chromosome-Level Assemblies of Two Edwardsiid Genomes

Using short-read sequencing and a k-mer coverage model, we estimated the genome length of
Nematostella at 244 Mb (EDF 2), which is substantially shorter than previously suggested at 450 Mb9.
This discrepancy could be in part attributed to the previous use of four haplotypes in sequencing. The
genome of the sea anemone Exaiptasia pallida is similar in length to Nematostella22, while the estimated
414 Mb of the Scolanthus genome is at present the largest sequenced actiniarian genome, mainly due to
expansions of repetitive elements. This indicates that the genome lengths among Actiniaria may be more
dynamic than suggested from earlier analyses (Figure 1c). Using PacBio long-read sequencing and high-
throughput conformation capture (Hi-C), we then assembled chromosome-level of
Nematostella and Scolanthus genomes, which far surpass the quality of the published
Nematostella genome in terms of contiguity, correctness, mappability and completeness (see
Supplementary Text, EDF 3-5 for details).

In order to compare the genomic location of homologous genes between the edwardsiids, we utilized the
previously sequenced Scolanthus transcriptome23 and we determined 24,625 gene models (see Materials
and Methods for details). For Nematostella, we sequenced several transcriptome libraries from various
developmental stages, which were assembled earlier as NVE gene models24. To further improve the gene
annotation, in particular with respect to isoforms and untranslated regions, we used a combination of
IsoSeq and RNAseq data, which allowed us to identify 24,525 gene models and 36,280 transcripts.
BUSCO analysis showed that the transcriptome contains 96.1% of expected metazoan conserved
sequences, which represents an increase over the previous NVE gene models (90.6% complete BUSCOs)
(EDF 6). Additional comparison to previously cloned complete CDS (EDT 7) showed that 261 of the 277
sequences (94.2%) were present. Of the missing 16 sequences, 15 could be confidently aligned to the
reference genome and have been manually added to the annotation files.

To facilitate the usage of the newly assembled genomes, we established a publicly accessible Genome
Browsers. Both new genome assemblies and associated data are available for browsing, downloading,

 Page 4/32
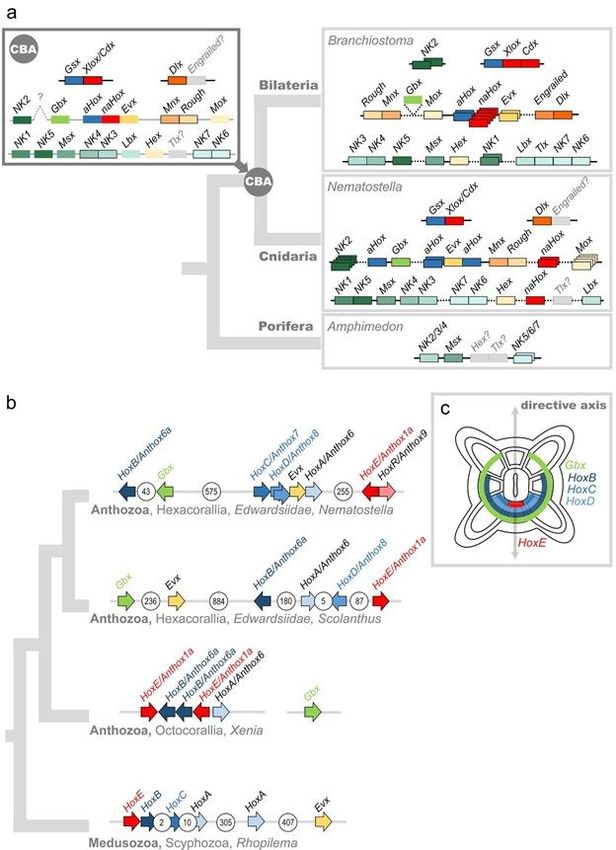
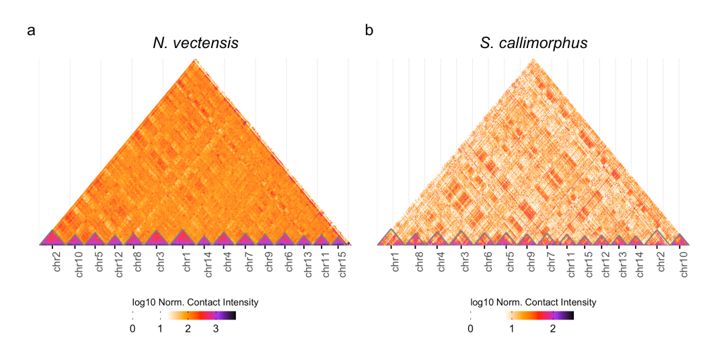
and BLAST at SIMRbase (https://simrbase.stowers.org). The Nematostella vectensis genome assembly,
referred to as Nvec200, has an abundance of aligned track data, including the newly generated gene
models and a large collection of published RNAseq and ChIP-seq analysis as well as 145 ultra-conserved
non-coding elements (UCNEs) shared between Nematostella and Scolanthus (Supplementary Text; EDT
8).

Chromosomal Organization of the NK and extended Hox gene clusters

The chromosome-level assembly of the Nematostella genome allowed us to re-address the evolution of
specific gene clusters. Prominent examples of clusters of homeodomain transcription factor coding
genes ancestral for Bilateria include the SuperHox cluster, the ParaHox cluster, the NK/NK-like cluster as
well as NK2 group genes located separately25–27. It has been hypothesized that all of them originated
from a single gene cluster, which then disintegrated during evolution (for review see27). Our analysis
revealed that Nematostella possesses a separate ParaHox cluster of two genes, (Gsx and Xlox/Cdx) on
chromosome 10, and a SuperHox cluster on chromosome 2 containing Hox, Evx, Mnx, and Rough, as well
as more distant Mox and Gbx28 (Figures 3 and 4, EDT6). We identified an NK cluster on chromosome 5
containing NK1, NK5, Msx, NK4, NK3, NK7, NK6, and more distant Ladybird, a Tlx-like gene and,
intriguingly, Hex, which is also linked to the NK cluster in the hemichordate Saccoglossus kowalevskii29
and in the cephalochordate Branchiostoma floridae. Similar to Bilateria, the NK2 genes were clustered
separately and found on chromosome 2 (Figures 3 and 4, EDT6). In contrast, in earlier branching
sponges, neither ParaHox nor extended Hox cluster genes exist, and only the NK cluster is present with a
single NK2/3/4 gene, two NK5/6/7 genes, an Msx ortholog, as well as possible Hex and Tlx orthologs30,
(EDF 7). Taken together, this allows us to propose that the last common ancestor of Cnidaria and
Bilateria possessed an NK-cluster on a chromosome different from the one carrying the SuperHox cluster,
and a separate NK2 cluster, which might have been on the same chromosome as the SuperHox cluster
(Figure 4). The hypothesized SuperHox-NK Megacluster25, if it ever existed, must have both formed and
broken apart during the time after the separation of the sponge lineage, but before the origin of the
cnidarian-bilaterian ancestor (Figure 4a, Supplementary Text).

Topologically associating domains are not detected in either sea anemone genome

In the past decade, high resolution chromosome conformation capture has increased interest in
topologically associating domains (TADs), recurring chromosomal folding motifs evidenced by signals in
Hi-C contact maps31. Flanking regions of TADs are positively correlated with CCCTC-binding factor
(CTCF) binding sites. Interestingly, no CTCF ortholog has been detected among non-bilaterian
animals32,33. Consistent with this, we did not detect evidence for TADs in our edwardsiid pseudo-
chromosomes in the form of differential enrichment of contact density, exemplified in the contact map

 Page 5/32
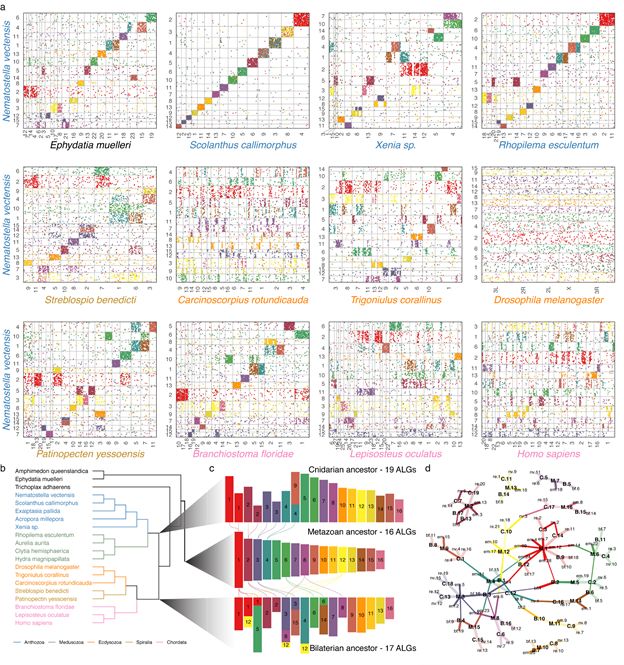
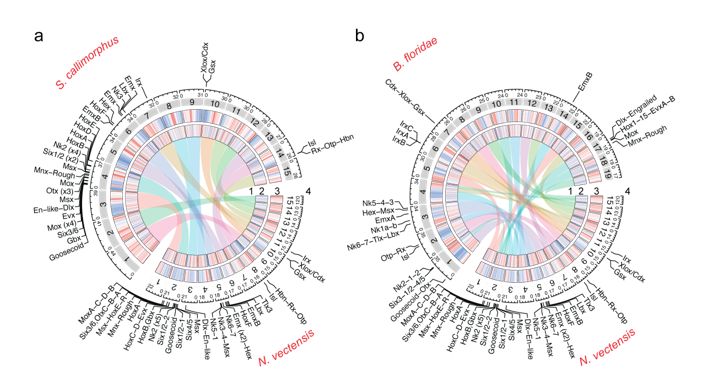
shown in EDF 8. By comparison, analyses of other datasets generated using the identical protocol at
similar levels of resolution have identified clear signals of TADs34. We can not rule out that relatively
short-range Hi-C fragments in our libraries might have left important possible long-range contacts
undetected. We note, however, that the Nematostella genome is fairly gene-dense (10±4 genes per 100kb),
leaving relatively little intergenic sequence. It is conceivable that most relevant cis-regulatory elements
may be rather located in proximity to the regulated gene. This is supported by the observation that many
transgenic lines with only few kilobases upstream promoter regions driving reporter gene expression
faithfully mimick endogenous expression patterns.

Edwardsiid genomes in the context of reconstructed metazoan ancestral linkage groups

Next, we sought to determine the extent to which the Nematostella and Scolanthus pseudo-chromosomes
exhibit conservation of gene content and order (micro- and macrosynteny). Indeed, each of the 15
pseudo-chromosomes of both species share the majority of genes with a single corresponding gene in
the other species (Figure 5a). We found that 8117 of 8692 mutual best BLAST hits between
Nematostella and Scolanthus were retained on their respective pseudo-chromosomes, implying a one-to-
one homology between all 15 chromosomes. However, gene order was largely lost from the most recent
common ancestor (MRCA), which we estimate to have diverged approximately 174 Mya (EDF 1). The lack
of selection pressure in favor of microsynteny conservation is clearly illustrated by the comparison of the
SuperHox clusters of Scolanthus and Nematostella. Although located on homologous chromosomes, the
gene order, orientation, and the number of intervening genes differs drastically between these two species
(Figure 4b). Most pseudo-chromosomes, according to their homologous pair, corresponded in length but
are much larger in Scolanthus (Figure 3a-1). This is accounted for by a large fraction of unclassified,
potentially lineage-specific repeat sequences (EDT 1, Supplementary text).

The sequencing of the Hydra genome indicated that the lineage has undergone accelerated genomic
evolution12. Yet, Hydrozoa have a 15-chromosome karyotype among several extant species35, similar to
the situation in Nematostella and Scolanthus. This opens a possibility that large-scale chromosome
dynamics did not play much role in the early branching animal clades. In order to test this, we performed
several genome-wide chromosomal comparisons by proxy of gene content (Figure 5a, top, EDF9) and
leveraged the resulting chromosomal links to postulate ancestral linkage groups (ALGs) using a graph-
based approach (Figure 5b-d, Supplementary Text).

We first compared the Nematostella chromosomes to those of other anthozoans, such as the sea
anemone Exaiptasia pallida, the stony coral Acropora millepora and the soft coral Xenia sp. (EDF 9).
While both Exaiptasia and Acropora are only assembled at the scaffold level, we observed that the gene

 Page 6/32
content of the scaffolds suggest a similar karyotype to Nematostella (EDF 9b,c). A recent chromosome-
level genome assembly of the octocorallian Xenia sp. also suggested a 15-chromosome karyotype10.
However, despite the identical number of chromosomes, the comparison of the octocorallian
Xenia showed surprisingly little homology to those of the hexacorallian Nematostella. We discovered
many translocations and fusions of apparently varying ages with only 3 chromosomes demonstrating a
one-to-one relationship (Figure 5a).

Next, we compared Nematostella chromosomes to the chromosomes of the members of the anthozoan
sister group Medusozoa, whose split from the anthozoans is estimated at more than 580 Mya by
calibrated molecular clocks (EDF 1119). Comparison to the scaffold-level genomes of the hydrozoans
Hydra magnipapillata and Clytia hemispherica (both are species with 15 chromosomes13,35) also
suggested numerous chromosomal rearrangements (EDF 9). Comparison to the genomic scaffolds of the
scyphozoan jellyfish Aurelia aurita demonstrates a higher level of macrosynteny conservation than in
hydrozoans, but the genome nevertheless looks significantly scrambled. This stands in stark contrast to
the genome of the jellyfish Rhopilema esculentum. In Rhopilema, recent Hi-C analysis suggested the
existence of 21 chromosomes, in line with the earlier analyses of chromosome spreads11,36. We observed
that all Rhopilema and Nematostella chromosomes show a clear 1-to-1, 1-to-2 or, in a single case, a 1-to-3
correspondence (Figure 5a).

We then compared the pseudo-chromosomes of Nematostella with that of a bilaterian, the
cephalochordate Branchiostoma floridae. Cephalochordates are early branching chordates lacking the
two rounds of whole-genome duplication and allotetraploidization suggested for vertebrates1,37, as
represented by their single Hox cluster25 (Figure 5a). Strikingly, the Branchiostoma pseudo-chromosomes
exhibit retained extensive macrosynteny from the bilaterian-cnidarian MRCA. The large-scale
macrosynteny retention detected in Branchiostoma becomes less obvious once we focus on more
recently branching bilaterian clades. Vertebrates such as the early branching teleost fish Lepisosteus
oculatus38 and humans showed additional translocation events from the MRCA (Fig. 5a). Among
protostomes, we observed that the lophotrochozoan Ram's horn worm Streplosbio benedicti39 and the
sea scallop Patinopecten yessoensis3, as well as the ecdysozoan millipede Trigoniulus
corallinus40, retained many macrosyntenic links (Fig. 5a).

Conversely, the horseshoe crab Carcinoscorpius rotundicauda41 retained linkage with limited specificity
whereas no apparent retention of chromosomal linkage could be detected in the case of Drosophila
melanogaster or Caenorhabditis elegans (EDF 10). Rapid intrachromosomal gene shuffling is a well-
known phenomenon among Drosophila species, however within the drosophilid clade, chromosomes are

 Page 7/32
retained on well-established linkage groups42, suggesting that these rearrangements occurred before the
divergence of the drosophilids. The high degree of macrosynteny conservation with Branchiostoma
motivated us to compare Nematostella pseudo-chromosomes to those of the representative of an even
older lineage, the Porifera (sponges), which branched off prior to the cnidarian-bilaterian split (EDF 1) and
is considered by many researchers to be the sister group to all other animals43,44. Strikingly, the
comparison with the recently assembled chromosomes of the sponge Ephydatia muelleri revealed many
ancestral linkage groups shared between them (Figure 5a).

Thus, the comparison of chromosome-level assemblies of Nematostella and Scolanthus with those of
other non-bilaterian and bilaterian representatives has revealed a stunning degree of macrosynteny
conservation and retention of ancestral linkage groups on most chromosomes in some species (e.g.
Rhopilema, Ephydatia, Branchiostoma), and varying degrees of gene shuffling, rearrangements, splits
and fusions of the chromosomes in others (e.g. Drosophila, Caenorhabditis, humans). The observed
patterns allowed us to reconstruct the set of predicted ancestral linkage groups for the MRCA of
cnidarians, bilaterians and metazoans (Fig. 5b). For the cnidarian ancestor, we identified 19 cnidarian
ALGs. These correspond well to the extant cnidarian chromosomes (EDF 9), however, while
Rhopilema and edwardsiid chromosomes appear highly representative of the ancestral cnidarian
karyotype, the soft coral Xenia chromosomes appear to have undergone many more chromosomal
translocation events from the hypothesized 19 ALGs of the cnidarian MRCA (EDF 9). Our results also
indicate that although both Hydrozoa and Edwardsiidae have a clear 15 chromosome karyotype, their
chromosomes originate from distinct fusions of cnidarian ALGs. We then inferred 17 ALGs for the
ancestor of Bilateria, as also previously posited4 (Fig. 5b,c). For the metazoan ancestor, our
reconstruction resulted in 16 metazoan ALGs, which were maintained in the MRCA of Cnidaria, Bilateria
and the sponge Ephydatia (Fig. 5b,c). In order to visualize how the chromosomes of extant species have
undergone major splits and fusions, we projected the reconstructed ALGs of the respective cnidarian,
bilaterian and metazoan ancestor to pseudo-chromosomes of the extant species. We found that many
ALGs seemingly correspond to the same chromosomes across multiple species and lineages (Fig. 5c;
EDF 9-11). To determine the extent of this, we further explored the relationships between the Metazoa
ALGs and the Cnidaria and Bilateria (Figure 5c). Remarkably, many ancestral chromosomes exhibited a 1-
to-1 correspondence across all predicted ancestral lineages (Figure 5c) and carry through to the extant
lineages (Figure 5d).

Discussion
The assembly of two high quality, chromosome-level edwardsiid genomes has illuminated several
intriguing aspects about chromosomal evolution, the NK and extended Hox clusters, the conservation of
non-coding elements and the status of topologically associated domains in the common ancestor to
cnidarians and bilaterians. In addition, the highly improved Nematostella genome and gene annotations

 Page 8/32
will prove to be an invaluable resource in future studies of both coding and non-coding regions, structural
variants among populations and continued development of functional tools for this model organism.

Nearly all members of the extended Hox cluster were distributed among distant, isolated microsyntenic
blocks on pseudo-chromosome 2 of Nematostella (pseudo-chromosome 4 in Scolanthus), with the single
exception of HoxF/Anthox1, located on pseudo-chromosome 5 (Figures 3,4; Supplementary Text). This
indicates a lack of proximity constraint on the Hox genes in Cnidaria, contrasting with the situation in
Bilateria. In addition, while a staggered spatiotemporal pattern of Hox expression along the secondary,
directive axis of the Nematostella larva and polyp can be observed45, unlike Bilateria, there is no
correlation between expression and cluster position46. Notably, HoxF/Anthox1 is not only located on a
different chromosome but it is also the only Hox gene expressed in the (aboral) ectoderm, while all other
Hox genes are expressed in the inner endomesodermal cell layer47,48.

The dispersed NK and extended Hox clusters may be due to the diminished or, possibly, lacking higher-
order chromosome organization at the level of microsynteny. In line with this, it was recently observed
that the HoxD cluster boundaries in the mouse genome are marked by TAD boundaries49, and the
cluster’s intra-TAD gene order is deemed to be under selective pressure50. The lack of a CTCF gene in the
Nematostella genome led us to hypothesize that the cnidarians might lack TADs, as TAD presence has
been attributed to the appearance of CTCF50. Moreover, CTCF is absent not only in cnidarians but also in
earlier branching ctenophores and sponges, which provides a possibility that the existence of TADs might
represent a bilaterian-specific feature. While we were unable to detect any noticeable structure resembling
the current definitions of TADs, it remains an open question as to whether larger or smaller structures,
beyond the resolution of our data, could yet be detected. To our knowledge, one study has suggested
evidence for the higher-order chromosomal organization in a non-bilaterian, the sponge Ephydatia43.
However, the contact maps resemble patterns we observe in our assemblies at the boundary of scaffolds
or contigs, which can be the result of differential mappability from repetitive content or assembly issues.
We therefore deliberately do not report any results from a TAD finder, since, after multiple rigorous rounds
of manual assembly update, we can assert that the data we have generated do not qualitatively represent
TAD boundaries per se, and most results would be likely false positives. While the precise definition of a
TAD is still evolving51,52, both data sets lack many characters of TADs identified in CTCF-containing
genomes: hierarchical compartments, mammalian-specific “corner peaks” indicating strong interactions,
and in our case, loop peaks and inter-contig compartments. This suggests that the presence of CTCF is
necessary for the formation of TADs, however, we still cannot exclude the possibility that performing the
experiment with a more homogenous cell population, or sequencing at a higher resolution, would reveal a
signal on a smaller scale.

 Page 9/32
While microsynteny analyses reveal little conservation of the local gene order in the genomes of
Nematostella and Scolanthus, macrosyntenic analysis of the edwardsiid chromosomes compared to
available cnidarian genomes revealed a high level of conservation. We identified a stable set of 19 ALGs
across all clades of sequenced cnidarian genomes. When compared to extant genomes, we can trace a
small number of recombination events from the ALGs since common cnidarian ancestor split an
estimated 580 Mya. This stands in stark contrast to the history of, for example, the 326 Mya old ancestral
genome of Amniota, which is estimated to have 49 distinct units, while the karyotypes of the extant
amniote taxa consist of multiple translocated segments and variable chromosomes53. However, by far
more remarkable is the macrosynteny maintained between the edwardsiids, the early branching chordate
Branchiostoma, and the sponge Ephydatia. Our analyses reveal clear one-to-one, one-to-few or few-to-one
conservation of the chromosome-level linkages between cnidarians, sponges and early chordates, which
suggests a striking retention of macrosyntenies throughout evolution of these animal lineages and
allows us to deduce a set of 16 ALGs of the last common metazoan ancestor, which was maintained in
the cnidarian-bilaterian ancestor and gave rise to the 19 ancestral cnidarian chromosomes and the 17
ancestral bilaterian chromosomes4. It is tempting to speculate that the emergence of the TADs in Bilateria
may have restricted local rearrangements and at the same time released the constraints on maintaining
the ancestral macrosyntenies conserved all the way back to the origin of multicellular animals.

Declarations
Acknowledgements

Special thanks to Oleg Simakov for extensive discussions and suggestions. We thank Matthew Nicotra
for providing us with the HMW DNA extraction protocol used for Scolanthus. We thank Robert Reischl for
the photo of Scolanthus and Patrick R.H. Steinmetz and Hanna Kraus for the photo of Nematostella
vectensis (Figure 1). Special thanks to Tatiana Lebedeva for the cartoon drawings of animals used in
this study. We are grateful to the Stowers Institute Molecular Biology Core facility, particularly Amanda
Lawlor, Michael Peterson and Anoja Perera. This work was supported by grants of the Austrian Science
Fund FWF (P24858; P21108) to U.T., support from the Stowers Institute for Medical Research to M.G. and
an NIH Ruth L. Kirschstein NRSA (F32 GM131522) to E.M.H.. We are also grateful for the support of the
CNRS Marine Station in Roscoff and the Assemble grant 227799 to U.T. for collecting Scolanthus.

Data Availability

All raw data is available via the National Center for Biotechnology Information under the accession
PRJNA667495. The assembled genomes can be downloaded, browsed and searched on publicly
available browsers at https://simrbase.stowers.org/starletseaanemone and
https://simrbase.stowers.org/wormanemone. Code used to generate the analyses is available from the
authors upon request.

 Page 10/32
Materials And Methods
Animal Care and Source

Nematostella vectensis animals were cultured as previously described 60 at the University of Vienna and
the Stowers Institute. Adult male and female individuals were verified by induction in isolation.
Scolanthus callimorphus animals were collected at the Île Callot, Carantec, France. After transport, they
were kept in seawater at 20°C and fed freshly hatched Artemia salina weekly or biweekly.

Sequencing

Short Read DNA-Seq

Genomic DNA samples were extracted from both adult male and female individual Nematostella adults
using the DNeasy Blood and Tissue Kit (Qiagen). After purification, approximately 5 ug of genomic DNA
was recovered from each sample. Following DNA extraction, samples were sheared and size selected for
~500 bp using a Blue Pippin Prep machine (Sage Science). Following size selection, sequencing libraries
were created using a KAPA HTP Library Prep kit (Roche) and subjected to paired-end sequencing on an
Illumina NextSeq 500. Scolanthus DNA samples for library preparation were aliquoted from high
molecular weight extractions, described below.

High Molecular Weight DNA Extraction and Library Prep

Nematostella high molecular weight DNA was extracted at Dovetail Genomics. Samples were quantified
using Qubit 2.0 Fluorometer (Life Technologies, Carlsbad, CA, USA). The PacBio SMRTbell library (~20kb)
for PacBio Sequel was constructed using SMRTbell Template Prep Kit 1.0 (PacBio, Menlo Park, CA, USA)
using the manufacturer recommended protocol. The pooled library was bound to polymerase using the
Sequel Binding Kit 2.0 (PacBio) and loaded onto PacBio Sequel using the MagBead Kit V2 (PacBio).
Sequencing was performed on the PacBio Sequel SMRT cell, using Instrument Control Software Version
5.0.0.6235, Primary analysis software Version 5.0.0.6236 and SMRT Link Version 5.0.0.6792.

High molecular weight DNA from a single Scolanthus callimorphus adult animal was extracted using a
modified Urea-based DNA extraction protocol61,62. A whole animal was flash frozen and ground with
mortar and pestle. While frozen, drops of buffer UEB1 (7M Urea, 312.5 mM NaCl, 50 mM Tris-HCl pH 8, 20
mM EDTA pH 8.1% w:v N-Lauroylsarcosine sodium salt) were added and crushed with the tissue. Tissue
was incubated in a final volume of 10 mL UEB1 at RT for 10 minutes. Three rounds of phenol-chloroform
extraction were performed followed by DNA precipitation by addition of 0.7 volume isopropanol. The

 Page 11/32
pellet was transferred to a fresh tube and washed twice in 70% EtOH and twice more in 100% EtOH, dried,
and resuspended in TE buffer.

A library for PacBio sequencing was then prepared from the high molecular weight sample using the
SMRTbell® Express Template Prep Kit v1. The libraries were then sequenced on a PacBio Sequel
machine over 3 SMRT Cells, yielding a total of 22.85 Gb over 1,474,285 subreads. An aliquot of the same
sample was used to prepare a library using the NEBNext® Ultra™ II DNA Library Prep Kit for Illumina. This
was then subjected to 50 cycles of single-end sequencing in one flow cell lane using an Illumina HiSeq
2500 system.

Chicago libraries

2 Chicago libraries were prepared as described previously63. For each library, ~500 ng of HMW gDNA
(mean fragment length = 100 kbp) was reconstituted into chromatin in vitro and fixed with formaldehyde.
Fixed chromatin was digested with DpnII, the 5’ overhangs filled in with biotinylated nucleotides, and then
free blunt ends were ligated. After ligation, crosslinks were reversed and the DNA purified from protein.
Purified DNA was treated to remove biotin that was not internal to ligated fragments. The DNA was then
sheared to ~350 bp mean fragment size and sequencing libraries were generated using NEBNext Ultra
enzymes and Illumina-compatible adapters. Biotin-containing fragments were isolated using streptavidin
beads before PCR enrichment of each library. The libraries were sequenced on an Illumina HiSeq 2500
(rapid run mode). The number and length of read pairs produced for each library was: 116 million, 2x101
bp for library 1; 35 million, 2x101 bp for library 2. Together, these Chicago library reads provided 125 x
sequence coverage of the genome (1-100 kb pairs).

Chromatin was extracted from a single Nematostella vectensis adult male and Scolanthus
callimorphus adult (unknown sex) nuclei using the Phase Genomics Proximo Hi-C animal protocol. After
proximity ligation and purification, 16 ng and 9 ng of DNA was recovered, respectively. For library
preparation 1 µl of Library Reagent 1 was added 12 PCR cycles were performed. The final library was
subjected to 150 total cycles of paired-end sequencing using an Illumina NextSeq 550 machine yielding a
total of 13.5 gigabases.

Hi-C sequencing, Scolanthus callimorphus PacBio library preparation and sequencing, Scolanthus
Illumina DNA library preparation and sequencing and adult Nematostella vectensis RNA library
preparation and sequencing was performed at the VBCF NGS Unit
(https://www.viennabiocenter.org/facilities). Nematostella vectensis DNA size selection, library
 Page 12/32
preparation, and sequencing were performed by the Molecular Biology Core at the Stowers Institute for
Medical Research.

Developmental and adult Nematostella RNA sequencing was performed as follows. Nematostella were
spawned and eggs were de-jellied and fertilized as previously described 60. Spawning and embryo
development took place at 18°C. Eggs and embryos from different stages were collected (300 per
sample) in duplicate as indicated: eggs (within 30min of spawn), blastula (7.5hpf), gastrula (23.5hpf)
and planula (72hpf). Eggs and embryos were collected in eppendorf tubes and centrifuged to a pellet at
21,000 x g for 1 min. All seawater was quickly removed and pellets were resuspended in 150ml lysis
buffer (RLT buffer supplied by the Qiagen RNeasy kit (#74104), supplemented with -mercaptoethanol).
The samples were homogenized with an electric pestle (1 min continuous drilling) and further
supplemented with 200 ml of the above lysis buffer. Homogenized samples were then transferred into
QIAshredder columns (Qiagen #79654) and centrifuged at 21,000 x g for 2 min. The flow throughs were
supplemented with 1 ml 70 % ethanol and transferred to RNeasy columns and were processed according
to the Qiagen RNeasy protocol. Quality and integrity of the RNA was evaluated using the Agilent RNA 600
pico kit (Agilent Technologies) and RNA samples were stored at -80°C until further processing. cDNA
libraries were then constructed for polyA stranded sequencing. The resulting libraries were sequenced on
Illumina HiSeq using paired end runs (RapidSeq- 2x150bp).

Genome Assembly

Size estimates for Nematostella vectensis and Scolanthus callimorphus were derived using
Genomescope64, taking the result of the highest k (56 and 18) which converged under the model.

Initial assemblies based on PacBio sequencing of Nematostella and Scolanthus were generated using
canu version 1.865 with the parameters rawErrorRate=0.3 correctedErrorRate=0.045.

Nematostella haplotigs were removed using Purge Haplotigs66. First, the source PacBio reads were
aligned onto the canu assembly using minimap267 using the parameters -ax map-pb --secondary=no.
Following this a coverage histogram was generated using the Purge Haplotigs script readhist. Per the
documented Purge Haplotigs protocol, lower, mid and high coverage limits were found by manual
inspection of the plotted histogram to be 12, 57 and 130 respectively. All initial contigs marked as
suspect or artifactual were removed from further analysis with the Purge Haplotigs script purge.

 Page 13/32
Due to lower sequencing coverage of Scolanthus, diploid per-scaffold coverage could not be deconvolved
from haploid, and therefore Purge Haplotigs could not be used. Removal of redundant contigs was
performed with Redundans version 0.14a68 using the parameters --noscaffolding --nogapclosing --overlap
0.66. Only contigs marked in the reduced version of the genome were used in further analysis.

The input de novo assembly, shotgun reads, and Chicago library reads were used as input data for HiRise, a
software pipeline designed specifically for using proximity ligation data to scaffold genome assemblie63.
Shotgun and Chicago library sequences were aligned to the draft input assembly using a modified SNAP
read mapper (http://snap.cs.berkeley.edu). The separations of Chicago read pairs mapped within draft
scaffolds were analyzed by HiRise to produce a likelihood model for genomic distance between read pairs,
and the model was used to identify and break putative misjoins, to score prospective joins, and make joins
above a threshold. After scaffolding, shotgun sequences were used to close gaps between contigs.

Repetitive DNA and Hi-C scaffolding

Repetitive DNA was found using two strategies. First, known repeats found in repbase69 were searched in
the assemblies using RepeatMasker70 using the parameters -s -align -e ncbi in addition to -species
nematostella for Nematostella and -species edwardsiidae for Scolanthus. Second, novel repeat
sequences were found using RepeatModeler version 2.071. After generating the repeat library, genomes’
repeat regions were detected with the corresponding library using the same parameters in RepeatMasker.

Hi-C sequences were aligned to the reduced and repbase masked genomes of Nematostella and
Scolanthus using bwa mem72,73 using the parameters -5SP. For Nematostella, an additional candidate
assembly was generated by mapping Hi-C sequences to the Chicago library scaffolded sequences using
repbase masking (dovetail_standardmask) in addition to the contig-based scaffolding
(contig_standardmask). Duplicate reads were marked with the samblaster utility74, and duplicate,
secondary and supplementary mappings were removed with samtools. These mappings were used to
generate initial chromosomal assemblies using Lachesis75, specifying the restriction site GATC.
Assemblies were manually reviewed using Juicebox Assembly Tools version 1.11.0876. Candidate
assemblies were compared using the nucmer aligner with default parameters and visualized using
mummerplot77. Assemblies were converted over to Juicebox format using juicebox_scripts
(https://github.com/phasegenomics/juicebox_scripts). In the case of Scolanthus, duplicate regions were
clipped, and the resulting contigs were subjected to another round of alignment, assembly and review.

 Page 14/32
Nematostella scaffold correctness was assessed using REAPR78. Nematostella assembly nemVec1 was
downloaded from the JGI website9. Sequences from the adult male and adult female (see Sequencing)
were aligned to nemVec1 and the Nematostella genome after scaffolding with Chicago libraries using
SMALT as well as the REAPR tool perfectmap using an expected insert size of 400, as determined from
fragment analysis. Error-free bases and contiguity after breaking the genome were extracted from the
results.

Genome and gene model set assembly and completeness was assessed using BUSCO version 3.0.279,
using the gene set metazoa_odb9 as the standard.

Gene Models

Nematostella, Scolanthus and M. senile paired end sequences obtained from a previous studies23,24 and
data available on BioProject PRJNA430035 were used to generate de novo assembled transcripts.

Trinity version 5.0.280 was run on each library using the flags --min_contig_length 200 --min_kmer_cov 2.
For those which had a strand-specific library preparation, the flag --SS_lib_type RF was applied. To reduce
redundancy, cd-hit version 4.6.881,82 was applied with the flags -M 0 -c 1. Transdecoder version 5.0.683
was used to detect open reading frames in the resulting reduced set of transcripts. Transcript abundance
was quantified using salmon version 1.2.184 using the flags --seqBias --useVBOpt --discardOrphansQuasi
--softclip.

For PacBio Iso-seq, 12 Nematostella RNA samples were collected over the course of multiple
developmental stages, adult tissues and regeneration time points. For developmental stages, zygotes
spawned by a single batch of wildtype colony were kept at 22°C, and collected at 0 hpf, 24 hpf, 48 hpf, 72
hpf and 7 dpf. Adult tissues were collected from sex-sorted, sexually mature wildtype individuals kept at
22°C. The male and female mesenteries were harvested separately by surgically opening the body
column and carefully peeling off the attached body column tissues. Adult oral discs were collected by
surgical removal of tentacles as well as the attached pharyngeal regions. Regeneration was induced by
amputating the oral part of a sexually mature individual at the mid-pharyngeal level. Regenerating tissues
close to the wound were collected at 4 hpa and 12 hpa, respectively. All the samples were deep frozen
and lysed using TRIzolTM reagent (Invitrogen). Phenol-chloroform extraction was performed to remove
undissolved mesoglea from adult tissues. DirectzolTM RNA Miniprep Plus Kit (Zymo) was then used to

 Page 15/32
purify total RNA from the aqueous phase. For each sample, 2 μg of total RNA with RIN > 7 was submitted
to UC Berkeley for Iso-seq library construction.

RNA Libraries were sequenced at UC Berkeley using PacBio Sequel-II system. Raw subreads bams were
processed and demultiplexed using PacBio’s isoseq v3.2 conda pipeline. The steps include consensus
generation, primer demultiplexing, polyA refinement and data clustering using default parameters. This
resulted in the generation of 406,317 high quality HIFI reads and used to build Nvec200 transcriptome.

HIFI reads were mapped to the Nematostella genome using minimap267 using parameters (-ax splice -uf -
-secondary=no) to obtain the primary best alignments. Reads were then grouped and collapsed down to
potential transcripts using PacBio’s cDNA_Cupcake toolkit and TAMA85. Based on PacBio’s guideline,
transcripts with degraded 5’ reads and have less than 10 FL counts were removed. Chimeric transcripts
were then analyzed to find potential fusion genes. For reads that didn’t map to the genome, de novo
transcriptome assembly was performed using graph-based tool Cogent with kmer size equals 30. .
Cupcake and TAMA results were merged into non-redundant gene models using stringtie v286. Deep RNA-
seq reads from 4 developmental stages: egg, gastrula, pos-gastrula and planula were aligned to the
genome using STAR v 2.7.3a87. Read alignments outside of the isoseq gene models were extracted with
bedtools v2.29.2 [96] and used for reference-guided transcriptome assembly using Stringtie2. Final gene
models were obtained by merging Isoseq models and RNAseq models and manually corrected using
previously cloned full length CDS from Nematostella vectensis in NCBI (EDT 7). Finally, transdecoder
v5.5.0 was used to produce CDS annotation using a minimum protein length of 50 amino acids and
prioritizing ORFs with significant similarity to any family in the PFAM database89. Alignment of the
protein candidates to the PFAM database was done using Hmmer v3.1b290. RNAseq libraries from the N.
vectensis developmental time series were downloaded and aligned to the new genome using STAR
v2.7.3a87 with standard parameters. Mapping and assignment efficiency was measured using
featureCounts from the subread package91 with the “-p” flag for paired-end libraries.

Evidence for Scolanthus gene models were taken from RNA-sequencing and repeats. Scolanthus RNA-seq
reads (see Sequencing) were mapped to the Scolanthus contigs using STAR version 2.7.3a87. These
mappings were used as evidence for intron junctions to generate putative gene models and estimating
hidden Markov model parameters using BRAKER292,93. Gene models were then refined using Augustus
version 3.3.394 using extrinsic evidence from STAR splice junctions and the location of repeats from
RepBase (see Genome Assembly) as counter-evidence for transcription. These models were filtered with
the following criteria: 1) genes completely covered by RepeatModeler repeats (see Genome Assembly)
were removed 2) predicted gene models were required to be either supported by external RNA-seq

 Page 16/32
evidence as reported by Augustus or have a predicted ortholog as reported by Eggnog-mapper95. This
resulted in a set of 24,625 gene models. Transcription factor identity was inferred by aligning the
predicted protein sequences to Pfam A domains version 32.096 using hmmer version 3.397. Transcription
factor families were based on domains curated in a previous work98.

Extended Hox cluster, NK cluster and ParaHox genes were found with BLAT 99 matches of published
models28,47,100–105 to the nv1 genome, taking the best hits. If an NVE gene model24 corresponded to the
matched genomic region, its location in the nv2 genome was then determined for macrosynteny analysis.
In cases where no published gene was known, reciprocal BLAST hits between the bilaterian and cnidarian
counterpart were taken as evidence for orthology.

Divergence Estimates

Single copy orthologs were detected by collecting common complete and duplicated BUSCO genes
present in the Scolanthus and Nematostella genomes. Where duplicated BUSCOs were present, the
transcript with the highest score was taken. This resulted in a total of 541 orthologs. BUSCOs found in
genomes obtained from previous studies1,11–13,17,18,22,38,43,106–109 were used to generate multiple
alignments. Genes were aligned with mafft version 7.427 using the E-INS-i model and a maximum 1000
refinement iterations35. Alignments were trimmed using trimAl version 1.4.rev15 using the “gappyout”
criteria35. A maximum likelihood tree was inferred using iqtree version 2.0.6, using the model finder
partitioned on each gene, constrained to nuclear protein models110. Divergence estimates were
determined using r8s version 1.8.1 using the Langley-Fitch likelihood method111. Age ranges were
estimated by fixing the split between Bilateria and Cnidaria at 595.7 and 688.3 Mya112.

Single copy orthologs were detected by collecting common complete BUSCO genes present in the A.
millepora, A. digitifera, E. pallida, M. senile, Scolanthus and Nematostella genomes. This resulted in a
total of 229 orthologs.

Ultraconserved Elements

In order to determine noncoding elements conserved between Scolanthus and Nematostella, genomes
repeat-masked from both de novo and repbase repeats were blasted using NCBI+ version 2.10.0113, using
the flags -evalue 1E-10 -max_hsps 100000000 -max_target_seqs 100000000 -task megablast -
perc_identity 0 -template_length 16 -penalty -2 -word_size 11 -template_type coding_and_optimal.

 Page 17/32
Additionally, the -dbsize parameter was set to the estimated genome size. Candidate hits were then
filtered using criteria loosely based on previous work 114: for each high-scoring pair, a sliding window
method was used to determine subsections of the alignment with at least 95 % identity, and extending
these windows as long as the identity remains at this level. Nematostella elements mapping to more than
one locus in the Scolanthus genome were reduced to the longest locus pair in both genomes. Elements
mostly mapping to coding sequence were removed, and the remaining elements were classified as intron
or non-coding, depending on location. Recurring UCE sequences that were not identified by
RepeatModeler or RepeatMasker were detected with blastclust version 2.2.26 requiring the length of hit to
cover at least 90 % of either sequence for linkage.

Macrosynteny Analysis

Branchiostoma floridae gene models and sequences were retrieved from the recently published study1.
Gene orthology between Scolanthus, Nematostella and Branchiostoma were determined pairwise using
reciprocal best matches. All against all comparisons were performed with NCBI+ blastp version 2.10.0113
using an e-value threshold of 1e-5. Reciprocal best matches were determined using match bit scores.
Genomes were downloaded from previous studies3,10,12,13,17,22,38–41,43,55,106,108,109,115–117.

Ancestral genome reconstruction was carried out using a graph based approach. In brief, genes were
summarized into multi-species orthologous groups, and these comprised the nodes, and orthology
groups occurring on the same chromosome or scaffold of two different species were linked together. A
consensus approach to community detection based on the Leiden algorithm118 was used to determine
ancestral linkage groups from this graph. For details, see the Supplementary Text.

References
1. Simakov, O. et al. Deeply conserved synteny resolves early events in vertebrate evolution. Nature
Ecology & Evolution 4, 820–830 (2020).

2. Putnam, N. H. et al. The amphioxus genome and the evolution of the chordate
karyotype. Nature 453, 1064–1071 (2008).

3. Wang, S. et al. Scallop genome provides insights into evolution of bilaterian karyotype and
development. Nature Ecology & Evolution 1, 1–12 (2017).

4. Simakov, O. et al. Insights into bilaterian evolution from three spiralian genomes. Nature 493, 526–
531 (2013).

 Page 18/32
5. Cartwright, P. et al. Exceptionally Preserved Jellyfishes from the Middle Cambrian. PLOS ONE 2,
e1121 (2007).

6. Technau, U., Genikhovich, G. & Kraus, J. E. M. Cnidaria. in Evolutionary Developmental Biology of
Invertebrates 1 (ed. Wanninger, A.) 115–163 (Springer Vienna, 2015). doi:10.1007/978-3-7091-1862-7_6.

7. Zapata, F. et al. Phylogenomic Analyses Support Traditional Relationships within Cnidaria. PLOS
ONE 10, e0139068 (2015).

8. Technau, U. & Steele, R. E. Evolutionary crossroads in developmental biology:
Cnidaria. Development 138, 1447–1458 (2011).

9. Putnam, N. H. et al. Sea Anemone Genome Reveals Ancestral Eumetazoan Gene Repertoire and
Genomic Organization. Science 317, 86–94 (2007).

10. Hu, M., Zheng, X., Fan, C.-M. & Zheng, Y. Lineage dynamics of the endosymbiotic cell type in the soft
coral Xenia. Nature 582, 534–538 (2020).

11. Nong, W. et al. Jellyfish genomes reveal distinct homeobox gene clusters and conservation of small
RNA processing. Nature Communications 11, 3051 (2020).

12. Chapman, J. A. et al. The dynamic genome of Hydra. Nature 464, 592–596 (2010).

13. Leclère, L. et al. The genome of the jellyfish Clytia hemisphaerica and the evolution of the cnidarian
life-cycle. Nat Ecol Evol 3, 801–810 (2019).

14. Khalturin, K. et al. Medusozoan genomes inform the evolution of the jellyfish body plan. Nature
Ecology & Evolution 3, 811–822 (2019).

15. Ohdera, A. et al. Box, stalked, and upside-down? Draft genomes from diverse jellyfish (Cnidaria,
Acraspeda) lineages: Alatina alata (Cubozoa), Calvadosia cruxmelitensis (Staurozoa), and Cassiopea
xamachana (Scyphozoa). Gigascience 8, (2019).

16. Kim, H.-M. et al. The genome of the giant Nomura’s jellyfish sheds light on the early evolution of
active predation. BMC Biology 17, 28 (2019).

17. Gold, D. A. et al. The genome of the jellyfish Aurelia and the evolution of animal complexity. Nature
Ecology & Evolution 3, 96 (2019).

18. Shinzato, C. et al. Using the Acropora digitifera genome to understand coral responses to
environmental change. Nature 476, 320–323 (2011).

19. Wilson, T. J., Lazner, F., Kola, I. & Hertzog, P. J. The Mouse and the Genomic Era. in Comparative
Genomics (ed. Clark, M. S.) 97–121 (Springer US, 2000). doi:10.1007/978-1-4615-4657-3_5.

 Page 19/32
20. Gosse, P. Scolanthus callimorphus. in World List of Actiniaria, accessed through : World Register of
Marine Species. (2020).

21. Wilson, E. Scolanthus callimorphus Worm anemone. in Marine Life Information Network: Biology
and Sensitivity Key Information Reviews, [on-line] (2005).

22. Baumgarten, S. et al. The genome of Aiptasia, a sea anemone model for coral symbiosis. Proc. Natl.
Acad. Sci. U.S.A. 112, 11893–11898 (2015).

23. Praher, D. et al. Conservation and turnover of miRNAs and their highly complementary targets in
early branching animals. Proceedings of the Royal Society B: Biological Sciences 288, 20203169 (2021).

24. Fredman, D., Schwaiger, M., Rentzsch, F. & Technau, U. Nematostella vectensis transcriptome and
gene models v2.0. (2013) doi:10.6084/m9.figshare.807696.v1.

25. Pollard, S. L. & Holland, P. W. H. Evidence for 14 homeobox gene clusters in human genome
ancestry. Current Biology 10, 1059–1062 (2000).

26. Butts, T., Holland, P. W. H. & Ferrier, D. E. K. The Urbilaterian Super-Hox cluster. Trends in Genetics 24,
259–262 (2008).

27. Ferrier, D. E. K. Evolution of Homeobox Gene Clusters in Animals: The Giga-Cluster and Primary vs.
Secondary Clustering. Frontiers in Ecology and Evolution 4, (2016).

28. Chourrout, D. et al. Minimal ProtoHox cluster inferred from bilaterian and cnidarian Hox
complements. Nature 442, 684–687 (2006).

29. Simakov, O. et al. Hemichordate genomes and deuterostome origins. Nature 527, 459–465 (2015).

30. Larroux, C. et al. The NK Homeobox Gene Cluster Predates the Origin of Hox Genes. Current
Biology 17, 706–710 (2007).

31. Friedman, N. & Rando, O. J. Epigenomics and the structure of the living genome. Genome Res 25,
1482–1490 (2015).

32. Heger, P., Marin, B., Bartkuhn, M., Schierenberg, E. & Wiehe, T. The chromatin insulator CTCF and the
emergence of metazoan diversity. PNAS 109, 17507–17512 (2012).

33. Schwaiger, M. et al. Evolutionary conservation of the eumetazoan gene regulatory
landscape. Genome Research 24, 639–650 (2014).

34. Sieber, K. B. et al. Integrated Functional Genomic Analysis Enables Annotation of Kidney Genome-
Wide Association Study Loci. JASN 30, 421–441 (2019).

 Page 20/32
35. Zacharias, H., Anokhin, B., Khalturin, K. & Bosch, T. C. G. Genome sizes and chromosomes in the
basal metazoan Hydra. Zoology 107, 219–227 (2004).

36. Li, Y. et al. Chromosome-level reference genome of the jellyfish Rhopilema
esculentum. Gigascience 9, (2020).

37. Dehal, P. & Boore, J. L. Two Rounds of Whole Genome Duplication in the Ancestral Vertebrate. PLOS
Biology 3, e314 (2005).

38. Braasch, I. et al. The spotted gar genome illuminates vertebrate evolution and facilitates human-
teleost comparisons. Nature Genetics 48, 427–437 (2016).

39. Zakas, C., Harry, N. D., Scholl, E. H. & Rockman, M. V. The genome of the poecilogonous annelid
Streblospio benedicti. bioRxiv 2021.04.15.440069 (2021) doi:10.1101/2021.04.15.440069.

40. Qu, Z. et al. Millipede genomes reveal unique adaptations during myriapod evolution. PLOS
Biology 18, e3000636 (2020).

41. Shingate, P. et al. Chromosome-level assembly of the horseshoe crab genome provides insights into
its genome evolution. Nature Communications 11, 2322 (2020).

42. Ranz, J. M. et al. Principles of Genome Evolution in the Drosophila melanogaster Species
Group. PLOS Biology 5, e152 (2007).

43. Kenny, N. J. et al. Tracing animal genomic evolution with the chromosomal-level assembly of the
freshwater sponge Ephydatia muelleri. Nature Communications 11, 3676 (2020).

44. Kapli, P. & Telford, M. J. Topology-dependent asymmetry in systematic errors affects phylogenetic
placement of Ctenophora and Xenacoelomorpha. Science Advances 6, eabc5162 (2020).

45. He, S. et al. An axial Hox code controls tissue segmentation and body patterning in Nematostella
vectensis. Science 361, 1377–1380 (2018).

46. McGinnis, W. & Krumlauf, R. Homeobox genes and axial patterning. Cell 68, 283–302 (1992).

47. Ryan, J. F. et al. Pre-Bilaterian Origins of the Hox Cluster and the Hox Code: Evidence from the Sea
Anemone, Nematostella vectensis. PLoS ONE 2, e153 (2007).

48. Finnerty, J. R., Pang, K., Burton, P., Paulson, D. & Martindale, M. Q. Origins of Bilateral Symmetry: Hox
and Dpp Expression in a Sea Anemone. Science 304, 1335–1337 (2004).

49. Rodríguez-Carballo, E. et al. The HoxD cluster is a dynamic and resilient TAD boundary controlling
the segregation of antagonistic regulatory landscapes. Genes Dev 31, 2264–2281 (2017).

 Page 21/32
50. Lazar, N. H. et al. Epigenetic maintenance of topological domains in the highly rearranged gibbon
genome. Genome Res. 28, 983–997 (2018).

51. Rowley, M. J. & Corces, V. G. Organizational principles of 3D genome architecture. Nature Reviews
Genetics 19, 789–800 (2018).

52. Szabo, Q., Bantignies, F. & Cavalli, G. Principles of genome folding into topologically associating
domains. Science Advances 5, eaaw1668 (2019).

53. Sacerdot, C., Louis, A., Bon, C., Berthelot, C. & Roest Crollius, H. Chromosome evolution at the origin
of the ancestral vertebrate genome. Genome Biology 19, 166 (2018).

54. Voolstra, C. R. et al. Comparative analysis of the genomes of Stylophora pistillata and Acropora
digitifera provides evidence for extensive differences between species of corals. Sci Rep 7, 1–14 (2017).

55. Moya, A. et al. Whole transcriptome analysis of the coral Acropora millepora reveals complex
responses to CO₂-driven acidification during the initiation of calcification. Mol. Ecol. 21, 2440–2454
(2012).

56. Cunning, R., Bay, R. A., Gillette, P., Baker, A. C. & Traylor-Knowles, N. Comparative analysis of the
Pocillopora damicornis genome highlights role of immune system in coral evolution. Scientific Reports 8,
16134 (2018).

57. Jiang, J. B. et al. A hybrid de novo assembly of the sea pansy (Renilla muelleri)
genome. Gigascience 8, (2019).

58. Jeon, Y. et al. The Draft Genome of an Octocoral, Dendronephthya gigantea. Genome Biol Evol 11,
949–953 (2019).

59. Marlétaz, F. et al. Amphioxus functional genomics and the origins of vertebrate gene
regulation. Nature 564, 64–70 (2018).

60. Fritzenwanker, J. H. & Technau, U. Induction of gametogenesis in the basal cnidarian Nematostella
vectensis (Anthozoa). Development Genes and Evolution 212, 99–103 (2002).

61. Chen, J. & Dellaporta, S. Urea-based Plant DNA Miniprep. in The Maize Handbook (eds. Freeling, M.
& Walbot, V.) 526–527 (Springer, 1994). doi:10.1007/978-1-4612-2694-9_85.

62. Sanders, S. M. et al. CRISPR/Cas9-mediated gene knockin in the hydroid Hydractinia
symbiolongicarpus. BMC Genomics 19, 649 (2018).

63. Putnam, N. H. et al. Chromosome-scale shotgun assembly using an in vitro method for long-range
linkage. Genome Res. 26, 342–350 (2016).

 Page 22/32
64. Vurture, G. W. et al. GenomeScope: fast reference-free genome profiling from short
reads. Bioinformatics 33, 2202–2204 (2017).

65. Koren, S. et al. Canu: scalable and accurate long-read assembly via adaptive k -mer weighting and
repeat separation. Genome Research 27, 722–736 (2017).

66. Roach, M. J., Schmidt, S. A. & Borneman, A. R. Purge Haplotigs: allelic contig reassignment for third-
gen diploid genome assemblies. BMC Bioinformatics 19, 460 (2018).

67. Li, H. Minimap2: pairwise alignment for nucleotide sequences. Bioinformatics 34, 3094–3100
(2018).

68. Pryszcz, L. P. & Gabaldón, T. Redundans: an assembly pipeline for highly heterozygous
genomes. Nucleic Acids Res 44, e113–e113 (2016).

69. Bao, W., Kojima, K. K. & Kohany, O. Repbase Update, a database of repetitive elements in eukaryotic
genomes. Mobile DNA 6, 11 (2015).

70. Smit, A., Hubley, R. & Green, P. RepeatMasker Open-4.0. (2013).

71. Flynn, J. M. et al. RepeatModeler2 for automated genomic discovery of transposable element
families. PNAS 117, 9451–9457 (2020).

72. Li, H. Aligning sequence reads, clone sequences and assembly contigs with BWA-
MEM. arXiv:1303.3997 [q-bio] (2013).

73. Li, H. & Durbin, R. Fast and accurate short read alignment with Burrows–Wheeler
transform. Bioinformatics 25, 1754–1760 (2009).

74. Faust, G. G. & Hall, I. M. SAMBLASTER: fast duplicate marking and structural variant read
extraction. Bioinformatics 30, 2503–2505 (2014).

75. Burton, J. N. et al. Chromosome-scale scaffolding of de novo genome assemblies based on
chromatin interactions. Nature Biotechnology 31, 1119–1125 (2013).

76. Durand, N. C. et al. Juicebox Provides a Visualization System for Hi-C Contact Maps with Unlimited
Zoom. Cell Systems 3, 99–101 (2016).

77. Kurtz, S. et al. Versatile and open software for comparing large genomes. Genome Biology 9 (2004).

78. Hunt, M. et al. REAPR: a universal tool for genome assembly evaluation. Genome Biology 14, R47
(2013).

79. Seppey, M., Manni, M. & Zdobnov, E. M. BUSCO: Assessing Genome Assembly and Annotation
Completeness. in Gene Prediction: Methods and Protocols (ed. Kollmar, M.) 227–245 (Springer, 2019).
 Page 23/32
You can also read