Phytoplankton consortia as a blueprint for mutually beneficial eukaryote bacteria ecosystems based on the biocoenosis of Botryococcus consortia ...
←
→
Page content transcription
If your browser does not render page correctly, please read the page content below
www.nature.com/scientificreports
OPEN Phytoplankton consortia
as a blueprint for mutually
beneficial eukaryote‑bacteria
ecosystems based
on the biocoenosis of Botryococcus
consortia
Olga Blifernez‑Klassen1,2*, Viktor Klassen1,2, Daniel Wibberg2, Enis Cebeci1,
Christian Henke2,3, Christian Rückert2, Swapnil Chaudhari1,2, Oliver Rupp4, Jochen Blom4,
Anika Winkler2, Arwa Al‑Dilaimi2, Alexander Goesmann4, Alexander Sczyrba2,3,
Jörn Kalinowski2, Andrea Bräutigam2,5 & Olaf Kruse1,2*
Bacteria occupy all major ecosystems and maintain an intensive relationship to the eukaryotes,
developing together into complex biomes (i.e., phycosphere and rhizosphere). Interactions between
eukaryotes and bacteria range from cooperative to competitive, with the associated microorganisms
affecting their host`s development, growth and health. Since the advent of non-culture dependent
analytical techniques such as metagenome sequencing, consortia have been described at the
phylogenetic level but rarely functionally. Multifaceted analysis of the microbial consortium of the
ancient phytoplankton Botryococcus as an attractive model food web revealed that its all abundant
bacterial members belong to a niche of biotin auxotrophs, essentially depending on the microalga.
In addition, hydrocarbonoclastic bacteria without vitamin auxotrophies seem adversely to affect
the algal cell morphology. Synthetic rearrangement of a minimal community consisting of an alga,
a mutualistic and a parasitic bacteria underpins the model of a eukaryote that maintains its own
mutualistic microbial community to control its surrounding biosphere. This model of coexistence,
potentially useful for defense against invaders by a eukaryotic host could represent ecologically
relevant interactions that cross species boundaries. Metabolic and system reconstruction is an
opportunity to unravel the relationships within the consortia and provide a blueprint for the
construction of mutually beneficial synthetic ecosystems.
Bacteria are omnipresent and affect likely every eukaryotic system through their p resence1. Microalgae are the
dominant primary producers and the base of the food web within aquatic ecosystems and sustain in the natural
environment in close relationship with multiple associated m icroorganisms2,3. Thus, the interactions between
phytoplankton and bacteria represent a fundamental ecological relationship within aquatic environments2, by
controlling nutrient cycling and biomass production at the food web base. The nature of the exchange of micro-
and macronutrients, diverse metabolites including complex products such as polysaccharides, and infochemicals
defines the relationship of the symbiotic partners4–6, which span mutualism, commensalism and parasitism3.
Within a parasitic association, the bacteria are known to adversely affect the algae7, while in commensalism
1
Algae Biotechnology and Bioenergy, Faculty of Biology, Bielefeld University, Universitätsstrasse 27,
33615 Bielefeld, Germany. 2Center for Biotechnology (CeBiTec), Bielefeld University, Universitätsstrasse
27, 33615 Bielefeld, Germany. 3Computational Metagenomics, Faculty of Technology, Bielefeld University,
Universitätsstrasse 25, 33615 Bielefeld, Germany. 4Bioinformatics and Systems Biology, Justus-Liebig-University,
Heinrich‑Buff‑Ring 58, 35392 Gießen, Germany. 5Computational Biology, Faculty of Biology, Bielefeld University,
Universitätsstrasse 27, 33615 Bielefeld, Germany. *email: olga.blifernez@uni‑bielefeld.de; olaf.kruse@
uni‑bielefeld.de
Scientific Reports | (2021) 11:1726 | https://doi.org/10.1038/s41598-021-81082-1 1
Vol.:(0123456789)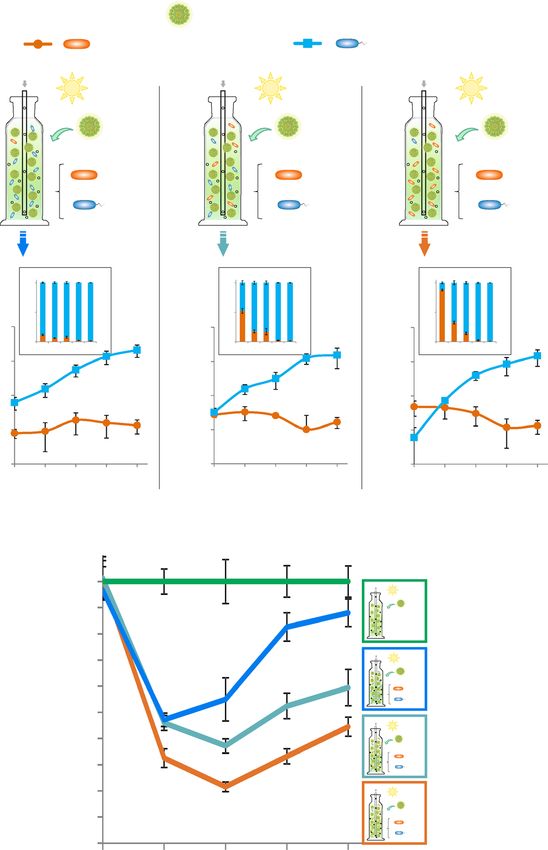
www.nature.com/scientificreports/
the partners can survive independently, with the commensal feeding on algae-provided substrates, but without
harming the h ost3. Mutualistic interactions include i.a. the obligate relationships between vitamin-synthesizing
bacteria and vitamin-auxotrophic phytoplankton s pecies8. Many microalgae cannot synthesize several growth-
essential vitamins (like B 12 and B1)8–10 and obtain them through a symbiotic relationship with bacteria in exchange
11
for organic c arbon . Recent observations suggest that not only certain microalgae require vitamins, but many
bacteria also have to compete with other organisms for the B-vitamins12,13.
However, in microbial environments, where the distinction between host and symbionts is less clear, the
identification of the associated partners and the nature of their relationship is challenging. Looking for a suitable
model food web system to elucidate the complexity of eukaryote-prokaryote interactions, we focused on the
microalga-bacteria consortia with an organic carbon-rich phycosphere. The planktonic chlorophyta Botryococ-
cus braunii excretes long-chain hydrocarbons and a variety of exo-polysaccharides14 which allows this single
celled alga to form large a gglomerates1. Both organic carbon-based products are exposed to the surrounding
ecosystem and enable the alga to sustain in the natural environment (phycosphere) in close relationship with
multiple associated m icroorganisms2,3. Botryococcus exudes up to 46% of their photosynthetically fixed carbon
hycosphere15, similarly to processes, however with lesser extent, observed for seedlings as well as adult
into the p
plants within the rhizosphere in the form of poorly characterized rhizodeposits16–18. Additionally, it is generally
considered that a progenitor of Botryococcus impacted the development of today’s oil reserves and coal shale
deposits19. Thus, the microbiome associated with Botryococcus braunii presents a unique opportunity to dissect
the roles of the eukaryote and prokaryotes within the consortium and test how the eukaryote responds to per-
turbations in its environmental context.
The interactions between B. braunii and the associated bacteria are not fully understood, but are known to
influence the microalgal growth performance and product formation c apacity14,20–22. The grouping of interde-
pendent organisms living and functionally interacting with each other in the same habitat is also called bio-
coenosis, a term coined by Karl Möbius in 187723. To understand the complex nature of the unique habitat of a
microalgal phycosphere and to unravel the food web between alga and bacteria, we investigated the consortia
accompanying the hydrocarbon/carbohydrate-producing green microalga Botryococcus braunii.
Results
Metagenomic survey of the Botryococcus braunii consortia. To determine the inhabitants of the B.
braunii ecosystem, we profiled four different Botryococcus communities (races A and B) using high-throughput
16S rDNA gene amplicon and read-based metagenome sequencing approaches (Figures S1, S2, S3; Fig. 1a).
Assembly and functional annotation of the metagenomes together with single strain isolation and sequencing
reconstructed the capabilities of the most abundant consortial microorganisms and were used to design and
test synthetic alga-bacteria ecosystems. The analysis of the 16S rDNA amplicons and a read-based metagenome
approach showed that each of the B. braunii communities represents a comparable conserved consortium of
a single algal and at least 25 different bacterial species as well as traces of Archaea and viruses (Figure S2). In
total, 16S rDNA amplicon sequencing identified 33 bacterial taxa, 22 of which were present in both race A and
B consortia (Figure S3, Supplementary Discussion, Chapter 1). The relative abundance of plastid 16S rDNA
sequences accounted up to 49 and 59% of all detected amplicon reads in race A and B samples, respectively.
Combined metagenome de novo assembly and differential coverage and tetra-nucleotide signature based bin-
ning resulted in ten high quality and ten fragmentary bacterial metagenome assembled genomes (MAGs). Three
additional genomes were closed by single strain sequencing (Fig. 1; Tables S1 and S2; Supplementary Discus-
sion, Chapter 1). The bacterial community varied quantitatively, but not qualitatively between growth phases
and strains (Figure S3). B. braunii consortia are inhabited by the bacterial phyla (Proteobactreria, Bacteroidetes,
Acidobacteria and Actinobacteria), comparable to those occupying the plant r hizosphere24, albeit in different
relative abundances.
During the growth phase, the Botryococcus phycosphere is dominated by the genera of Devosia, Dyadobacter,
Dokdonella, Acidobacteria, Brevundimonas, Mesorhizobium and Hydrogenophaga which account for over 80% of
the consortial bacteria (Table S1; Figure S4). The re-processing of the B. braunii Guadeloupe strain metagenome
data25 and direct comparison of the different datasets revealed the coinciding presence of the individual bacterial
genera, although massively varying in the abundance pattern in dependence of cultivation conditions (Figure S5).
The same taxa are also present i.a. in the active microbiome associated roots and rhizosphere of oilseed rape26,
as well as in the lettuce27 and global citrus r hizosphere24, strongly suggesting an overall mutual dependence or
preferred coexistence.
To identify genes that enable the bacterial community members to contribute to and to benefit from the
food web of the consortium, we performed a KEGG-based quantitative functional assignment of the annotated
high-quality MAGs and the sequenced genomes of isolated associates (for details see Methods; Supplementary
Discussion, Chapter 2).
We originally expected a uniform distribution of abilities and a high degree of interconnectedness between
all members of the consortium. Surprisingly, the consortium divides into two functionally distinct groups of
bacteria: The dominant consortia members such as Devosia (DevG), Dyadobacter (DyaG) and Brevundimonas
(Bre1G, B.Bb-A) do not oxyfunctionalize hydrocarbons28, but their genomes are rich in genes involved in the
degradation/assimilation of carbohydrates (Fig. 1b). On the contrary, the bacterial isolates Mycobacterium and
Pimelobacter (M.Bb-A and P.Bb-B), which are of low abundance within the consortia (Figure S3), contain a large
portfolio of genes encoding monooxygenases/hydroxylases for hydrocarbon d egradation28 and hold the potential
for a pronounced catabolic capacity towards lipids, fatty acids and xenobiotics (Fig. 1b). Besides, Mycobacterium
and Pimelobacter genomes were the only genomes among the examined community members to carry non-heme
membrane-associated monooxygenase alkB genes (Table S6)28. To test these observed genetic predisposition of
Scientific Reports | (2021) 11:1726 | https://doi.org/10.1038/s41598-021-81082-1 2
Vol:.(1234567890)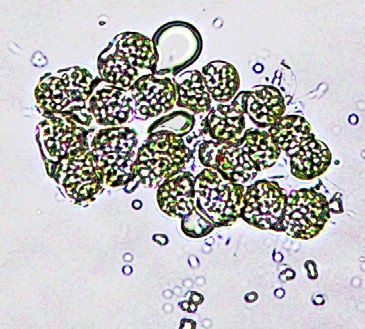
www.nature.com/scientificreports/
a
_L o y on as
G he bac ona les
G eifs ac es as
G yc tom om on
m
G ro hiz er m
a
_P lo m ria
_M c h m
iu
_D hy x g
_A or ct iu
_B ny te s
m
_A in o r
P_ ime dioi rium
_M ov o r
G hiz act ium
G icr nia rium
_H ro y s
G et ora pha
G ph gom cte
G hin biu ium
G ari gen cte
G lan trop tho
er
G es ba ter
G ch op na
O ya on ria
G au ndi cte
G et ia biu
G se ne s
G yd mo xis
s er
ru ba s
G re gob er
u
ct
G os lob r
Vi lo de
a
b c
_R b ob
o c
_V ro ba
l
_S do as
_D im te
_P o an
_S ud lla
se ct
_P ar te
_S o er
_B in ct
_P do hi
_C vu a
_M o te
_M os o
_P e m
_B ea a
_S in b
_M in a
G v iz
G err bac
G ph yro
G ph ba
G m lob
G ok lop
G oc bac
G ten ox
G or lla
h
g
r
_A hy
_S ph
_D y
_T o
_N o
G rad
G cid
e
g
A
P_
Botryococcus braunii
reads
race A race B
T1 T2
consortium
10,000
1,000
T1 T2
100
G G G G G 15 21 G G 25 G 23 22
p4 r1 ya e1 ev AG AG yd ok AG yc AG AG
G Te D Br D H D M
A
M M M M M
A
b-
B
G
b-
r2
.B
b-
.B
Te
B
B
M
P.
G
e2
Acidobacteria Br
α β γ Ac nobacteria
Bacteroidetes Proteobacteria Planctomycetes
b 100%
P. -A
B -A
anabolic pathway
B
1G
2G
G
G
G
G
G
G
G
G
b-
b
b
50%
r1
r2
yd
catabolic pathway
p4
yc
ok
ev
ya
.B
.B
re
re
B
Te
Te 0%
H
M
M
D
D
B
B
G
D
Carbohydrate-Active enzymes (CAZymes*) (264)
Glycoside Hydrolases (GHs)
Glycosyltransferases (GTs)
Glycolysis/Gluconeogenesis (47)
Citrate cycle (TCA cycle) (36)
Pentose phosphate pathway (47) Carbohydrate
metabolism
Pentose and glucuronate interconversions (36)
Fructose, mannose and galactose metabolism (53)
Starch and sucrose metabolism (43)
Pyruvate metabolism (64)
Glyoxylate and dicarboxylate metabolism (61)
Fatty acid biosynthesis (37)
Fatty acid degradation (60)
Lipid
Hydrocarbon oxyfunctionalization (71) metabolism
Synthesis and degradation of ketone bodies (22)
Glycero(phospho)lipid metabolism (33)
Oxidative phosphorylation (53)
Methane metabolism (46) Energy
Nitrogen metabolism (32) metabolism
Sulfur metabolism (29)
ABC transporters (274)
Phosphotransferase system (PTS) (4) Transport
and signal
Bacterial secretion system (38)
transduction
Two-component system (128)
Bacterial chemotaxis (50)
Motility
Flagellar assembly (65)
Xenobiotics metabolism (244)
Metabolism of terpenoids and polyketides (116)
biosynthesis
degradation Secondary
Biosynthesis of other secondary metabolites (62)
metabolites
Secondary metabolite gene cluster (93 cluster)
bacteriocins
antibiotics
Figure 1. Taxonomy of the B. braunii bacterial community and selected functional categories encoded
in reconstructed MAGs and complete genomes. (a) Normalized read-based comparison and taxonomic
assignment of different B. braunii metagenome datasets. The circle size represents the amount of classified reads
for the respective taxonomic group (minimum 50 reads per taxonomic group). Abbreviations: P, phylum; G,
genus; O, order. (b) Abundance of selected functional categories encoded in the high-quality draft and complete
bacterial genomes. Numbers in parentheses represent the maximal total number of genes within each pathway.
Percentage: per cent of total number of genes per pathway identified within each genome. All annotated genes
within the respective pathways are presented on the EMGB platform (https://emgb.cebitec.uni-bielefeld.de/
Bbraunii-bacterial-consortium/). The pathways statistics are summarized in the Table S5.
Scientific Reports | (2021) 11:1726 | https://doi.org/10.1038/s41598-021-81082-1 3
Vol.:(0123456789)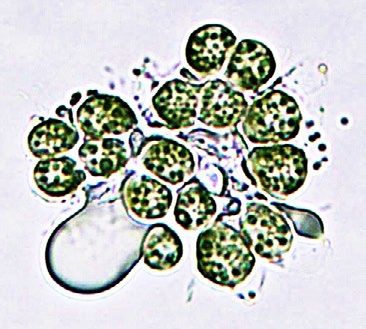
www.nature.com/scientificreports/
a b d
2.5
~ -30%
2.5
~ +60%
*** B. braunii + +
biomass (g L-1) 2.0 2.0 ** axenic control (Mycobacterium sp. Bb-A) (Brevundimonas sp. Bb-A)
biomass (g L-1)
1.5
* 1.5
***
1.0 *** 1.0
***
0.5 0.5
+ +
0.0 0.0
0 3 6 9 12 15 0 3 6 9 12 15
time (d) time (d) 10 µm 10 µm 10 µm
c 9 9
log10 bacterial cells mL-1
log10 bacterial cells mL-1
hydrocarbon content (%)
140 +
+ 8 8
normalized to the control
120
100
7 7
80 C25H48 M.Bb-A B.Bb-A
60 C27H52
C29H56 6 6
40 C31H60 0 3 6 9 12 15 0 3 6 9 12 15
20 C33H64 time (d) time (d)
0
0 3 6 9 12 15
time (d)
Figure 2. Physiological effect of the individual bacterial isolates on the microalgae during co-cultivation.
(a–d) Determination of algal growth and product formation performance of axenic and xenic B. braunii
cultures, supplemented with bacterial isolates. Shown are growth analysis of B. braunii in the presence of (a)
Mycobacterium sp. Bb-A and (b) Brevundimonas sp. Bb-A. The inserts within the graph show the maximal
observed growth difference in comparison to the control. (c) Comparison of the hydrocarbon levels observed
in samples cultivated with bacterial isolates in relation to the axenic B. braunii culture (values set to 100%) in
the course of the cultivation; (d) Morphological characteristic of algal cells during the cultivation (pictures were
taken after 9 days of cultivation) with the bacterial isolates (red arrows indicate the hydrocarbons produced by
the microalga). Graphs imbedded in the pictures show the progress of the bacterial growth (cell number on log10
scale). The error bars represent standard error of mean values of three biological and three technical replicates
(SE; n = 9). Asterisks represent p values as determined via Student’s t-test (*= < 0.05, **= < 0.01, ***= < 0.001).
the consortia, we assessed algal capacities for growth and hydrocarbon production in co-cultivation of the axenic
B. braunii with one representative of each group.
Effect of the bacterial community on the B. braunii host. One representative of the abundant as
well as less abundant community members (Brevundimonas sp. Bb-A and Mycobacterium sp. Bb-A, respectively)
were isolated in axenic culture and used for the co-cultivation experiments. Synthetic algae-bacteria consortia
were formed with an axenic hydrocarbon- and carbohydrate producing B. braunii race A strain SAG30.81 under
strict phototrophic conditions (e.g. without the supplementation of vitamins or organic carbon). Axenic Botryo-
coccus braunii shows a continuous increase in cell biomass and hydrocarbon content, yielding 1.36 ± 0.1 g L −1
and 0.5 ± 0.1 g L , respectively (Fig. 2a, b; Figure S6). Co-cultivation of the Brevundimonas sp. Bb-A promotes
−1
the growth of the alga and increases the biomass by 60.5 ± 16.9% after 15 days of cultivation compared to axenic
control (Fig. 2b). While co-cultivation with the Mycobacterium sp. Bb-A results in reduced growth of the consor-
tia by 12.6 ± 4.1% at the end of cultivation with a maximal reduction of 30.6 ± 4.8% after 9 days (Fig. 2a).
Axenic B. braunii accumulates hydrocarbons up to 38% of its dry weight (DW) in a bacteria-free environ-
ment (Figure S6a), (the value was set to 100% for easier comparison in Fig. 2c). In contrast, co-cultivation with
Mycobacterium limits hydrocarbon accumulation down to 4.4 ± 0.2% compared to the axenic control (Fig. 2c) and
alters colony morphology (Fig. 2d). Loss of the hydrocarbon matrix reduces massively the colony size (Fig. 2d)
and likely increases susceptibility to grazers29. The dramatic decrease in hydrocarbon content and disturbed
colony formation cannot be observed in cultures supplemented with Brevundimonas or in the xenic Botryococcus
braunii algae-bacteria communities (Fig. 2c, d; Figures S1 and S6), pointing to a balanced equilibrium between
the alga and its microbiome in natural environments.
Since Botryococcus readily releases huge amounts of organic carbon into the extracellular m ilieu15, creating
a phycosphere that naturally attracts many microorganisms, including those with potential damaging effects, its
evolutionary fitness will depend on efficient management of the “bacterial zoo”. We hypothesized that there are
strong control mechanisms that allow the algae host to attract and control symbiotic / beneficial bacteria. There-
fore, we examined the genetic portfolio of the bacterial community for essential cofactors and interdependencies.
The core community of Botryococcus phycosphere belongs to a niche of biotin auxotrophs. At
first glance, the Botryococcus alga does not appear to be obligatory dependent on a bacterial community, since
axenic strains can be fully photoautotrophically cultured without vitamin supplements (Fig. 2 a, b) and contains
the vitamin B 12-independent form of methionine synthase (metE)30. (Meta)Genome reconstruction revealed
that the B. braunii bacterial core community is auxotrophic for various B-vitamins (Fig. 3a), making them
Scientific Reports | (2021) 11:1726 | https://doi.org/10.1038/s41598-021-81082-1 4
Vol:.(1234567890)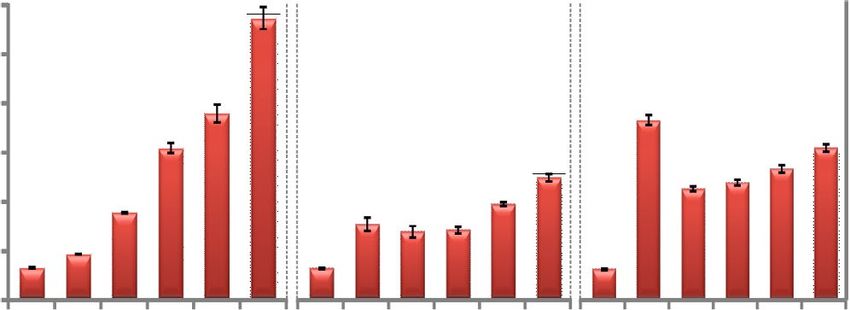
www.nature.com/scientificreports/
a 100% incomplete B-vitamin synthesis pathway
P. - A
B -A
B
1G
2G
G
G
G
G
G
G
G
G
complete B-vitamin synthesis pathway
b-
b
50%
b
r1
r2
yd
p4
yc
ok
ev
ya
.B
.B
re
re
B
vitamin B12 independent
Te
Te
0%
H
M
M
D
D
B
B
G
D
One carbon pool by folate (16)
Vitamin B1, Thiamine metabolism (14)
Vitamin B2, Riboflavin metabolism (11)
Vitamin B3, Nicotinate and nicotinamide (17)
Vitamin B5, Pantothenate and CoA biosynthesis (28)
Vitamin B6 metabolism (7)
Vitamin B7, Biotin metabolism (22)
Vitamin B9, Folate biosynthesis (20)
Vitamin B12, Porphyrin metabolism (36)
b c axenic
control + +
Biotin (B7) content (µg L )
-1
60
100 in cell-free supernatant
50
growth (%)
80
40
60 30
40 20
20 10
0 0
0 3 6 9 12 15 0 3 6 9 12 15 0 3 6 9 12 15
12
ita ins
7)
B
(B
time (d) time (d) time (d)
in
m
m
tin
ta
vi
io
Mycobacterium sp. Bb-A Brevundimonas sp. Bb-A
-b
-v
+B
Figure 3. Essential cofactors (inter-)dependencies of the bacterial core community and isolates of B. braunii.
(a) Heatmap of the reconstructed de novo biosynthesis of B-vitamins encoded in the high-quality draft and
complete bacterial genomes. Numbers in parentheses represent the maximal total number of genes within
each pathway. Percentage: per cent of total number of genes per pathway identified within each genome. All
annotated genes within the respective pathways are presented on the EMGB platform (https://emgb.cebit
ec.uni-bielefeld.de/Bbraunii-bacterial-consortium/). The pathways statistics are summarized in the Table S5
and S8. (b) Growth assay to confirm B-vitamin auxotrophy and prototrophy in axenic Brevundimonas sp. Bb-A
(blue) and Mycobacterium sp. Bb-A (orange) strains, respectively. (c) Biotin concentration levels detected in
cell-free supernatants from the cultures of axenic B. braunii as well as in the presence of Mycobacterium sp. Bb-A
(orange) and Brevundimonas sp. Bb-A (blue). The error bars represent standard error of mean values of three
biological and three technical replicates (SE; n = 9).
dependent on an exogenous supply of vitamins for survival. The complete thiamin synthesis pathway (vitamin
B1, essential for citrate cycle and pentose phosphate pathway12) could not be reconstructed for four assembled
genomes. Five genera are auxotrophic for cobalamin (vitamin B12). All abundant genera within the Botryococ-
cus consortia (including the growth-promoting Brevundimonas, (Fig. 2b)) lack the complete gene portfolio for
biotin (vitamin B7) synthesis (Fig. 3a), but contained the complete biosynthesis pathway of fatty acids for which
biotin is e ssential12. In contrast, low abundant consortial members such as Mycobacterium are B-vitamin proto-
trophs (Fig. 3a).
Extended experimental analysis confirmed the biotin (vitamin B7) auxotrophy in Brevundimonas sp. Bb-A and
vitamin B prototrophy in Mycobacterium sp. Bb-A as deduced from the assembled genomes (Fig. 3a, b). Botryo-
coccus braunii secretes and accumulates biotin into the surrounding environment (Fig. 3c). The biotin secretion
7-auxotrophic Brevundimonas as well
appears to be induced by the presence of bacteria, in the cultures with the B
as in the presence of the biotin-prototrophic Mycobacterium sp. Bb-A, although to a lesser extent (cf. Figure 3c at
timepoint 3 days). The subsequent decrease in biotin amount during the progress of the cultivation further hints
at the active vitamin absorption from the culture supernatant in both co-cultivation approaches in comparison
to the axenic control (Fig. 3c), especially during bacterial proliferation, with the biotin levels increasing again
when bacterial growth stagnates (Fig. 2d, bacterial growth determination for M.Bb-A and B.Bb-A).
Collectively, in a healthy (natural) community, non-hydrocarbon degrading bacterial genera which are auxo-
trophic for one or more vitamins appear to dominate the Botryococcus phycosphere, while fully prototrophic
hydrocarbonoclastic bacteria are present but not abundant. We hypothesized that B. braunii cultivates its own
auxotrophic “bacterial zoo” to combat hydrocarbonoclastic bacteria. To test the hypothesis, synthetic consortia
of alga–”good bacteria”– “bad bacteria” were formed and analyzed.
Scientific Reports | (2021) 11:1726 | https://doi.org/10.1038/s41598-021-81082-1 5
Vol.:(0123456789)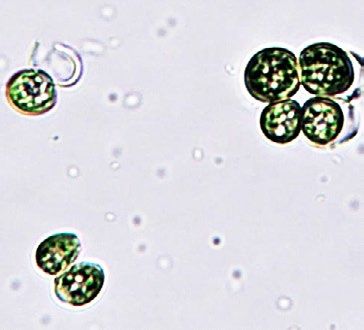
www.nature.com/scientificreports/
a
axenic Botryococcus braunii
/ Mycobacterium sp. Bb-A / Brevundimonas sp. Bb-A
co2 co2 co2
+ + +
10% 50% 90%
+ + +
90% 50% 10%
(%) (%) (%)
100 100 100
50 50 50
log10 bacterial cfu mL-1
log10 bacterial cfu mL-1
log10 bacterial cfu mL-1
9 9 9
0 0 0
0 3 6 9 12 (d) 0 3 6 9 12 (d) 0 3 6 9 12 (d)
8 8 8
7 7 7
6 6 6
5 5 5
0 3 6 9 12 0 3 6 9 12 0 3 6 9 12
time (d) time (d) time (d)
b start
inoculum
100 co2
90
80
hydrocarbon content (%)
70
co2
60
+
10%
+
90%
50 co2
40 +
50%
30 +
50%
20
co2
10 +
+
90%
10%
0
0 3 6 9 12
time (d)
Figure 4. Bacterial symbionts fend their eukaryotic host from hydrocarbonoclastic invaders. Physiology of a
synthetic alga-bacteria-bacteria community, consisting of Brevundimonas sp. Bb-A (blue) and Mycobacterium
sp. Bb-A (orange) in co-culture with B. braunii (green) under photoautrophic conditions with three different
inoculum ratios (10:90, 50:50 or 90:10 per cent based on cfu (colony-forming units)). Shown are (a) the
progression of bacterial proliferation (cfu) and (b) detected relative hydrocarbon levels (normalized to the
axenic control) during the co-cultivation. The error bars represent standard error of mean values of three
biological and three technical replicates (SE; n = 9).
Bacterial biotin‑auxotrophic symbionts defend their eukaryotic host. Based on the abovemen-
tioned findings, we have hypothesized that the alga maintains its balanced, ‘healthy’ microbiome by recruiting
beneficial, vitamin-auxotrophic microorganisms, inter alia, with the provision of photosynthetically fixed car-
bon and biotin, and thus counteracts pathogen assault. To test this hypothesis, one representative of each group,
the vitamin-auxotrophic Brevundimonas and the prototroph Mycobacterium were co-cultivated with the axenic
Botryococcus alga under photoautrophic conditions with three different inoculum ratios (10:90, 50:50 or 90:10
per cent based on cfu) (Fig. 4a).
Independently from the initial amount of inoculum, biotin-auxotrophic Brevundimonas sp. Bb-A proliferated
strongly within this synthetic community and reached in each case a comparable cfu-density of up to 2.1*108 cells
mL−1. Mycobacterium did not proliferate in the presence of Brevundimonas (Fig. 4a), but was clearly capable of
growth in the presence of the microalga alone (Fig. 2d). The propagation of Mycobacterium sp. Bb-A, limited in
each approach to a maximum cfu of up to 1.7*106 cells m L−1 at the end of the cultivation, is therefore likely to
be attributable to the bioactive compounds with bacteriostatic properties produced by Brevundimonas. Indeed,
Scientific Reports | (2021) 11:1726 | https://doi.org/10.1038/s41598-021-81082-1 6
Vol:.(1234567890)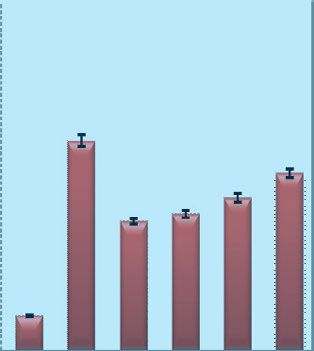
www.nature.com/scientificreports/
all reconstructed genomes encode metabolic gene cluster for antibiotic compounds (especially against Gram-
positive bacteria) and for bacteriocins (Fig. 1b, Table S9) with significant antimicrobial potency32. The protective
effect of Brevundimonas appears to be further evident from the hydrocarbon content of cultures, which increases
with decreasing proportions of Mycobacterium (Fig. 4b). Experimental analyses (Figs. 2, 3, 4) thus support key
conjectures derived from metagenomic assemblies (Figs. 1 and 3a).
Discussion
Microalgae exist in the natural environment as part of a complex microbial consortium, where the different spe-
cies may exert considerable influence on each other for the exploitation of unique biological functions and/or
for the metabolite e xchange2. Bacterial communities within the Botryococcus phycosphere appear to be highly
conserved and illustrate relatively low species biodiversity (Figures S2a and S3), with most of the detected gen-
era occurring in all tested consortia, albeit differentially abundant (Fig. 2; Figure S5;25). The evaluation further
emphasizes dynamic consortia33 that vary considerably depending on physiological conditions, especially in
artificial systems (e.g. supplementation of vitamins and/or a ntibiotics25). Under strict photoautotrophic condi-
tions, most abundant genera identified within the Botryococcus communities (such as Devosia, Dyadobacter,
Brevundimonas etc.; Fig. 1a) also occur in other biomes such as phycosphere and/or rhizosphere24,26,27,34, strongly
indicating preferential coexistence of certain bacteria and eukaryotes.
The fact that Botryococcus readily excretes huge amounts of their photosynthetically fixed organic carbon into
its phycosphere15 (Figure S1) naturally attracts many microorganisms, that can be potentially harmful, so the
evolutionary fitness of the algae host depends heavily on the efficient management of the "bacterial zoo", which
requires strong control mechanisms that facilitate the recruitment and control of beneficial bacterial partners.
Based on the genetically encoded features, the bacterial associates of B. braunii consortia can be apportioned
into two functionally distinct categories of (i) B-vitamin-auxotrophic carbohydrate-degrader (controllable), and
(ii) prototrophic hydrocarbonoclastic species (uncontrollable) (Fig. 5).
The first category includes the most abundant bacterial members of the Botryococcus consortia that do not
assimilate hydrocarbons and display B-vitamin-auxotrophy, strongly depending on exogenous supply for their
survival. Although, auxotrophic for various B-vitamins and non-viable on its own, the consortia’s most abun-
dant species Devosia (DevG, up to 30% abundancy of all bacteria, Table S3) is the only representative of the first
category to contain the complete pathway for vitamin B 12 synthesis (Fig. 3a). In view of the fact that the bacterial
abundance determines their functional relevance for the community35,36, this consortia-dominant species (DevG)
is likely to provide both microalga and bacteria with the essential co-factor8, thus supporting the recent proposi-
tion that the B 12 supply is realized only by a few certain bacteria within the alga-bacteria c onsortia34. The release
of vitamins and vitamin precursors by bacteria is a well known mediator of algae-bacteria interactions9,33, where
the transfer of vitamins like cobalamin and t hiamin8,37 supports algal growth and can be considered as ‘bacterial
farming’ of algae as providers of organic resources. However, our observations show that B. braunii does not
essentially depend on microbial vitamin supply. Further, according to the (meta)genome reconstruction results,
the Botryococcus bacterial consortia cultivated under strictly phototrophic conditions is dominated by vitamin-
auxotrophs (Fig. 3a). Especially the biotin-auxotrophic bacteria are prevalent within the Botryococcus consortia,
so it is doubtful that the large required supply of biotin is of bacterial origin. Because of its predominance within
the community (Figure S2) and the observed active biotin secretion (Fig. 3c), the microalgae tend to be the
main source for the consortial biotin supply. The excretion of some B-vitamins has been observed in microalgae
and plants38,39, however the increasingly induced vitamin secretion by the presence of bacteria, as well as their
simultaneous active uptake, remained so far unrecognized. This observation supports the recent proposition
that many microorganisms although capable of vitamin synthesis themselves if needed, likely prefer to take up
the compounds when available in the environment, because synthesis requires usually more metabolic energy
than transport31. However, we cannot rule out that the lower level of induction of biotin secretion observed for
the biotin-prototrophic Mycobacterium sp. Bb-A (Fig. 3C), may result from a possible suppression of biotin
formation in B. braunii by the bacterium or the recognition of the bacterium as a non-symbiont by the algae.
Nevertheless, since some of the missing cofactors may only be complemented by bacteria (e.g. vitamin B12), strong
bacteria-bacteria relations within the consortia occur in addition to the algae-bacteria interactions, signifying
a deep degree of interconnectedness within the Botryococcus phycosphere.
Completely autonomous species, such as the isolate Mycobacterium sp. Bb-A are rare among the consortia
and assigned to the second category (uncontrollable). These phylotypes are known to be hydrocarbonoclas-
tic microorganisms40,41 targeting mainly the organic carbon source and therefore pose a potential risk to the
microalga, strongly implying a parasitic relationship. And although these phylotypes are able to provide the
Botryococcus alga with vitamin B12, nutrients and probiotic compounds, their activity results in a less complex
colony structure due to the degradation of the hydrocarbon matrix (Fig. 2). The observed change of the colony
morphology might affect the survival of the typically colonized microalgae in the natural environment, i.e. by
higher susceptibility to g razers29. The malfunction of colony formation could thus be attributed to imbalanced
and dysbiotic host-microbiome interaction similar to imbalanced interactions previously o bserved42,43, so that
prototrophic, mainly carbon-targeting bacterial species may essentially act as pathogens.
In this context, it seems reasonable to assume that specific bacteria that require essential co-factors are
deliberately promoted and controlled by Botryococcus braunii in exchange for protection as well as nutrients
and probiotic metabolites. The observed growth-promoting effect of Brevundimonas (Fig. 2b), which depends
on exogenous biotin supply for survival (Fig. 3), is thus based on the close interaction with the microalga. This
mutualistic alga-bacteria relationship seems efficiently to prevent uncontrolled overgrowing of hydrocarbono-
clastic competitors, as demonstrated by the experiments with the minimal synthetic consortia (Fig. 4).
Scientific Reports | (2021) 11:1726 | https://doi.org/10.1038/s41598-021-81082-1 7
Vol.:(0123456789)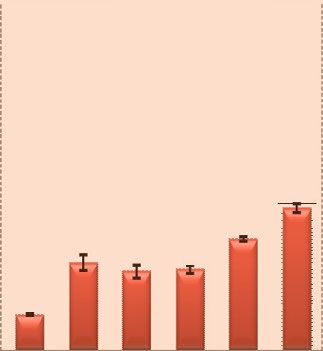
www.nature.com/scientificreports/
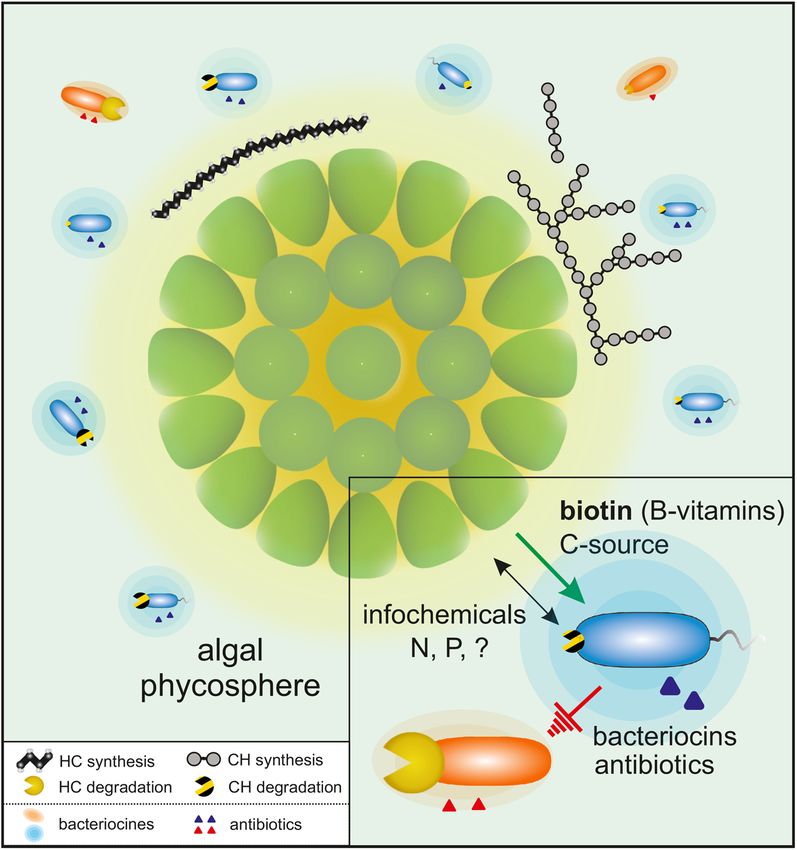
Figure 5. Alga-bacteria interactions within the Botryococcus braunii phycosphere. The depiction summarizes
the observed generic potential encoded in the (meta)genomes of bacterial associates (Figs. 1 and 3), along
with experimental validation within the minimal synthetic community (Figs. 2 and 4). The color code
indicates the functional grouping of the community members: supportive B-vitamin-auxotrophic (blue) and
hydrocarbonoclastic prototrophic (red). The potential for degradation of hydrocarbons and carbohydrates of
the bacterial associates is illustrated via yellow and striped pacmans, respectively. The genetic predisposition to
the synthesis of bacteriocins and antibiotics encoded by the secondary metabolite biosynthesis gene clusters,
is indicated by the halos and triangles, respectively. Abbreviation: HC, Hydrocarbons; CH, carbohydrates; B 7,
Biotin; N, nitrogen; P, phosphorus.
Thus, the interactions between the microalga and bacteria within the Botryococcus braunii consortia depends
on a complex interplay between all members, with the microalga as the “conductor” in this play (Fig. 5). However,
the elucidation of the microalga-bacteria dynamics as well as of the communication signals exchanged between
the participating parties requires more precise kinetic analyses and will be subject for further research. In this
context, the metagenomic analyses of the Botryococcus consortium might represent a path towards mechanistic
resolution of ecological interactions at the microscopic scale.
Materials and methods
Strains, cultivation conditions and growth determination parameters. Liquid, xenic cultures of
Botryococcus braunii race A (CCALA778, isolated in 1997 in Serra da Estrela, Baragem da Erva da Fome, Portu-
gal) and race B (AC761, isolated in 1983 from Paquemar, Martinique, France) as well as the axenic B. braunii race
A strain (SAG30.81, Peru, Dpto.Cuzco, Laguna Huaypo) were used for co-cultivation studies. The cultures were
phototrophically cultivated at room temperature (~ 22 °C) under 16:8 light–dark illumination of 350 ± 400 μmol
photons m−2 s−1 white light in modified Chu-13 media (without the addition of vitamin and organic carbon
source) as described before15. Carbon supply and agitation were achieved by bubbling the cultures with mois-
ture pre-saturated carbon dioxide-enriched air (5%, v/v) with a gas flow rate of 0.05 vvm. Cultures growth was
monitored by measurements of biomass organic dry weight (DW) by drying 10 mL culture per sample (in three
biological and technical replicates) following the protocol described before44. Additionally, microalgae and bac-
teria cells were regularly checked by optical microscopy.
The bacterial isolates were obtained by plating highly diluted xenic B. braunii cultures (CCALA778 and
AC761) on LB agar plates supplemented with vitamins (0.1 nM cobalamin, 3.26 nM thiamine and 0.1 nM biotin,
Sigma Aldrich). After 1–2 weeks single cell colonies were picked, separately plated and analyzed via 16S rDNA
Sanger-sequencing by using the universal primer pair 27F (5′-AGAGTTTGATCCTGGCTCAG-3′) and 1385R
Scientific Reports | (2021) 11:1726 | https://doi.org/10.1038/s41598-021-81082-1 8
Vol:.(1234567890)www.nature.com/scientificreports/
(5′-CGGTGTGTRCAAGGCCC-3′). Two isolates, deriving from algal race A and one from race B, were clas-
sified based on 16S rDNA similarity as Mycobacterium, Brevundimonas and Pimelobacter species, respectively.
The purity of the axenic alga and bacterial strains was regularly verified by polymerase chain reaction (PCR)
amplification and Sanger-sequencing of the 16S rRNA gene using a universal primer pair 27F and 1385R. All
primers were purchased by Sigma Aldrich.
For experiments testing the requirement of B-vitamins, mono-cultures of Mycobacterium sp. Bb-A and
Brevundimonas sp. Bb-A were pre-washed three times in minimal medium45 and then starved of vitamins for two
days prior to the start of the experiment. Then, bacterial cells were diluted to 0.2 (oD600) with minimal medium
supplemented with 1gL−1 glucose and B-vitamins (at the following concentrations: 0.1 nM (each) of cobalamin,
riboflavin, biotin and pantothenate as well as 3.26 nM thiamine, Sigma Aldrich) and grown for seven days.
For the co-cultivation experiments, 500 mL axenic algal cultures (~ 0.25 g L −1) were inoculated with the iso-
lates (Mycobacterium sp. Bb-A or Brevundimonas sp. Bb-A, with ~ 2 × 10⁶ cells m L−1 for single isolate cultivation
6 7 −1
and with ~ 2 × 10 –2 × 10 cells m L (in different ratios 10:90, 50:50 and 90:10 (cfu/cfu)) for co-cultivation with
both bacterial strains) and cultured under photoautotrophic conditions. The bacterial cell density was determined
by manual cell counting using hemocytometer or by determination of the colony-forming units (cfu) as a proxy
ethod46.
for viable population density using the replica plating m
The quantitative determination of the biotin concentration in cell-free supernatants of the co-cultures and the
axenic control was accomplished by using microbiological microtiter plate test (VitaFast, r-biopharm, Darmstadt,
Germany) according to manufacturer instructions.
Hydrocarbon extraction and analysis. Hydrocarbon extraction was performed according to the proto-
col published p reviously15. The dry extracted hydrocarbons were resuspended in 500 µL of n-hexane, contain-
ing an internal standard n-hexatriacontane (C36H74, Sigma Aldrich) and analysed via GC–MS and GC-FID as
described before15,47.
DNA sample collection and preparation. The samples from xenic B. braunii race A and B cultures
(three biological replicates) were taken in the linear and stationary growth phases (after 9 and 24 days). Total
community genomic DNA was extracted as previously described48. The quality of the DNA was assessed by gel
electrophoresis and the quantity was estimated using the Quant-iT PicoGreen dsDNA Assay Kit (Invitrogen)
and a Tecan Infinite 200 Microplate Reader (Tecan Deutschland GmbH).
High‑throughput 16S rDNA amplicon sequencing. To get insight into the community composition of
B. braunii Race A and B, high-throughput 16S rDNA amplicon sequencing was performed as described recently
by Maus et al49. The primer pair Pro341F (5′-CCTACGGGGNBGCASCAG-3′) and Pro805R (5′-GACTAC
NVGGGTATCTAATCC-3′) was used to amplify the hypervariable regions V3 and V4 of diverse bacterial and
archaeal 16S r RNAs50. In addition, the primers also cover the 16S rDNA gene of algal chloroplasts and eukar-
yotic mitochondrial genomes. Furthermore, in a two PCR steps based approach, multiplex identifier (MID)
tags and Illumina-specific sequencing adaptors were added to each amplicon. Only amplicons featuring a size
of ~ 460 bp were purified using AMPureXP magnetic beads (Beckman Coulter GmbH, Brea, California, USA).
Resulting amplicons were qualitatively and quantitatively analyzed using the Agilent 2100 Bioanalyzer system
(Agilent Inc., Santa Clara, California, USA) and pooled in equimolar amounts for paired-end sequencing on the
Illumina MiSeq system (Illumina, San Diego, California USA). This sequencing approach provided ~ 150,000
reads per sample. An in-house pipeline as described previously51 was used for adapter and primer trimming
of all samples. For amplicon processing, a further in house amplicon processing pipeline including F LASH52,
USEARCH53 (v8.1), UPARSE54 and the RDP55 classifier (v2.9) was applied as described r ecently56,57. In summary,
unmerged sequences resulting by FLASH 52 (default settings + −M 300) were directly filtered out. Furthermore,
sequences with > 1Ns (ambiguous bases) and expected errors > 0.5 were also discarded. Resulting data was fur-
ther processed and operational taxonomic units (OTUs) were clustered by applying USEARCH53 (v8.1). The
resulting OTUs were taxonomically classified using the RDP55 classifier (v2.9) in 16S modus (Threshold > 0.8)
and compared to the nt database by means of BLASTN58. In the last step, raw sequence reads were mapped back
onto the OTU sequences in order to get quantitative assignments.
(Meta)Genome sequencing, assembly, binning and annotation. For each of the four samples (B.
braunii race A and B from linear (T1) and stationary (T2) growth phase), the genomic DNA from three rep-
licates was pooled. To obtain the metagenome sequence, four whole-genome-shotgun PCR-free sequencing
libraries (Nextera DNA Sample Prep Kit; Illumina, Munich, Germany) were generated based on the manu-
facturer’s protocol representing different time points of the cultivation and different algae communities. The
libraries were sequenced in paired-end mode in a MiSeq run (2 × 300 bp) resulting in 11,963,558 and 11,567,552
reads for race A T1 and T2; 6,939,996 and 12,031,204 reads for race B T1 and T2, respectively (total 12.75 Gb).
The de novo metagenome assembly was performed using the Ray Meta assembler59 (v2.3.2) using a k-mer size
of 41 and default settings. For contigs with length larger than 1 kb (n = 127,914), the total assembly size was
338.5 Mb, the N50 = 2884 and the largest contig 1.59 Mb. All processed raw sequence reads were aligned to the
assembled metagenome contigs by means of Bowtie 260 (v2.2.4). By using SAMtools61 (v1.6), the SAM files were
converted to BAM files. These files were sorted and read mapping statistics were calculated. The following por-
tions of reads could be assembled to the draft metagenomes: 70.1% and 77.5% for race A (T1 and T2); 51.0% and
62.9% for race B (T1 and T2). For binning of the metagenome assembled genomes (MAGs), the tool MetaBAT
(v0.21.3)62 was used with default settings. Completeness and contamination of the resulting MAGs were tested
with BUSCO63,64 (v3.0.), using the Bacteria and Metazoa data set (Table S1).
Scientific Reports | (2021) 11:1726 | https://doi.org/10.1038/s41598-021-81082-1 9
Vol.:(0123456789)www.nature.com/scientificreports/
For sequencing of the isolated species, 4 µg of purified chromosomal D NA48 was used to construct PCR-free
sequencing library and sequenced applying the paired protocol on an Illumina MiSeq system, yielding ~ 1.71 Mio
Reads (517 Mb in 3 Scaffolds, 58 Contigs) for Mycobacterium sp. Bb-A and ~ 1.70 Mio Reads (503 Mb in 6 Scaf-
folds, 65 Contigs) for Pimelobacter sp. Bb-B. Obtained sequences were de novo assembled using the GS de novo
Assembler software (v2.8, Roche). An in silico gap closure approach was performed as described p reviously65.
MinION sequencing library with genomic DNA from Brevundimonas sp. Bb-A was prepared using the Nanop-
ore Rapid DNA Sequencing kit (SQK-RAD04) according to the manufacturer’s instructions with the following
changes: The entry DNA amount was increased to 800 ng and an AMPure XP bead cleanup was carried out
after transposon fragmentation. Sequencing was performed on an Oxford Nanopore MinION Mk1b sequencer
using a R9.5 flow cell, which was prepared according to the manufacturer’s instructions. MinKNOW (v1.13.1)
was used to control the run using the 48 h sequencing run protocol; base calling was performed offline using
albacore (v2.3.1). The assembly was performed using canu v1.766, resulting in a single, circular contig (170 Mb,
1 kb to 17.5 kb). This contig was then polished with Illumina short read data from the metagenome data set
using pilon67, run for sixteen iterative cycles. bwa-mem68 was used for read mapping in the first eight iterations
and bowtie2 v2.3.260 in the second set of eight iterations. Annotation of the draft chromosomes was performed
within the P ROKKA69 (v1.11) pipeline and visualized using the GenDB 2.0 s ystem70.
Gene prediction, taxonomic assignment and functional characterization. Gene prediction on
the assembled contigs of the MAGs was performed with P rodigal71 (v2.6.1) using the metagenome mode (“-p
meta”). All genes were annotated and analyzed with the in-house EMGB annotation system using the databases
NCBI NR58, Pfam72 and KEGG73. Based on D IAMOND74 (v0.8.36) hits against the NCBI-NR58 database, all genes
were subject to taxonomic assignment using M EGAN75. Relationships to metabolic pathways were assigned
based on DIAMOND74 hits against K EGG73. For Pfam72 annotations, pfamscan was used with default param-
eters. The genomes were manually inspected using an E-value cutoff of 1 × 10⁻¹⁰ for several specific sequences
listed in Additional file 2, Table S6. The profiling of the carbohydrate-active enzymes (CAZy) encoded by the
B. braunii community members was accomplished using d bCAN276 metaserver (Table S7). The identification,
annotation and analysis of the secondary metabolite biosynthesis gene clusters within the MAGs and complete
genomes were accomplished via the antiSMASH77 (v4.0) web server with default settings (Table S9).
Phylogenetic analyses. To assign and phylogenetically classify the MAGs, a core genome tree was cre-
ated by applying EDGAR78 (v2.0). For calculation of a core-genome-based phylogenetic tree, the core genes of
all MAGs and the three isolates Mycobacterium sp. Bb-A, Brevundimonas sp. Bb-A and Pimelobacter sp. Bb-B,
corresponding to selected reference sequences were considered. The implemented version of F ASTtree79 (using
default settings) in EDGAR78 (v2.0) was used to create a phylogenetic Maximum-Likelihood tree based on 53
core genes (see Table S4) of all genomes. Additionally, the MAGs were taxonomically classified on species level
by calculation of average nucleic and amino acid identities (ANI, AAI) by applying EDGAR78 (v2.0). For phylo-
genetic analysis of the 16S rDNA amplicon sequences, MEGA80 (v7.0.26) was used. Phylogenetic tree was con-
structed by means of Maximum-Likelihood Tree algorithm using Tamura 3-parameter model. The robustness of
the inferred trees was evaluated by bootstrap (1000 replications).
Data availability
The high-throughput 16S rDNA amplicon sequencing datasets obtained during the present work are available
at the EMBL-EBI database under BioProjectID PRJEB21978. The chloroplastic 16S rRNA genes sequencing
data of B. braunii SAG 30.81 are available under the GenBank accession number MN956340. The metagenome
datasets of Botryococcus braunii consortia as well as the resulting MAGs have been deposited under the Bio-
ProjectIDs PRJEB26344 and PRJEB26345, respectively. The genomes of the isolates Brevundimonas sp. Bb-A,
Mycobacterium sp. BbA or Pimelobacter sp. Bb-B are accessible under BioProjectIDs PRJNA528993, PRJEB28031
und PRJEB28032, respectively. In addition, the communities most abundant ten high-quality draft as well as
isolate genomes are also accessible via EMGB platform (https://emgb.cebitec.uni-bielefeld.de/Bbraunii-bacte
rial-consortium/).
Received: 25 March 2020; Accepted: 17 December 2020
References
1. Grosberg, R. K. & Strathmann, R. R. The evolution of multicellularity: a minor major transition?. Annu. Rev. Ecol. Evol. Syst. 38,
621–654 (2007).
2. Seymour, J. R., Amin, S. A., Raina, J. B. & Stocker, R. Zooming in on the phycosphere: the ecological interface for phytoplankton-
bacteria relationships. Nat. Microbiol. 2, 1–12 (2017).
3. Ramanan, R., Kim, B.-H., Cho, D.-H., Oh, H.-M. & Kim, H.-S. Algae–bacteria interactions: evolution, ecology and emerging
applications. Biotechnol. Adv. 34, 14–29 (2016).
4. Amin, S. A. et al. Interaction and signalling between a cosmopolitan phytoplankton and associated bacteria. Nature 522, 98–101
(2015).
5. Cole, J. J. Interactions between bacteria and algae in aquatic ecosystems. Annu. Rev. Ecol. Syst. 13, 291–314 (1982).
6. Zengler, K. & Zaramela, L. S. The social network of microorganisms: how auxotrophies shape complex communities. Nat. Rev.
Microbiol. 16, 383–390 (2018).
7. Wang, X. et al. Lysis of a red-tide causing alga, Alexandrium tamarense, caused by bacteria from its phycosphere. Biol. Control 52,
123–130 (2010).
8. Croft, M. T., Lawrence, A. D., Raux-Deery, E., Warren, M. J. & Smith, A. G. Algae acquire vitamin B12 through a symbiotic rela-
tionship with bacteria. Nature 438, 90–93 (2005).
Scientific Reports | (2021) 11:1726 | https://doi.org/10.1038/s41598-021-81082-1 10
Vol:.(1234567890)www.nature.com/scientificreports/
9. Croft, M. T., Warren, M. J. & Smith, A. G. Algae need their vitamins. Eukaryot. Cell 5, 1175–1183 (2006).
10. Tang, Y. Z., Koch, F. & Gobler, C. J. Most harmful algal bloom species are vitamin B1 and B12 auxotrophs. Proc. Natl. Acad. Sci.
107, 20756–20761 (2010).
11. Grant, M. A. A., Kazamia, E., Cicuta, P. & Smith, A. G. Direct exchange of vitamin B12 is demonstrated by modelling the growth
dynamics of algal-bacterial cocultures. ISME J. 8, 1418–1427 (2014).
12. Sañudo-Wilhelmy, S. A., Gómez-Consarnau, L., Suffridge, C. & Webb, E. A. The role of B vitamins in marine biogeochemistry.
Ann. Rev. Mar. Sci. 6, 339–367 (2014).
13. Gómez-Consarnau, L. et al. Mosaic patterns of B-vitamin synthesis and utilization in a natural marine microbial community.
Environ. Microbiol. 20, 2809–2823 (2018).
14. Banerjee, A., Sharma, R., Chisti, Y. & Banerjee, U. C. Botryococcus braunii: a renewable source of hydrocarbons and other chemi-
cals. Crit. Rev. Biotechnol. 22, 245–279 (2002).
15. Blifernez-Klassen, O. et al. Metabolic survey of Botryococcus braunii: Impact of the physiological state on product formation.
PLoS ONE 13, e0198976 (2018).
16. Marschner, P. Marschner’s Mineral Nutrition of Higher Plants 3rd edn. (Elsevier Ltd., Amsterdam, 2012).https://doi.org/10.1016/
C2009-0-63043-9.
17. Bisseling, T., Dangl, J. L. & Schulze-Lefert, P. Next-generation communication. Science 324(80), 691 (2009).
18. Nguyen, C. Rhizodeposition of organic C by plant: mechanisms and controls. In Sustainable Agriculture (eds Lichtfouse, E. et al.)
97–123 (Springer, Dordrecht, 2009). https://doi.org/10.1007/978-90-481-2666-8_9.
19. McKirdy, D. M., Cox, R. E., Volkman, J. K. & Howell, V. J. Botryococcane in a new class of Australian non-marine crude oils.
Nature 320, 57–59 (1986).
20. Fuentes, J. L. et al. Impact of microalgae-bacteria interactions on the production of algal biomass and associated compounds. Mar.
Drugs 14, 100 (2016).
21. Tanabe, Y. et al. A novel alphaproteobacterial ectosymbiont promotes the growth of the hydrocarbon-rich green alga Botryococcus
braunii. Sci. Rep. 5, 10467 (2015).
22. Chirac, C., Casadevall, E., Largeau, C. & Metzger, P. Bacterial influence upon growth and hydrocarbon production of the green
alga Botryococcus braunii. J. Phycol. 21, 380–387 (1985).
23. Jax, K. Ecological units: definitions and application. Q. Rev. Biol. 81, 237–258 (2006).
24. Xu, J. et al. The structure and function of the global citrus rhizosphere microbiome. Nat. Commun. 9, 4894 (2018).
25. Sambles, C. et al. Metagenomic analysis of the complex microbial consortium associated with cultures of the oil-rich alga Botryo-
coccus braunii. Microbiologyopen 6, e00482 (2017).
26. Gkarmiri, K. et al. Identifying the active microbiome associated with roots and rhizosphere soil of oilseed rape. Appl. Environ.
Microbiol. 83, e01938-e2017 (2017).
27. Schreiter, S. et al. Effect of the soil type on the microbiome in the rhizosphere of field-grown lettuce. Front. Microbiol. 5, 144 (2014).
28. Rojo, F. Enzymes for aerobic degradation of alkanes. Handb. Hydrocarb. Lipid Microbiol. 2, 781–797 (2010).
29. Pančić, M. & Kiørboe, T. Phytoplankton defence mechanisms: traits and trade-offs. Biol. Rev. 93, 1269–1303 (2018).
30. Molnár, I. et al. Bio-crude transcriptomics: gene discovery and metabolic network reconstruction for the biosynthesis of the
terpenome of the hydrocarbon oil-producing green alga, Botryococcus braunii race B (Showa). BMC Genom. 13, 576 (2012).
31. Jaehme, M. & Slotboom, D. J. Diversity of membrane transport proteins for vitamins in bacteria and archaea. Biochim. Biophys.
Acta Gen. Subj. 1850, 565–576 (2015).
32. Cotter, P. D., Ross, R. P. & Hill, C. Bacteriocins: a viable alternative to antibiotics?. Nat. Rev. Microbiol. 11, 95–105 (2013).
33. Cirri, E. & Pohnert, G. Algae−bacteria interactions that balance the planktonic microbiome. New Phytol. 223, 100–106 (2019).
34. Krohn-Molt, I. et al. Insights into Microalga and bacteria interactions of selected phycosphere biofilms using metagenomic,
transcriptomic, and proteomic approaches. Front. Microbiol. 8, 1941 (2017).
35. Reed, H. & Martiny, J. Testing the functional significance of microbial composition in natural communities. FEMS Microbiol. Ecol.
62, 161–170 (2007).
36. Rivett, D. W. & Bell, T. Abundance determines the functional role of bacterial phylotypes in complex communities. Nat. Microbiol.
3, 767–772 (2018).
37. Paerl, R. W. et al. Use of plankton-derived vitamin B1 precursors, especially thiazole-related precursor, by key marine picoeukary-
otic phytoplankton. ISME J. 11, 753 (2017).
38. Aaronson, S. et al. The cell content and secretion of water-soluble vitamins by several freshwater algae. Arch. Microbiol. 112, 57–59
(1977).
39. Higa, A., Miyamoto, E., Rahman, L. & Kitamura, Y. Root tip-dependent, active riboflavin secretion by Hyoscyamus albus hairy
roots under iron deficiency. Plant Physiol. Biochem. 46, 452–460 (2008).
40. Thompson, H., Angelova, A., Bowler, B., Jones, M. & Gutierrez, T. Enhanced crude oil biodegradative potential of natural phyto-
plankton-associated hydrocarbonoclastic bacteria. Environ. Microbiol. 19, 2843–2861 (2017).
41. Dashti, N. et al. Most hydrocarbonoclastic bacteria in the total environment are diazotrophic, which highlights their value in the
bioremediation of hydrocarbon contaminants. Microbes Environ. 30, 70–75 (2015).
42. Gilbert, J. A. et al. Microbiome-wide association studies link dynamic microbial consortia to disease. Nature 535, 94 (2016).
43. Durán, P. et al. Microbial interkingdom interactions in roots promote Arabidopsis survival. Cell 175, 973–983 (2018).
44. Astals, S., Nolla-Ardèvol, V. & Mata-Alvarez, J. Anaerobic co-digestion of pig manure and crude glycerol at mesophilic conditions:
Biogas and digestate. Bioresour. Technol. 110, 63–70 (2012).
45. Schlegel, H. G., Kaltwasser, H. & Gottschalk, G. Ein Submersverfahren zur Kultur wasserstoffoxydierender Bakterien: Wachstum-
sphysiologische Untersuchungen. Arch. Mikrobiol. 38, 209–222 (1961).
46. Jett, B. D., Hatter, K. L., Huycke, M. M. & Gilmore, M. S. Simplified agar plate method for quantifying viable bacteria. Biotechniques
23, 648–650 (1997).
47. Schwarzhans, J. P. et al. Dependency of the fatty acid composition of Euglena gracilis on growth phase and culture conditions. J.
Appl. Phycol. 27, 1389–1399 (2014).
48. Zhou, J., Bruns, M. A. & Tiedje, J. M. DNA recovery from soils of diverse composition. Appl. Environ. Microbiol. 62, 316–322
(1996).
49. Maus, I. et al. Biphasic study to characterize agricultural biogas plants by high-throughput 16S rRNA gene amplicon sequencing
and microscopic analysis. J. Microbiol. Biotechnol. 27, 321–334 (2017).
50. Takahashi, S., Tomita, J., Nishioka, K., Hisada, T. & Nishijima, M. Development of a prokaryotic universal primer for simultaneous
analysis of bacteria and archaea using next-generation sequencing. PLoS ONE 9, e105592 (2014).
51. Wibberg, D. et al. Genome analysis of the sugar beet pathogen Rhizoctonia solani AG2-2IIIB revealed high numbers in secreted
proteins and cell wall degrading enzymes. BMC Genom. 17, 245 (2016).
52. Magoč, T. & Salzberg, S. L. FLASH: Fast length adjustment of short reads to improve genome assemblies. Bioinformatics 27,
2957–2963 (2011).
53. Edgar, R. C. Search and clustering orders of magnitude faster than BLAST. Bioinformatics 26, 2460–2461 (2010).
54. Edgar, R. C. UPARSE: highly accurate OTU sequences from microbial amplicon reads. Nat. Methods 10, 996–998 (2013).
55. Wang, Q., Garrity, G. M., Tiedje, J. M. & Cole, J. R. Naive Bayesian classifier for rapid assignment of rRNA sequences into the new
bacterial taxonomy. Appl. Environ. Microbiol. 73, 5261–5267 (2007).
Scientific Reports | (2021) 11:1726 | https://doi.org/10.1038/s41598-021-81082-1 11
Vol.:(0123456789)You can also read