Sea stars generate downforce to stay attached to surfaces
←
→
Page content transcription
If your browser does not render page correctly, please read the page content below
www.nature.com/scientificreports
OPEN Sea stars generate downforce
to stay attached to surfaces
Mark Hermes* & Mitul Luhar
Intertidal sea stars often function in environments with extreme hydrodynamic loads that can
compromise their ability to remain attached to surfaces. While behavioral responses such as
burrowing into sand or sheltering in rock crevices can help minimize hydrodynamic loads, previous
work shows that sea stars also alter body shape in response to flow conditions. This morphological
plasticity suggests that sea star body shape may play an important hydrodynamic role. In this study,
we measured the fluid forces acting on surface-mounted sea star and spherical dome models in water
channel tests. All sea star models created downforce, i.e., the fluid pushed the body towards the
surface. In contrast, the spherical dome generated lift. We also used Particle Image Velocimetry (PIV)
to measure the midplane flow field around the models. Control volume analyses based on the PIV data
show that downforce arises because the sea star bodies serve as ramps that divert fluid away from the
surface. These observations are further rationalized using force predictions and flow visualizations
from numerical simulations. The discovery of downforce generation could explain why sea stars are
shaped as they are: the pentaradial geometry aids attachment to surfaces in the presence of high
hydrodynamic loads.
Intertidal sea stars often function in environments with extreme hydrodynamic l oads1 that can compromise their
ability to remain attached to and move on s urfaces2. While behavioral responses such as burrowing into sand
or sheltering in rock crevices can help minimize hydrodynamic loads, previous work shows that sea stars also
alter body shape in response to flow conditions3. This morphological plasticity suggests that sea star body shape
and size may play an important hydrodynamic role. Specifically, Hayne and Palmer3 demonstrated that the arms
of the purple sea star (Pisaster ochraceous) narrow and lose mass when transplanted to a more wave-exposed
environment. The authors hypothesized that this transformation is a functional response to wave intensity: that
by changing shape they are minimizing drag or related hydrodynamic forcing. Further, Computational Fluid
Dynamics (CFD) simulations of wave-exposed sea star models showed a decrease in both lift and drag coef-
ficients compared to models of sheltered sea stars, suggesting that the observed shape adaptation conferred a
hydrodynamic benefit.
In this paper, we evaluate the hydrodynamics associated with sea star body shapes in turbulent flow conditions
via laboratory experiments and CFD simulations. Though natural sea stars can exhibit significant diversity in
surface texture, number of arms, and other morphological properties, we limit our study to smooth pentaradial
shapes to isolate the effect of arm aspect ratio. Specifically, we consider models of comparable shape and size to
adult purple sea stars. Sea stars are known to increase dramatically in size from the early juvenile to the adult
stage4,5. The evolution in the hydrodynamic response during this development is outside the scope of the present
study. In addition to providing insight into previous biological observations, the present effort has potential
applications in fields ranging from flow control to shape optimization for vehicles.
Existing research investigating flow over surface-mounted objects has focused on characterizing the effect of
surface fouling, designing drag-reducing structures, and studying airflow around buildings6–9. A variety of geom-
etries have been considered, including cubes10,11, circular cylinders12, hemispheres12–14, pyramids15,16, cones17–19,
and triangular cylinders20,21. Most of these studies provide drag and drag-coefficient estimates. Measurements
of lift are rarer, in part because lift forces may be less important for the applications described. However, lift is a
useful performance metric for cases in which surface attachment is a concern.
Perhaps the closest shapes to the sea star that have been studied are pyramids and triangular cylinders.
Measurements made by I khwan15 indicate that pyramids generate lift forces that increase with increasing aspect
ratio. On the other hand, Iungo and B aresti20 show that triangular cylinders generate downforce. This downforce
is shown to originate from an upward deflection of the wake behind the cylinders, and its magnitude increases
with increasing steepness of the triangular cross-section.
University of Southern California, Aerospace and Mechanical Engineering, Los Angeles 90089, USA. * email:
markherm@usc.edu
Scientific Reports | (2021) 11:4513 | https://doi.org/10.1038/s41598-021-83961-z 1
Vol.:(0123456789)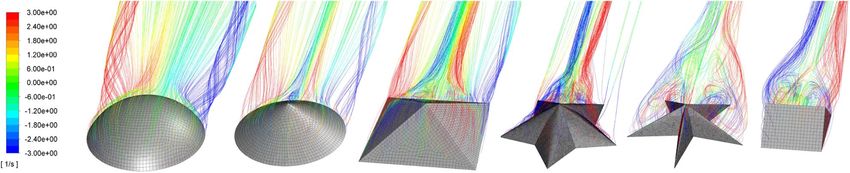
www.nature.com/scientificreports/

                                            Figure 1.  Mean (a) drag force, (b) lift force, (c) drag coefficient, and (d) lift coefficient values for sea star and
                                            spherical dome models shown as functions of freestream velocity (a,b) and Reynolds number (c,d). The sea star
                                            models have aspect ratios AR = 4.0 (red symbols), 2.5 (green symbols), and 1.5 (blue symbols).

                                                The experiments performed in this paper similarly show downforce generation for sea star models that is
                                            associated with an upward deflection of fluid flow around the body. However, downforce is not observed in
                                            experiments with spherical domes of comparable size to the sea star models. These observations, together with
                                            results from complementary CFD simulations of flow over cones, pyramids, and triangular cylinders, suggest that
                                            the radially symmetric sea star geometry generates a hydrodynamic response similar to (nearly) two-dimensional
                                            triangular cylinders.

                                            Results
                                            We mounted 3-D printed sea star and spherical dome models to a load cell in a water channel to study the effect
                                            of morphology on the mean drag and lift forces ( Fd , FL ) generated by these objects across a range of flow speeds
                                            (U). The effect of sea star morphology was studied by varying the arm aspect ratio AR over the range of values
                                            reported for Pisaster ochraceous3; here, AR is defined as the ratio between the arm length measured from the
                                            distal tip to the central axis and the arm width measured at the base intersection. We also measured the effect of
                                            body orientation with respect to the flow, , for the pentaradial sea star models using a servo motor position-
                                            ing system. We supplemented these force measurements with PIV-based flow visualization and control volume
                                            analyses. To provide additional qualitative and quantitative insight into the experimental observations, we also
                                            pursued CFD simulations for a limited range of geometries. Details regarding model design, experimental appa-
                                            ratus, and analysis methods can be found in Sect. 4.

                                            Effect of aspect ratio and orientation on drag and lift.                Figure 1 compares the mean drag and lift
                                            generated by three sea star models of varying aspect ratio against the drag and lift generated by a spherical dome
                                            of similar height and base diameter as the sea star models. For these measurements, the sea star models were
                                            oriented at  = 0◦, i.e., with one limb pointing into the oncoming flow. As expected, the magnitude of the drag
                                            and lift forces generated by the models increases with increasing freestream velocity. However, the correspond-
                                            ing drag and lift coefficients (Cd , CL; see Eqs. (2) and (3)) show more limited variation with Reynolds number
                                            (Re, defined using base diameter; see Eq.(4)). Perhaps the most striking feature of the results presented in Fig. 1
                                            is that all sea star models generate downforce (i.e., FL < 0 and CL < 0) while the spherical dome model gener-
                                            ates positive lift forces that are much higher in magnitude. Lift coefficient values for all three sea star models are
                                            similar within uncertainty at the lowest Reynolds number. However, measurements made at higher Reynolds
                                            numbers suggest that the AR = 1.5 sea star model (blue symbols) generates the least downforce and has the low-
                                            est |CL |. Importantly, though the pentaradial sea star models generate downforce, they also incur a drag penalty
                                            compared to the spherical dome. The drag coefficients for the sea star models (Cd > 0.9) are significantly higher

          Scientific Reports |   (2021) 11:4513 |                https://doi.org/10.1038/s41598-021-83961-z                                                      2

Vol:.(1234567890)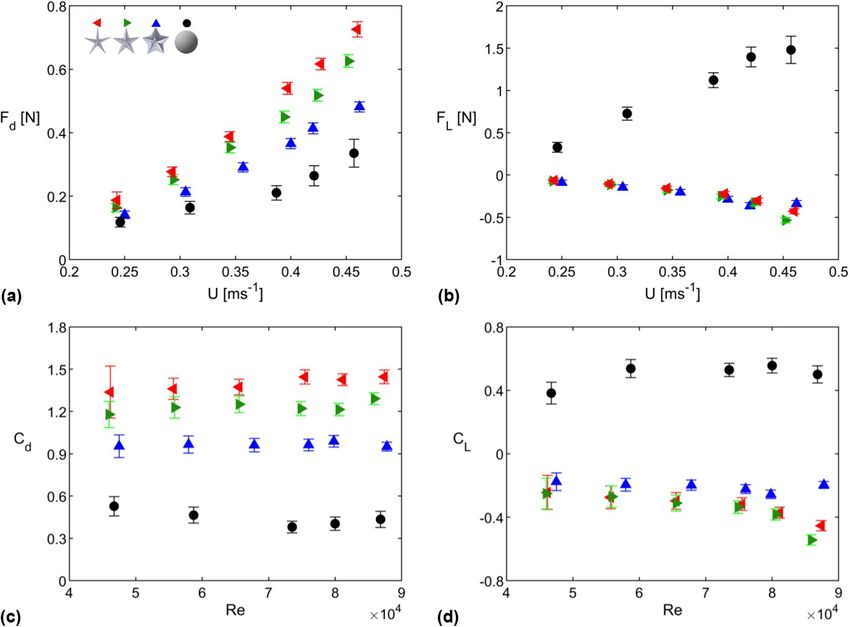
www.nature.com/scientificreports/

                                 Figure 2.  Drag and lift coefficient values for sea star models for varying orientation angles at flow speed
                                 U ≈ 0.46 ms−1. Given the pentaradial symmetry of the sea star models, Cd and CL for  = 36 ◦ to  = 72 ◦ can
                                 be estimated by mirroring the data shown in this figure.

                                  than those for the spherical dome (Cd < 0.6). Further, the drag coefficients for the sea star models increase with
                                  increasing aspect ratio.
                                      Figure 2 shows drag and lift coefficients for all three sea star models as a function of the orientation angle
                                  for the highest Reynolds number case shown in Fig. 1. Consistent with the results from Fig. 1, there is a mono-
                                  tonic increase in Cd as a function of aspect ratio. However, the drag coefficient values show no consistent trend
                                  with respect to orientation. Lift coefficients for all three geometries similarly show no clear trend with respect
                                  to orientation, though there is a consistent increase in CL with  for the model with AR = 2.5 (green symbols).
                                  In general, measured CL values for the models with AR = 4.0 (red symbols) and AR = 2.5 (green symbols) are
                                  significantly lower than the values measured for AR = 1.5 (blue symbols). Together, these observations indicate
                                  that the drag and lift forces generated by the sea star models are relatively insensitive to orientation, and confirm
                                  that Cd and |CL | increase with increasing AR.

                                  PIV flow visualization and control volume analysis. To provide further insight into the force meas-
                                  urements shown in Fig. 1, we pursued PIV experiments at freestream velocity U = 0.47 ± 0.01. Though the
                                  fluid forces acting on the objects arise from three-dimensional flow fields, the planar mean flow visualizations
                                  shown in Fig. 3a–c provide a partial physical explanation for the observed trends in drag and lift. Specifically, the
                                  sharp apex creates a distinct separation point for the flow over the sea star models. In contrast, the flow over the
                                  spherical dome has a separation point much further down the body, resulting in a smaller wake region compared
                                  to the sea star models. Further, the wake behind the high aspect ratio sea star model is larger than the wake
                                  behind the low aspect ratio sea star model. These observations are qualitatively consistent with the drag force
                                  measurements shown in Fig. 1a: the sea star models generate more drag than the spherical dome, and the drag
                                  force generated increases with increasing aspect ratio. Importantly, the wakes behind the sea star models clearly
                                  show an upward redirection of the flow beyond the apex. An upward redirection of the flow is not observed for
                                  the spherical dome due to the delayed separation. These observations provide a qualitative explanation for the
                                  lift trends observed in Fig. 1b. The downforce experienced by the sea star models is a consequence of the upward
                                  redirection of fluid momentum in the wake.
                                       We also used a control volume approach (described in Sect. 4) to estimate drag and lift forces per unit length
                                  ( Fd ′ , FL ′ ) from the planar PIV measurements. Figure 1 lists the mean values for Fd ′ and FL ′ obtained after aver-
                                  aging over all PIV frames.
                                       Consistent with the load cell measurements of lift shown in Fig. 1b, FL ′ is positive for the spherical dome and
                                  negative for the two sea star models. In addition, the magnitude of the estimated lift per unit length (|FL ′ |) for the
                                  spherical dome is nearly twice that for the sea star models. Both sea star models have similar FL ′ values though
                                  the AR = 4.0 model is estimated to generate slightly higher downforce per unit length. Similarly, the estimates
                                  for Fd ′ are also consistent with the drag measurements shown in Fig. 1a. The high aspect ratio sea star model has
                                  higher Fd ′ than the low aspect ratio model, and the low aspect ratio star has higher Fd ′ than the spherical dome.

                                  CFD simulation results.          To supplement the experiments, we pursued CFD simulations in ANSYS Fluent
                                  for a subset of the sea star models, the spherical dome, and several related geometries. The additional shapes
                                  (hemisphere, cone, pyramid, triangular prism; see Fig. 5) were created to have the same frontal area and height
                                  as the sea star. For the triangular prism, the streamwise length was set to be similar to the base width of the sea
                                  star model, L = 19 cm, such that the prism cross-section was identical to the midplane cross-section of the

Scientific Reports |   (2021) 11:4513 |                 https://doi.org/10.1038/s41598-021-83961-z                                                      3

                                                                                                                                                   Vol.:(0123456789)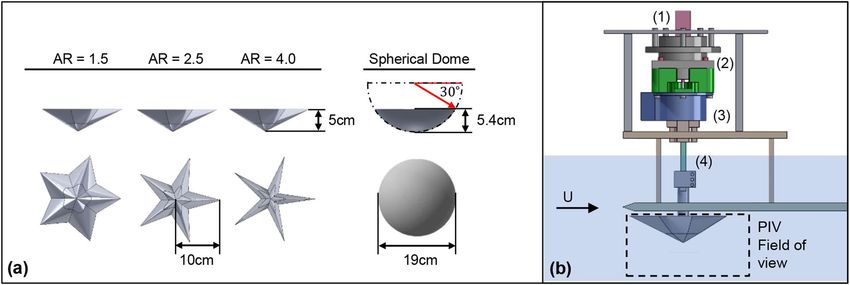
www.nature.com/scientificreports/
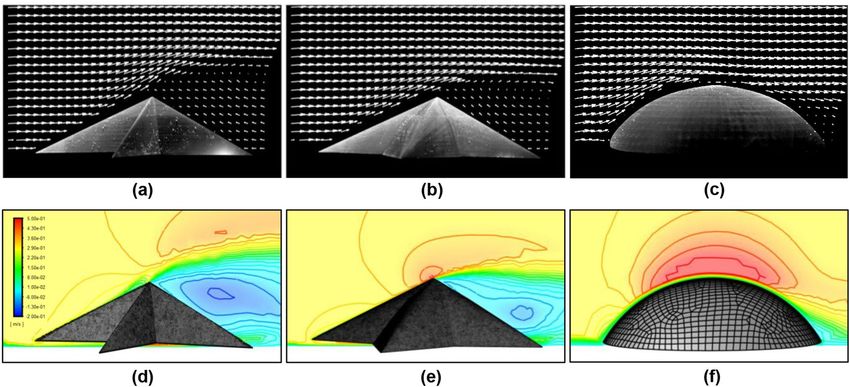
Figure 3. Mean flow visualization from experiments (a–c) and CFD simulations (d–f) for: AR = 4.0 sea
star model (a,c); AR = 1.5 sea star model (b,e); and spherical dome (c,f). The experiments show results for
U = 0.47 ± 0.01 ms−1 while the simulations were performed for U = 0.35 ms−1. Panels (a–c) show the vector
field estimated from PIV while panels (d–f) show contours of the mean velocity in the streamwise direction.
All panels show the flow field at the central (or median) plane of the models. The sea star models are oriented at
= 0◦. Figure created using Ansys Fluent 2019 R2 https://www.ansys.com/.
Model FL ′ [Nm−1] Fd ′ [Nm−1]
Sea star, AR = 4.0 − 1.32 5.94
Sea star, AR = 1.5 − 1.19 4.06
Spherical dome 2.41 3.27
Table 1. Mean values for lift ( FL ′ ) and drag ( Fd ′ ) per unit length estimated from control volume analyses of
planar vector fields obtained from PIV.
sea star model shown in Fig. 3a. These shapes were tested in water flow with an inlet speed of U = 0.35 ms−1.
Experimental data for the sea star and spherical dome models shown in Fig. 1 were linearly interpolated for
comparison at this flow speed.
As shown in Fig. 4, the drag and lift coefficients computed from the simulations agree, within uncertainty,
with the values obtained in experiments for the AR = 4.0 sea star and spherical dome. Further, as shown in
Fig. 3, the mean flow fields and wake structures obtained in the simulations are in good qualitative agreement
with the PIV results. For instance, the vertical extent of the wake region is largest for the AR = 4.0 sea star and
smallest for the spherical dome. These observations give us confidence that the CFD simulations can reasonably
reproduce the flow physics observed in the real world experiments.
The simulation results in Fig. 4b also suggest that downforce is not obtained for the pyramid or cone shapes,
despite these objects having a sharp apex similar to the sea star models. Downforce is only observed for the
triangular prism, and this downforce carries a significant drag penalty. These observations can be explained by
considering the pathline visualizations shown in Fig. 5. For the downforce-producing shapes, the pathline visu-
alizations show that the streamwise vorticity is negative (blue) on the left and positive (red) on the right side of
the shapes. This results in a significant upwelling of fluid from the central region of the wake into the freestream.
The momentum transport associated with this upwelling flow explains the high drag and negative lift generated
by the sea star models and the triangular prism. Pathlines near the apex for the cone and pyramid shapes also
show evidence of a similar arrangement in streamwise vorticity. However, pathlines at the base of the pyramid
and cone shapes show a reversal in sign for the streamwise vorticity: the streamwise vorticity is positive (red)
on the left and negative (blue) on the right, similar to the flow field observed around the spherical dome. This is
indicative of a downwelling flow that transports high momentum fluid from the freestream into the wake and
explains the lower drag and positive lift forces experienced by spherical dome, cone, and pyramid shapes. Note
that the pathlines and vorticity distributions around the base of the lift-producing spherical dome, cone, and
pyramid shapes in Fig. 5 are consistent with the horseshoe vortex systems typically observed in flows around
surface mounted bodies12,22,23. Visualizations for the sea star bodies do not show evidence of this horseshoe
vortex system.
Scientific Reports | (2021) 11:4513 | https://doi.org/10.1038/s41598-021-83961-z 4
Vol:.(1234567890)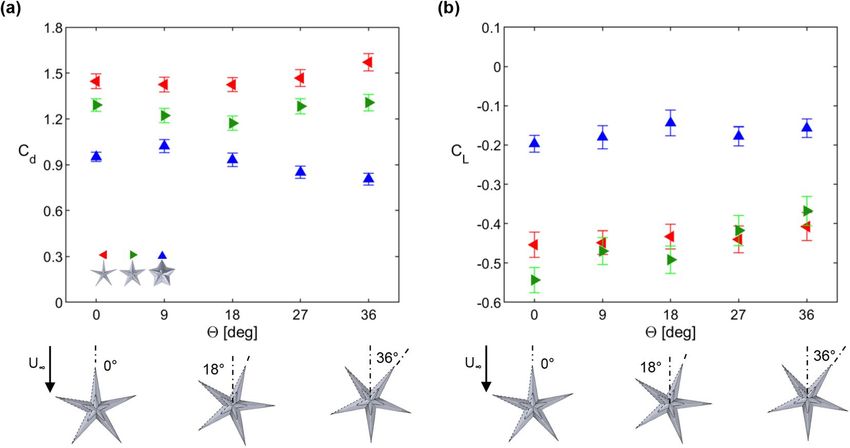
www.nature.com/scientificreports/
Figure 4. (a) Drag and (b) lift coefficients of models for experiments and simulations in a flow with speed
0.35 ms−1.
Figure 5. Pathlines of flow over a spherical dome, cone, pyramid, AR = 1.5 sea star, AR = 4.0 sea star, and
triangular prism. The pathlines are colored based on the local streamwise vorticity. Objects are placed in order
of descending lift force. Figure created using Ansys Fluent 2019 R2 https://www.ansys.com/.
Discussion
The ability to stay attached to surfaces plays an important role in sea star locomotion and survival. The results
presented in this study show that pentaradial sea star body shapes generate downforce independent of the incom-
ing flow direction. This downforce could help sea stars avoid hydrodynamic dislodgement.
Hayne and Palmer3 showed that Pisaster ochraceous sea stars exhibit significant morphological plasticity in
response to hydrodynamic conditions. Specifically, observations made in different environments showed a linear
relationship between mean wave speed and sea star aspect ratio. Transplant studies confirmed this trend: sea
stars moved into higher energy environments showed an increase in body aspect ratio. One hypothesis proposed
to explain this correlation was that the change in body shape may enable sea stars to better resist hydrodynamic
forces. Our results show that an increased aspect ratio produces a larger downforce, but this comes at the expense
of a larger drag force. In the present study, sea star height and frontal area were maintained constant across the
different aspect ratios tested. In contrast, the observations made by Hayne and Palmer3 indicate that the increase
in sea star aspect ratio is also accompanied by a decrease in height, i.e., sea stars exhibit higher aspect ratios and
reduced height in more energetic environments. It is possible that the high aspect ratio body shape generates
greater downforce while the reduction in height limits the drag penalty.
Sea stars may also prioritize downforce maximization over drag minimization. Per Martinez24, the following
condition, derived from a simple balance of moments, can be used to evaluate the possibility of animal detach-
ment in steady flows:
(Fd )h
> 1. (1)
(W − B − FL )(L/2)
Here Fd is the drag force, h is the height of the center of mass, W is the weight of the organism, B is buoyancy,
FL is the lift force, and L is the base length defined in Sect. 4. For a sea star of comparable size to the models
tested here, L ≈ 19 cm and h ≈ 5 cm, the net vertical force, W − B − FL , has approximately double the effect of
the horizontal drag force, Fd . Thus, the higher downforce may still be beneficial for sea stars staying attached to
surfaces despite the drag penalty incurred.
The preceding discussion suggests that the pentaradial body shape and morphological plasticity exhibited by
sea stars enable them to better resist hydrodynamic loads. Sea urchins are often found in the same environment
Scientific Reports | (2021) 11:4513 | https://doi.org/10.1038/s41598-021-83961-z 5
Vol.:(0123456789)www.nature.com/scientificreports/
Figure 6. (a) Schematic showing the sea star and spherical dome models tested in the experiments. (b)
Schematic of load cell-model attachment assembly, including: (1) servo for controlling orientation angle , (2)
bearing and load cell coupling mount, (3) ATI Gamma load cell, (4) linear servo for vertical positioning.
as sea stars and have a comparable biological adhesion m echanism25–27. Yet it is unlikely that the spiny spheroidal
geometry typical of sea urchins leads to downforce generation. A characterization of the hydrodynamic forces
acting on sea urchin body shapes may provide additional insight into how these organisms remain attached to
surfaces in energetic flow conditions.
Although the ability to generate downforce has been observed previously for bilaterally symmetric aquatic
organisms such as clams28 and crabs24, the orientation-independent nature of the downforce observed in this
study is unique to the pentaradial sea star geometry. bilaterally symmetric organisms must either be passively
aligned in the flow to generate downforce, as is the case for clams while swash-riding28, or actively posturing in
the flow, as is the case with crabs in certain flow c onditions24. In other words, bilaterally symmetric organisms
require some degree of passive or active reorientation to produce downforce for different flow directions. On
the other hand, sea star body shapes produce downforce independent of orientation relative to the flow. Since
downforce is not produced by radially symmetric spherical domes and cones, we suggest that the pentaradial
geometry of sea star bodies is unique in that it generates a hydrodynamic response that is similar to a (nearly)
two-dimensional triangular prism but also insensitive to the incoming flow direction. Our observations suggest
that the downforce generated by the sea star bodies and the triangular prism arises from the upwelling flow cre-
ated along the centerline, with the breakdown of the horseshoe vortex system around the base also playing a role.
We recognize that the present work has some important limitations. Specifically, we only consider a limited
range of (smooth) sea star morphologies in steady flow. Intertidal sea stars exhibit significant diversity in body
shape, size, and surface t exture29. Moreover, the intertidal zone is likely to be dominated by wave-driven unsteady
flows in which inertial effects (e.g., added mass) can also play a role1. Nevertheless, this study presents the first
evidence for downforce generation with pentaradial sea star body shapes. This orientation-independent down-
force could have important implications for sea star locomotion and survival.
Methods
Flow facility and experiment setup. All experiments were performed in a large-scale free surface water
channel facility in the Fluid-Structure Interactions laboratory at USC. This facility has a glass-walled test section
of length 7.6 m, width 0.9 m, and depth 0.6 m, and is capable of generating flows with freestream velocities up
to U ≈ 0.6 ms−1. As shown in Fig. 6b, 3D-printed sea star and spherical dome models were mounted towards
the leading edge a flat plate setup in the water channel. The models were mounted 3 cm from the leading edge
of the plate to limit boundary layer development and positioned 5 mm from the plate surface. This distance was
chosen to approximate the height of the tube feet (or podia) below the sea stars. Additional force measurements
conducted with the models placed 25 mm from the plate surface showed very similar trends to the results pre-
sented in Sect. 2.1. A positioning system was used to precisely control model orientation with respect to flow
and vertical distance with respect to the smooth plate surface. An Arduino and a high torque Hitec servo motor
controlled the rotation system. An Actuonix linear servo motor with 100 mm stroke controlled the vertical
positioning. The models were tested in flows with freestream velocity ranging from roughly U ≈ 0.24 ms−1 to
U ≈ 0.47 ms−1. A Laser Doppler Velocimeter (MSE miniLDV) placed 3 m downstream from the end of the flat
plate setup was used to monitor the flow speed.
The models tested in the experiments were designed using SolidWorks and manufactured from polylactic
acid (PLA) using a Prusa i3 3D-printer. Hydrodynamic forces on the models were measured using an ATI
Gamma 6-axis load cell. A PIV system comprising a 5 W 532 nm continuous wave laser and a Phantom VEO
high-speed camera was used for flow visualization and control volume analyses. All measurements were made
with the models placed below the plate to eliminate free surface effects. A special faring was designed to isolate
the positioning system above the flat plate from the flow, thereby ensuring that the forces measured originated
from the models alone. Additional details are provided in the subsections below.
Scientific Reports | (2021) 11:4513 | https://doi.org/10.1038/s41598-021-83961-z 6
Vol:.(1234567890)www.nature.com/scientificreports/
AR = 4.0 AR = 2.5 AR = 1.5 Spherical dome
Length, L [m] 0.19 0.19 0.19 0.19
Planform area, Ap [10−3 m 2 ] 8.9 9.7 16.1 28.4
Frontal area, Af [10−3 m 2 ] 4.8 4.8 4.8 7.4
Table 2. Lengths and areas for experimental models. For the sea star models, L = 19 cm corresponds to the
frontal width when one of the arms is oriented into the flow, = 0◦.
3D‑printed models. The sea star models were created in SolidWorks by circular patterning an arm of speci-
fied aspect ratio around the central axis. Each arm profile is formed from a conic line of curvature γ = 0.75,
length 10 cm and apex height 5 cm, as shown in Fig. 6. Three different sea star models were created by varying
the arm width at the base, resulting in models with aspect ratios AR = 4.0, AR = 2.5, and AR = 1.5. Here, the
aspect ratio is defined as the ratio between the arm length from distal tip to the central axis (10 cm) and the
width at the base arm intersections.
The spherical dome used in this study is the top slice of a sphere with radius 11 cm. The slicing plane was
placed at 30◦ from the bisecting plane such that the base diameter for the dome was comparable to the frontal
width of the sea star models, L = 19 cm, and the height of the dome was comparable to the apex height of the
sea star, 5.4 cm. Frontal and planform areas for the models are shown in Table 2. All models were designed with
a cylindrical clamp at the base that connected with the positioning system.
Load cell measurements. The hydrodynamic drag and lift forces acting on the models were measured
using an ATI Gamma 6-axis load cell capable of 0.00625N resolution in lateral forces and 0.0125 N resolution
in vertical forces. Data from the load cell were logged to a PC using a 16-bit data acquisition system (National
Instruments NI PCIe-6321). The sampling rate was set to 5kHz based on load cell manufacturer specifications.
For each configuration, force data were collected for 60 s, yielding 300,000 samples. Prior to each measurement
made in flow, a zero reading was collected to eliminate the effects of model weight, buoyancy, and load cell drift
error from the measured hydrodynamic forces.
Following standard convention, the measured drag and lift forces were converted into drag and lift coef-
ficients and expressed as a function of the Reynolds number. These dimensionless parameters were calculated
using the following relations:
2Fd
Cd =
ρ Af U 2
, (2)
2FL
CL =
ρ Ap U 2
, (3)
UL
Re = , (4)
ν
where ρ is fluid density, U is freestream velocity, Af is model frontal area, Ap is model planform area, L is a char-
acteristic length, and ν is the kinematic viscosity. The fluid density and kinematic viscosity were set to values
expected for water at ambient temperature 20 ◦C. Note that the drag coefficient is calculated using frontal area
while the lift coefficient is calculated using the planform area.
PIV and control volume analysis. The two-dimensional, two-component PIV system comprised a 5 W
532 nm continuous laser and a Phantom VEO 410 L high-speed camera fitted with a 50 mm f/1.4 Nikon lens.
The camera recorded images at a rate of 400 Hz and the spatial resolution for the experiments was 0.23 mm per
pixel. Because the laser sheet was not wide enough to illuminate both the fore and aft sections of the model, we
fixed the position of the camera and moved the laser to obtain two sets of images that were then spliced together
at the center of the object. Because of this splicing, we only report mean velocities and force estimates obtained
after averaging over 997 frame-pairs. We used PIVLAB30 for background correction and subsequent PIV analy-
ses. We used a multi-pass fast Fourier transform algorithm for the PIV analysis with a final interrogation window
of size 32 × 32 pixels and 50% overlap.
The vector field data obtained from PIV were used to estimate lift and drag forces per unit length using a
control volume approach. Specifically, for a fixed control volume and steady state conditions, the hydrodynamic
force (F) can be estimated using the following relation
ρ(u · n)u dS = F, (5)
S
in which S is the control surface bounding the control volume that encompasses the body, u is the velocity vector,
n is the outward normal for the control surface, and F is the force imparted on fluid by the body. Though we do
not have access to the full three-dimensional flow field from PIV, we can estimate drag and lift forces per unit
Scientific Reports | (2021) 11:4513 | https://doi.org/10.1038/s41598-021-83961-z 7
Vol.:(0123456789)www.nature.com/scientificreports/
length acting on the body (Fd ′, FL ′) by considering a planar approximation to Eq. (5). Separating the momentum
conservation relation into the streamwise (x) and wall-normal (y) directions, Fd ′ and FL ′ can be estimated using:
2 2
ρ uin dy − vtop utop dx − uout dy = Fd ′ (6)
H W H
and
2
ρ uin vin dy − vtop dx − uout vout ey dy = FL ′ (7)
H W H
where uin and vin are the streamwise and wall-normal velocities at the upstream (inlet) of the control area, uout
and vout are the velocities at the downstream (outlet), and utop and vtop are the velocities at the upper bounding
surface. The height of the control area is H and the width is W.
CFD simulation setup. ANSYS Fluent was used to simulate the flow field over the sea star and spherical
dome models tested in the experiments, as well as several related geometries. These simulations were carried out
using a coupled pressure-velocity method with a built-in steady-state k − ǫ turbulence model. The coefficients
of the turbulence model were set to the default settings. For all models, the outer flow mesh was a coarse hex-
dominant grid. For the near-field flow around the object and for three body-lengths downstream from the rear
edge of the models, a fine tetrahedral mesh was used. This also ensured that the sharp geometries involved near
the apex of the sea star, pyramid, cone, and triangular prism geometries were adequately resolved. Convergence
tests indicated that meshes with roughly 800,000 elements provided a reasonable balance between accuracy and
speed. For example, doubling the number of mesh elements beyond this value led to changes of ≤ 4% in the
computed drag and lift forces for the highest aspect ratio sea star model.
For all the simulations, the working fluid was assumed to be water at 20 ◦ C. The models were set 5 mm from
the bounding floor in the simulation and 3 cm the edge of the plate, consistent with the experiment setup shown
in Fig. 6. The inlet velocity was set at U = 0.35 ms−1, which is roughly the midpoint of the velocity range tested
in the experiments.
Received: 29 October 2020; Accepted: 18 January 2021
References
1. Helmuth, B. & Denny, M. W. Predicting wave exposure in the rocky intertidal zone: do bigger waves always lead to larger forces?.
Limnol. Oceanogr. 48, 1338–1345 (2003).
2. Santos, R., Gorb, S., Jamar, V. & Flammang, P. Adhesion of echinoderm tube feet to rough surfaces. J. Exp. Biol. 208, 2555–2567
(2005).
3. Hayne, K. J. & Palmer, A. R. Intertidal sea stars (pisaster ochraceus) alter body shape in response to wave action. J. Exp. Biol. 216,
1717–1725 (2013).
4. Orton, J. & Fraser, J. Rate of growth of the common starfish, asterias rubens. Nature 126, 567–567 (1930).
5. Feder, H. M. Growth and predation by the ochre sea star, pisaster ochraceus (brandt), in monterey bay, california. Ophelia 8,
161–185 (1970).
6. Schlichting, H. Experimental investigation of the problem of surface roughness. NACA Tech. Memor. 823, 2 (1937).
7. Jimenez, J. Turbulent flows over rough walls. Annu. Rev. Fluid Mech. 36, 173–196 (2004).
8. Hoerner, S. F. Fluid-dynamic drag. Hoerner Fluid Dyn. (1965).
9. Hoerner, S. Fluid-dynamic lift. Hoerner Fluid Dyn. (1985).
10. Schofield, W. & Logan, E. Turbulent shear flow over surface mounted obstacles. J. Fluids Eng. 112, 376–385 (1990).
11. da Silva, B. L., Chakravarty, R., Sumner, D. & Bergstrom, D. J. Aerodynamic forces and three-dimensional flow structures in the
mean wake of a surface-mounted finite-height square prism. Int. J. Heat Fluid Flow 83, 108569 (2020).
12. Savory, E. & Toy, N. Hemisphere and hemisphere-cylinders in turbulent boundary layers. J. Wind Eng. Ind. Aerodyn. 23, 345–364
(1986).
13. Taniguchi, S., Sakamoto, H., Kiya, M. & Arie, M. Time-averaged aerodynamic forces acting on a hemisphere immersed in a tur-
bulent boundary. J. Wind Eng. Ind. Aerodyn. 9, 257–273 (1982).
14. Wood, J. N., De Nayer, G., Schmidt, S. & Breuer, M. Experimental investigation and large-eddy simulation of the turbulent flow
past a smooth and rigid hemisphere. Flow Turbul. Combust. 97, 79–119 (2016).
15. Ikhwan, M. & Ruck, B. Wind load coefficients for pyramidal buildings. Proc. 12. GALA-Tagung Lasermethoden in der Stro-
mungmesstechnik, B. Ruck, A. Leder, D. Dopheide (Ed.), Karlsruhe, Deutschland (2004).
16. Martinuzzi, R. & AbuOmar, M. Study of the flow around surface-mounted pyramids. Exp. Fluids 34, 379–389 (2003).
17. Vosper, S. Three-dimensional numerical simulations of strongly stratified flow past conical orography. J. Atmos. Sci. 57, 3716–3739
(2000).
18. Okamoto, T., Yagita, M. & Kataoka, S.-I. Flow past cone placed on flat plate. Bull. JSME 20, 329–336 (1977).
19. Gaster, M. Vortex shedding from slender cones at low reynolds numbers. J. Fluid Mech. 38, 565–576 (1969).
20. Iungo, G. V. & Buresti, G. Experimental investigation on the aerodynamic loads and wake flow features of low aspect-ratio trian-
gular prisms at different wind directions. J. Fluids Struct. 25, 1119–1135 (2009).
21. Heist, D. & Gouldin, F. Turbulent flow normal to a triangular cylinder. J. Fluid Mech. 331, 107–125 (1997).
22. Baker, C. The laminar horseshoe vortex. J. Fluid Mech. 95, 347–367 (1979).
23. Baker, C. The turbulent horseshoe vortex. J. Wind Eng. Ind. Aerodyn. 6, 9–23 (1980).
24. Martinez, M. M., Full, R. & Koehl, M. Underwater punting by an intertidal crab: a novel gait revealed by the kinematics of pedes-
trian locomotion in air versus water. J. Exp. Biol. 201, 2609–2623 (1998).
25. Hennebert, E. et al. Sea star tenacity mediated by a protein that fragments, then aggregates. Proc. Nat. Acad. Sci. 111, 6317–6322
(2014).
26. Lengerer, B. et al. Interspecies comparison of sea star adhesive proteins. Philos. Trans. R. Soc. B 374, 20190195 (2019).
27. Pjeta, R. et al. Integrative transcriptome and proteome analysis of the tube foot and adhesive secretions of the sea urchin paracen-
trotus lividus. Int. J. Mol. Sci. 21, 946 (2020).
Scientific Reports | (2021) 11:4513 | https://doi.org/10.1038/s41598-021-83961-z 8
Vol:.(1234567890)www.nature.com/scientificreports/
28. Ellers, O. Form and motion of donax variabilis in flow. Biol. Bull. 189, 138–147 (1995).
29. Paine, R. T. Food web complexity and species diversity. Am. Nat. 100, 65–75 (1966).
30. Thielicke, W. & Stamhuis, E. Pivlab-towards user-friendly, affordable and accurate digital particle image velocimetry in matlab. J.
Open Res. Softw. 2, 1 (2014).
Acknowledgements
This work was supported by the US Office of Naval Research under grant number N00014-17-1-2062 (Program
Manager : Dr. Thomas McKenna). The authors would also like to thank Mike Tolley, Eva Kanso, Matt McHenry,
and Michael Ishida for the useful discussions related to this work.
Author contributions
M.H. and M.L. conceived the experiments, M.H. conducted the experiments, and M.H. and M.L. analyzed the
results. All authors reviewed the manuscript.
Competing interests.
The authors declare no competing interests.
Additional information
Correspondence and requests for materials should be addressed to M.H.
Reprints and permissions information is available at www.nature.com/reprints.
Publisher’s note Springer Nature remains neutral with regard to jurisdictional claims in published maps and
institutional affiliations.
Open Access This article is licensed under a Creative Commons Attribution 4.0 International
License, which permits use, sharing, adaptation, distribution and reproduction in any medium or
format, as long as you give appropriate credit to the original author(s) and the source, provide a link to the
Creative Commons licence, and indicate if changes were made. The images or other third party material in this
article are included in the article’s Creative Commons licence, unless indicated otherwise in a credit line to the
material. If material is not included in the article’s Creative Commons licence and your intended use is not
permitted by statutory regulation or exceeds the permitted use, you will need to obtain permission directly from
the copyright holder. To view a copy of this licence, visit http://creativecommons.org/licenses/by/4.0/.
© The Author(s) 2021
Scientific Reports | (2021) 11:4513 | https://doi.org/10.1038/s41598-021-83961-z 9
Vol.:(0123456789)You can also read