Seismic imaging across fault systems in the Abitibi greenstone belt - an analysis of pre- and post-stack migration approaches in the Chibougamau ...
←
→
Page content transcription
If your browser does not render page correctly, please read the page content below
Solid Earth, 12, 1143–1164, 2021
https://doi.org/10.5194/se-12-1143-2021
© Author(s) 2021. This work is distributed under
the Creative Commons Attribution 4.0 License.

Seismic imaging across fault systems in the Abitibi greenstone belt –
an analysis of pre- and post-stack migration approaches in the
Chibougamau area, Quebec, Canada
Saeid Cheraghi1 , Alireza Malehmir2 , Mostafa Naghizadeh1 , David Snyder1 , Lucie Mathieu3 , and Pierre Bedeaux3
1 Mineral Exploration Research Centre, Harquail School of Earth Sciences, Goodman School of Mines,
Laurentian University, Sudbury, Ontario, Canada
2 Department of Earth Science, Uppsala University, Uppsala, Sweden
3 Centre d’études sur les ressources minérales (CERM), Département des Sciences appliquées, Université du Québec

à Chicoutimi (UQAC), Chicoutimi, Québec, Canada

Correspondence: Saeid Cheraghi (scheraghi@laurentian.ca)

Received: 8 September 2020 – Discussion started: 30 September 2020
Revised: 19 March 2021 – Accepted: 23 March 2021 – Published: 19 May 2021

Abstract. Two high-resolution seismic reflection profiles ac-      tal reflector connects to a steeply dipping reflector. The Doda
quired north and south of Chibougamau, located in the north-       fault dips subvertical in the shallow crust but as a steeply dip-
east of the Abitibi subprovince of Canada, help understand         ping reflection set at depth. Nearby gold showings suggest
historic volcanically hosted massive sulfide (VMS) deposits        that these faults may help channel and concentrate mineral-
and hydrothermal Cu–Au mineralization found there. Ma-             izing fluids.
jor faults crossed by the profiles include the Barlow fault
in the north and the Doda fault and the Guercheville fault
in the south, all targets of this study that seeks to determine
spatial relationships with a known metal endowment in the          1   Introduction
area. Common-offset DMO corrections and common-offset
pre-stack time migrations (PSTMs) were considered. Irregu-         Acquiring and processing a high-resolution seismic data set
larities of the trace midpoint distribution resulting from the     over Archean greenstone belts comprised of crystalline rocks
crooked geometry of both profiles and their relative contribu-     characterized by steeply dipping reflectors, point scatters,
tion to the DMO and PSTM methods and seismic illumina-             and multiple folded or faulted structures challenges basic as-
tion were assessed in the context of the complex subsurface        sumptions of the technique (Adam et al., 2000, 2003). Dur-
architecture of the area. To scrutinize this contribution, seis-   ing the past 30 years, pre-stack normal moveout (NMO) and
mic images were generated for offset ranges of 0–9 km us-          dip moveout (DMO) corrections followed by post-stack mi-
ing increments of 3 km. Migration of out-of-plane reflections      gration represented the conventional method used in most
used cross-dip element analysis to accurately estimate the         crystalline rock case studies globally, with different success
fault dip. The seismic imaging shows the thickening of the         rates for both 2D and 3D data sets (Malehmir et al., 2012,
upper-crustal rocks near the fault zones along both profiles.      and references therein). The post-stack migration method has
In the northern seismic reflection section, the key geological     provided sharp images in many case studies (Juhlin, 1995;
structures identified include the Barlow fault and two diffrac-    Juhlin et al., 1995, 2010; Bellefleur et al., 1998, 2015; Per-
tion sets imaged within the fault zone that represent potential    ron and Calvert, 1998; Ahmadi et al., 2013); however, all
targets for future exploration. The south seismic reflection       these studies indicate low signal-to-noise (S/N) ratios and
section shows rather a complicated geometry of two fault           scattering rather than a coherent reflection of the seismic
systems. The Guercheville fault observed as a subhorizon-          waves. Petrophysical measurements, where available, com-
                                                                   plemented with reflectivity or velocity models of the shal-

Published by Copernicus Publications on behalf of the European Geosciences Union.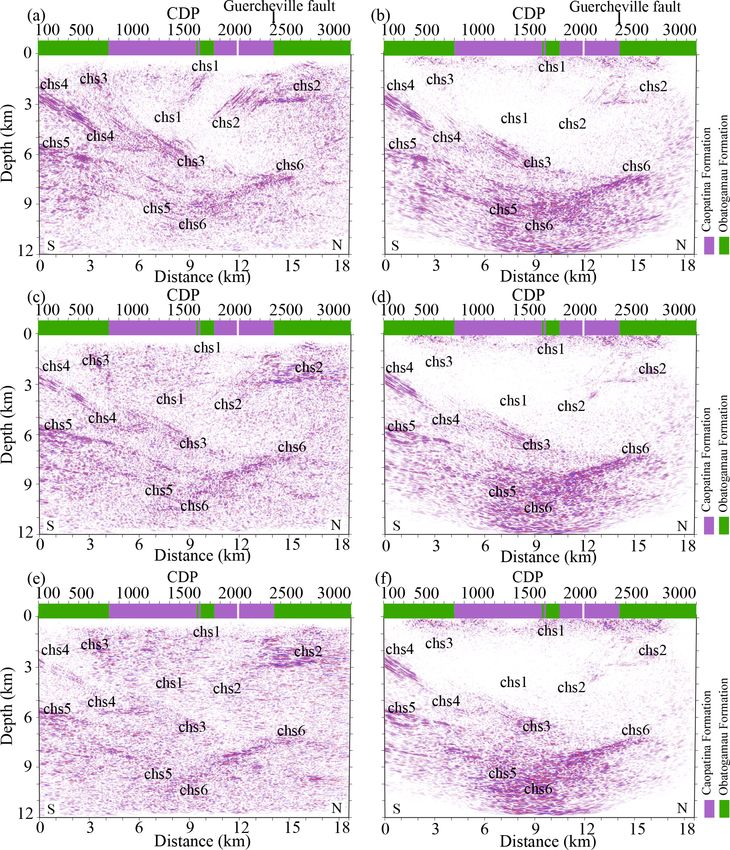
1144                                          S. Cheraghi et al.: Seismic imaging across fault systems of Chibougamau area

low crust, i.e., < 1000 m, permit a more accurate correla-          to aid upper-crustal-scale studies of metal-endowed fault
tion of reflections to geological structures (Perron et al.,        structures. The Chibougamau area mostly hosts volcanically
1997; Malehmir and Bellefleur, 2010). The Kirchhoff pre-            hosted massive sulfide (VMS) (e.g., Mercier-Langevin et al.,
stack time or depth migration (PSTM or PSDM) method                 2014) and Cu–Au magmatic–hydrothermal mineralization
has also been utilized in crystalline rock environments (e.g.,      (Pilote et al., 1997; Mathieu and Racicot, 2019). Orogenic
Malehmir et al., 2011; Singh et al., 2019), but computational       Au mineralization also documented in this area (Leclerc et
complexity and the requirement of a detailed velocity model         al., 2017) typically relates to crustal-scale faults, hence the
limited the wide application of a PSTM algorithm (Fowler,           importance to document the geometry of major faults during
1997). In addition, strong scattering of seismic waves, low         exploration (Groves et al., 1998; Phillips and Powell, 2010).
S/N ratios, and small-scale changes in acoustic impedance           In order to image fault systems in the Chibougamau area, we
within crystalline rock environments rendered both PSTM             generated DMO stacked migrated sections as well as images
and PSDM algorithms less popular in a crystalline rock envi-        generated with a PSTM algorithm. We inclusively investi-
ronment (Salisbury et al., 2003; Heinonen et al., 2019; Singh       gated the surveys’ acquisition geometries and their effects
et al., 2019; Braunig et al., 2020). An important, somewhat         on the DMO and PSTM to optimize these processing flows
neglected issue is the effect of survey geometry on process-        according to the specific geometry. We compare the results
ing results and whether it is possible to adjust the processing     from both methods. We show that strategy and criteria used
flow to compensate for underperformance caused by the sur-          to design our processing flow favor the specific acquisition
vey geometry, for example the effect of crooked survey. An          geometries of each profile in order to enhance coherency of
optimized processing flow appears essential in order to im-         the seismic reflections in both shallow and deeper crust. To
age deep mineral deposits and structures such as faults that        accomplish this goal, we (1) apply pre-stack DMO correc-
host base or precious metal deposits (Malehmir et al., 2012,        tions followed by post-stack migration along both profiles;
and references therein).                                            (2) analyze the application of a PSTM algorithm on both
   Apart from the type of migration method (i.e., post-stack        surveys; (3) specifically test the CMP offset distribution and
migration, PSTM, or PSDM), the survey design parameters,            its contribution to DMO corrections and PSTM with an off-
such as survey length, orientation, number of shots and re-         set range of 0–9 km; and (4) address the effect of cross-dip
ceivers, and shot and receiver spacing, are major factors that      offsets and their relevant time shifts on the imaged reflec-
affect the seismic illumination for both 2D and 3D surveys          tions. Our optimized application of DMO and PSTM con-
(Vermeer, 1998). A seismic study in Brunswick, Canada,              tributes information on the geometry of the faults in the Chi-
showed that 2D seismic surveys provided high-resolution             bougamau area, which is essential to understand mineral-
seismic images of the upper crust, but a 3D survey acquired         ization potential in the area and to target regions of higher
over the same area failed to provide more details mostly be-        prospectivity. In this study we emphasize the adjustments
cause of survey design (Cheraghi et al., 2011, 2012). Typi-         of the processing flow that increase the seismic illumination
cally, crystalline rock seismic surveys in forested regions use     of reflectors associated with fault systems. The interpreta-
crooked-line profiling along forest tracks or logging roads         tion of the fault kinematics requires inclusive field measure-
for logistic and ultimately economic or environmental con-          ments and tectonic studies beyond the scope of this study.
siderations. Whereas 2D seismic processing algorithms are           Mathieu et al. (2020b) interpreted the regional seismic pro-
designed to work on straight survey lines with regular offset       file that encompasses our sections (Fig. 1) regarding the geo-
distribution of trace midpoint (CMPs), the crooked surveys          logical structure and tectonic evolution down to Moho depth
violate those assumptions and need compensating strategies          (∼ 36 km).
such as dividing the crooked survey into several straight
lines, 3D swath processing, or cross-dip analysis (Adam et
al., 1998, 2000; Milkereit and Eaton, 1998; Schmelzbach             2   Geological setting
et al., 2007; Kashubin and Juhlin, 2010). More specifi-
cally, the offset distribution affects seismic illumination dur-    The Chibougamau area is located in the northeast portion
ing processing steps such as common-offset DMO correc-              of the Neoarchean Abitibi subprovince (Fig. 1). The oldest
tions or common-offset Kirchhoff PSTM algorithm (Fowler,            rocks in the study area (> 2760 Ma; David et al., 2011) in-
1997, 1998). The proficiency of both these methods demands          clude mafic and felsic lava flows as well as volcanoclastic
a regular distribution of source–receiver offsets because of        deposits of the Chrissie and Des Vents formations (Fig. 1,
their sensitivity to a constructive contribution of offset planes   see Leclerc et al., 2017; Mathieu et al., 2020b). These rocks
(Canning and Gardner, 1998; Cheraghi et al., 2012; Belle-           are overlain by sedimentary and volcanic rocks of the Roy
fleur et al., 2019; Braunig et al., 2020).                          Group, emplaced between 2730 and 2710 Ma and which con-
   This case study focuses on seismic sections along two 2D         stitute most of the covered bedrock (Leclerc et al., 2017;
high-resolution profiles, herein named the south and north          Mathieu et al., 2020b). The Roy Group includes a thick (2–
surveys (Fig. 1), both acquired in 2017 in the Chibouga-            4 km) pile of mafic and intermediate volcanic rocks topped
mau area, Quebec, Canada. These profiles were acquired              by a thinner assemblage of lava flows and pyroclastic and

Solid Earth, 12, 1143–1164, 2021                                                       https://doi.org/10.5194/se-12-1143-2021
S. Cheraghi et al.: Seismic imaging across fault systems of Chibougamau area                                               1145

sedimentary units (volcanic cycle 1, Leclerc et al., 2012,        3     Seismic data acquisition
2015), as well as a pile of mafic lava flows capped by a
thick (2–3 km in the north to 0.5 km in the south) succes-        The 2017 seismic survey in the Chibougamau area forms part
sion of intermediate to felsic lava flows and fragmental units    of the Metal Earth exploration project in the Abitibi green-
interbedded with sedimentary rocks (volcanic cycle 2). The        stone belt (Naghizadeh et al., 2019). High-resolution seismic
Roy Group is overlain by sandstone and conglomerate of            segments in the north and south coincide with and augment a
the 2700–2690 Ma Opémisca Group, which accumulated in             regional seismic line that crosses the main geological struc-
two sedimentary basins (Mueller et al., 1989; Leclerc et al.,     tures of the area (Fig. 1). Cheraghi et al. (2018) demonstrated
2017). The main rock exposures of the Roy Group, observed         that the Chibougamau regional survey capably imaged re-
along the southern profile, consist of pelitic to siliciclastic   flections in both the upper and lower crust (down to Moho
sedimentary rocks of the basin-restricted Caopatina Forma-        depth). Mathieu et al. (2020b) interpreted the regional seis-
tion (volcanic cycle 1 or Opémisca Group) and mafic to inter-     mic survey to map major faults and structures in relation to
mediate lava flows of the Obatogamau Formation (volcanic          geodynamic processes and potential metal endowment.
cycle 1).                                                            The high-resolution surveys in the Chibougamau area
   The rock units around the north profile include the            form the focus of this study. In total, the survey acquired
Bruneau Formation (mafic lava flows), the Blondeau For-           2281 vibrator points (VPs) along the north survey and
mation (intermediate to felsic, volcanic, volcanoclastic, and     3126 VPs along the south survey (Fig. 1). Consistent with
sedimentary deposits), and the Bordeleau Formation (volcan-       other high-resolution surveys in the Metal Earth project
oclastic deposits, arenite, conglomerate) of volcanic cycle 2,    (Naghizadeh et al., 2019), shot and receiver spacing were set
as well as sedimentary rocks of the Opémisca Group (Dim-          at 6.25 and 12.5 m, respectively, with a sampling rate of 2 ms.
roth et al., 1995; Leclerc et al., 2012). The major intrusions    Detailed attributes of both surveys are shown in Table 1.
relevant in the study area are the ultramafic to mafic sills of
the Cummings Complex, which intrude into the lower part of        3.1    Offset distribution for Kirchhoff PSTM and DMO
the Blondeau Formation (Bédard et al., 2009).                            corrections
   Several east-trending fault zones and synclinal or anti-
                                                                  Based on the analysis shown in Appendix A, both profiles
clinal structures are associated with Neoarchean deforma-
                                                                  could record alias-free P-wave energy at velocities necessary
tion events in the Chibougamau area (Dimroth et al., 1986;
                                                                  for seismic imaging in crystalline rock environments, i.e.,
Daigneault et al., 1990; Leclerc et al., 2012, 2017). The
                                                                  greater than 5000 ms−1 . Our analysis also indicates that both
main faults, folds, and associated schistosity and metamor-
                                                                  profiles are alias-free for shear waves and low-velocity noise,
phism relate to a Neoarchean N–S shortening event (Math-
                                                                  e.g., ground roll. We investigated the Chibougamau profiles
ieu et al., 2020b, and references therein). The north survey
                                                                  to evaluate irregularity and optimize the application of PSTM
lies nearly perpendicular to the major regional structures. It
                                                                  and DMO corrections. The offset distribution forms our main
crosses the west-striking Barlow fault zone, a shallowly to
                                                                  criterion with which to investigate the relative quality of
steeply south-dipping fault zone (Sawyer and Ben, 1993; Be-
                                                                  pre- and post-stacked migrated images in the Chibougamau
deaux et al., 2020). The field observations imply that the Bar-
                                                                  area based on common-offset PSTM (Fowler, 1997) and
low fault zone is a high-strain, back-thrust fault which sep-
                                                                  common-offset DMO correction (Hale, 1991; Fowler, 1998).
arates sedimentary rocks of the Opémisca Group from vol-
                                                                  In Appendix A we show the necessity of regular offset distri-
canic rocks of the Roy Group (Bedeaux et al., 2020). The
                                                                  bution when using common-offset DMO or PSTM (Fig. A1).
north survey also crosses the Waconichi syncline and the
                                                                  Other methods of DMO or PSTM, such as common-azimuth
steeply dipping, east-to-west-striking faults of the Waconichi
                                                                  PSTM (Fowler, 1997) and common-azimuth DMO correc-
Tectonic Zone (Fig. 1). The south survey passes through
                                                                  tions, should theoretically provide results equal to those as-
the Guercheville fault zone, which intersects the Druillettes
                                                                  suming common offset (Fowler, 1997, 1998). Our study did
syncline (Fig. 1), and north of the east-striking Doda fault
                                                                  not analyze common-azimuth algorithms. Besides the ef-
zone. The Doda fault zone appears subvertical at the sur-
                                                                  fect of regularity/irregularity of the survey, we also explain
face (Daigneault, 1996); the Guercheville fault dips north-
                                                                  in Appendix A that not necessarily all CMPs contribute to
ward at 30–60◦ but was mapped locally as a subvertical fault
                                                                  the DMO process (DMO illumination concept). Optimized
(Daigneault, 1996). Most of these faults form early basin-
                                                                  DMO illumination can be investigated during survey design
bounding faults (Opémisca basins) reactivated during the
                                                                  by testing different subsurface models or survey geometries
main shortening event (Dimroth, 1985; Mueller et al., 1989).
                                                                  (Beasley, 1993). The common-offset DMO and common-
                                                                  offset PSTM utilize similar algorithms for migration (Fowler,
                                                                  1997, 1998) and the illumination concept applies to PSTM as
                                                                  well.

https://doi.org/10.5194/se-12-1143-2021                                                     Solid Earth, 12, 1143–1164, 2021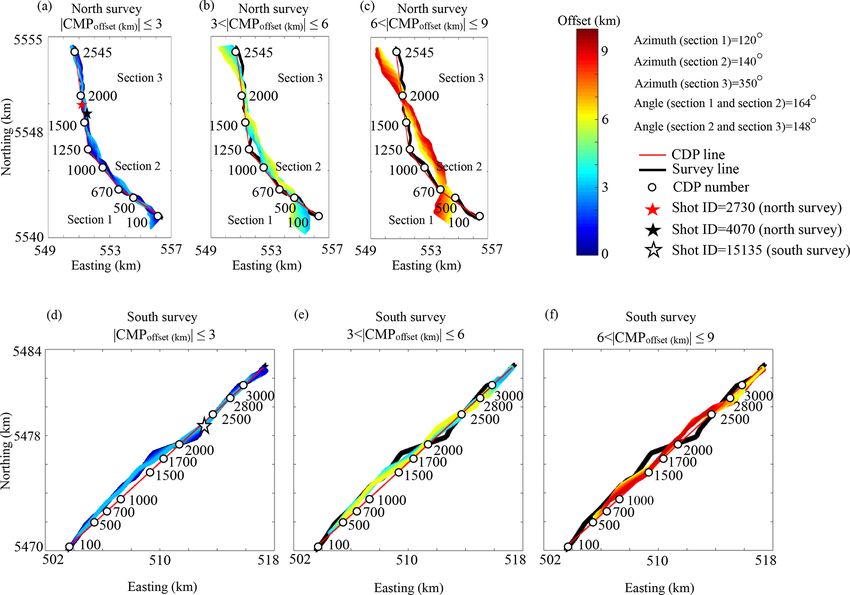
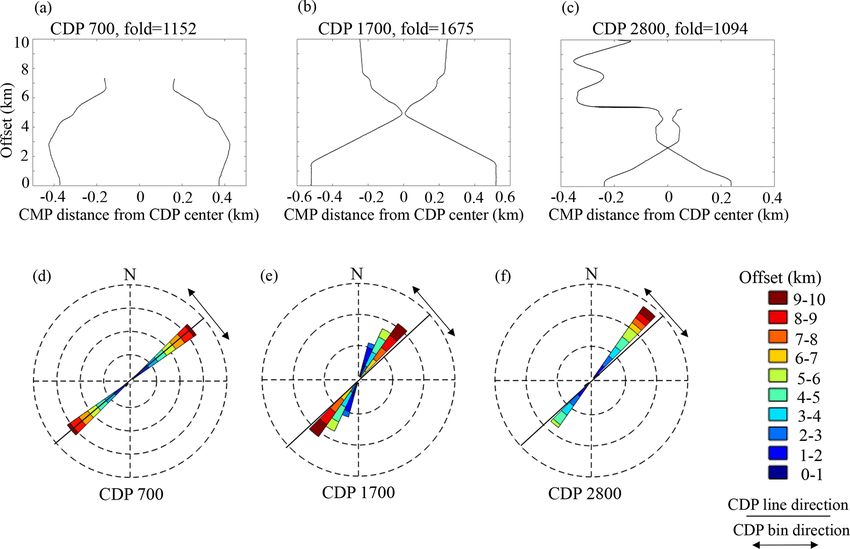
1146                                           S. Cheraghi et al.: Seismic imaging across fault systems of Chibougamau area

Figure 1. The geological map of the Chibougamau study area on which major fault zones in the vicinity of the high-resolution seismic
profiles are marked. The regional seismic survey and the high-resolution seismic surveys in the north and south of the area are located and
some of the CDP locations are marked. The inset shows the location of the study area within Canada and the Abitibi subprovince.

   The maximum offset in these Chibougamau surveys is                   regular offset and asymmetric azimuth distributions, for ex-
10 km. We evaluated whether specific offset values con-                 ample, Fig. 2a, d, e, and h from the north profile, and Fig. 3c
tribute constructively or destructively in the resulting PSTM           and f from the south profile. These CDP bins show that
or whether they generate artifacts during the DMO correc-               longer offsets are mapped unevenly in the bins resulting in
tions. We also investigated PSTM- and DMO-corrected im-                 an asymmetric azimuth distribution pattern. The analysis in-
ages at different offsets to find the offset range that optimizes       dicates that most of the irregularity of offset distribution oc-
subsurface illumination (Vermeer, 1998).                                curs due to a lack of longer offsets in those bins.
   For the Chibougamau profiles, we evaluated CMP distri-                  Based on the analysis shown in Figs. 2 and 3 and evaluat-
butions within common-depth-point (CDP) bins (6.25 m, Ta-               ing the distribution pattern of offset for the north and south
ble 2) along each survey. Figures 2 and 3 present examples              profiles, we predict that an irregular distribution of CMPs
of CMP offset and azimuth distribution along the north and              would be a challenge for 2D PSTM and DMO corrections.
south surveys, respectively. Some of the CDP bins show a                Another challenge is whether CMPs of profiles acquired in
regular offset distribution, for example, Fig. 2b and c from            the Chibougamau area contribute constructively in DMO or
the north profile or Fig. 3b from the south profile (note that          PSTM towards subsurface illumination considering the ge-
bins located in the middle of the survey have short and long            ometry of specific reflectors, i.e., dip and strike (more de-
offsets equally mapped north and the south of the bin cen-              tails in Appendix A). We designed offset planes with offset
ter). The azimuth distribution of these CDP bins also shows a           ranges of 0–3, 0–6, and 0–9 km in order to study the sur-
symmetric pattern relative to the CDP line directions, for ex-          vey geometry (Fig. 4). We chose these offset ranges based
ample, Fig. 2f and g from the north profile and Fig. 3e from            on the analysis shown in Figs. 2 and 3 and testing the effect
the south profile; however, some of the CDP bins present ir-            of various offset ranges on the process of post-stacked DMO

Solid Earth, 12, 1143–1164, 2021                                                            https://doi.org/10.5194/se-12-1143-2021
S. Cheraghi et al.: Seismic imaging across fault systems of Chibougamau area                                                    1147

Table 1. Data acquisition summary of the high-resolution Chibougamau north and south surveys (year 2017).

                                                                             High-resolution survey (R2)
                              Spread type                                    Split spread
                              Recording instrument                           Geospace GSX Node
                              Field data format                              SEGD (correlated)
                              Geophone type                                  5 Hz, single component
                              Source type                                    VIBROSEIS
                              No. of sources                                 3
                              Sweep length (s)                               28
                              No. of sweeps                                  1
                              Source starting frequency (Hz)                 2
                              Source ending frequency (Hz)                   120
                              Field low-cut recording filter (Hz)            2
                              Field high-cut recording filter (Hz)           207
                              Record length (s)                              12 after cross correlation
                              Sampling rate (ms)                             2
                              Shot spacing (m)                               6.25
                              Receiver spacing (m)                           12.5
                              Nominal maximum offset for processing (km)     10
                              Number of acquired shots                       2281a and 3126b
                              Survey length (km)                             ∼ 15a and ∼ 19b
                            a North survey. b South survey.

and PSTM images (see Table 2 for the processing details).              1. Reflection residual static corrections were applied to all
Offsets greater than 9 km did not increase the image qual-                shot gathers prior to the DMO corrections and PSTM
ity. In the north profile, CMPs with offsets ≤ 6 km cluster               application (steps 1–14 in Table 2).
along the survey line (Fig. 4a, b), whereas many CMPs with
offsets greater than 6 km do not (Fig. 4c). The CMPs of the            2. Constant DMO corrections with a velocity of
south profile lies along the survey line for all offset ranges            5500 ms−1 were applied for both the north and
(Fig. 4d, e, f) due to the less crooked pattern of the south              south surveys. This chosen velocity derived from
profile compared to the north profile (Fig. 4).                           several tests using various constant velocities between
                                                                          5000 and 6500 ms−1 , with step range of 100 ms−1 .
                                                                       3. After DMO corrections, velocity analysis with con-
4   Data processing and results
                                                                          stant stacking velocity in the range of 5000–6500 ms−1
We considered a pre- and post-stack processing workflow                   helped to design an optimized velocity model for NMO
for both the north and south profiles similar to that applied             corrections and the stacking (Table 2).
by Schmelzbach et al. (2007) and generated migrated DMO-               4. Choosing a velocity model for PSTM was a time con-
corrected stacked sections as well as Kirchhoff PSTM sec-                 suming procedure performed on the basis of trial and
tions (Table 2). The CMP distribution of the Chibougamau                  error. We tried constant velocity models at a range of
south survey lies mostly along a straight line; hence a linear            5000–6500 ms−1 (step rate of 100 ms−1 ) as well as the
CDP processing line was designed (Fig. 4). The CMP cover-                 velocity model applied for the DMO–NMO correction
age along the north profile follows a crooked pattern; hence              (see above). The best model adopted velocities within
a curved CDP line that smoothly follows this geometry was                 90 %–110 % of the DMO velocity model.
used (Fig. 4). The main processing steps included attenuation
of coherent and/or random noise, refraction, residual static         The DMO-corrected migrated stacked sections and PSTM
corrections, sharpening the seismic data using a deconvolu-          sections of the north and south survey appear in Figs. 5 and 6,
tion filter, and a top mute to remove first arrivals.                respectively. The offset range of 0–3 km reveals the most co-
   Based on the aforementioned analysis, we considered off-          herent reflections for both methods (Figs. 5a, b, 6a, b); the ve-
set ranges of 0–3, 0–6, and 0–9 km, for DMO corrections and          locity analysis after DMO corrections significantly improved
the PSTM. The following steps were also deemed necessary:            the coherency of the reflections for the sections with an off-
                                                                     set range of 0–3 km (Figs. 5a and 6a). The migrated sections
                                                                     generated from offset ranges of 0–6 and 0–9 km (Figs. 5c–f,
                                                                     and 6c–f) failed to improve the stacked sections. The stacked

https://doi.org/10.5194/se-12-1143-2021                                                           Solid Earth, 12, 1143–1164, 2021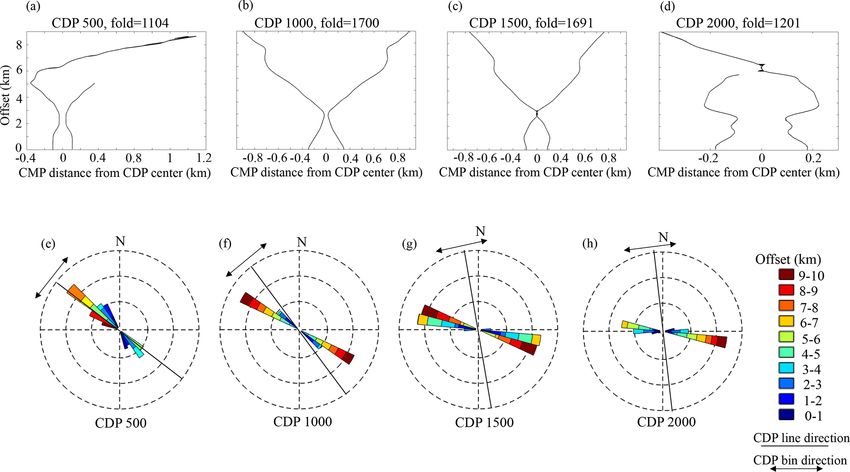
1148                                                      S. Cheraghi et al.: Seismic imaging across fault systems of Chibougamau area

Figure 2. CMP offset and azimuth distribution from the north survey. The offset distribution is shown for (a) CDP 500, (b) CDP 1000,
(c) CDP 1500, and (d) CDP 2000. See Figs. 1 and 4 for the location of the CDPs. The negative values for CMP distance in graphs (a–
d) indicate CMP is located in the south of the bin center and the positive values imply that CMP is located in the north of the bin center. The
azimuth distribution is shown for (e) CDP 500, (f) CDP 1000, (g) CDP 1500, and (h) CDP 2000. For each diagram shown in (e–h) the CDP
line direction is presented. The CDP bin is perpendicular to the CDP line.

Table 2. Processing parameters and attributes for the Chibougamau surveys.

                         Chibougamau north and south surveys
                  1      Read data in SEGD format and convert to SEGY for processing
                  2      Setup geometry, CDP spacing of 6.25 m
                  3      Trace editing (manual)
                  4      First arrival picking and top muting (0–10 km offset)
                  5      Elevation and refraction static corrections (replacement velocity 5200 ms−1 , V0 1000 ms−1 )
                  6      Spherical divergence compensation (V2 t)
                  7      Median velocity filter (1400, 2500, 3000 ms−1 )
                  8      Band-pass filter (5-20-90-110 Hz)a, b
                  9      Airwave filter
                  10     Surface-consistent deconvolutionc, d
                  11     Trace balancing
                  12     AGC (window of 150 ms)
                  13     Velocity analysis (iterative)
                  14     Surface consistent residual static corrections
                  15     DMO correctionsa, b (5500 ms−1 , offset range of 0–3, 0–6, and 0–9 km)
                  16     Velocity analysis (iterative at a range of 5000–6500 ms−1 )
                  17     Stacking
                  18     Coherency filtere, f
                  19     Trace balancing
                  20     Phase-shift time migrationa, b (velocity at surface and at 4 s is 5500 and 6200 ms−1 ?, respectively)
                  21     Kirchhoff PSTMa, b (after step 14 shown in this table; offset range of 0–3, 0–6, and 0–9 km)
                  22     Time to depth conversion (6000 ms−1 for both north and south surveys)
                a, b This is applied to both north and south surveys. c North survey: the filter length and gap are 100 and 16 ms, respectively. d South
                survey: the filter length and gap are 100 and 18 ms, respectively. e North survey: F–X deconvolution; filter length of 39 traces. f South
                survey: F–X deconvolution; filter length of 19 traces.

Solid Earth, 12, 1143–1164, 2021                                                                                     https://doi.org/10.5194/se-12-1143-2021
S. Cheraghi et al.: Seismic imaging across fault systems of Chibougamau area 1149
Figure 3. CMP offset and azimuth distribution from the south survey. The offset distribution is shown for (a) CDP 700, (b) CDP 1700, and
(c) CDP 2800. See Figs. 1 and 4 for the location of the CDPs. The negative values for CMP distance in graphs (a–c) indicate CMP is located
in the south of the bin center and the positive values imply that CMP is located in the north of the bin center. The azimuth distribution is
shown for (d) CDP 700, (e) CDP 1700, and (f) CDP 2800. For each diagram shown in (d–f) the CDP line direction is presented. The CDP
bin is perpendicular to the CDP line.
sections from the longer offsets (Figs. 5c, e and 6c, e) utilized curved feature or else a diffracted wave that collapsed to a
a velocity model similar to the one applied to Figs. 5a and 6a horizontal reflection after the migration.
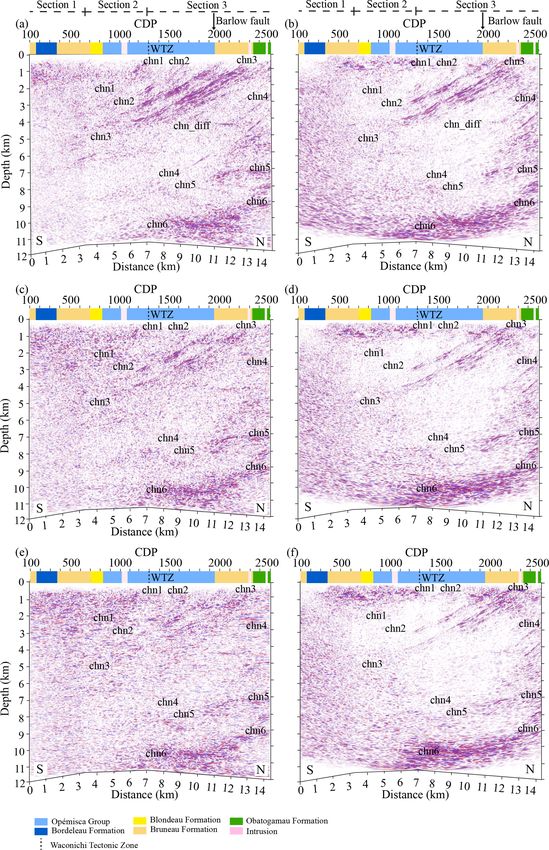
for stacking after DMO correction. The Chibougamau south survey mostly traverses mafic
The design of the north survey CDP line used three seg- to intermediate lava flows of the Obatogamau Formation
ments: CDPs 100–670 have an azimuth of 120◦ , CDPs 670– and sedimentary rocks of the Caopatina Formation (Fig. 6).
1250 have an azimuth of 140◦ , and CDPs 1250–2545 have The DMO stacked migrated (Fig. 6a) and PSTM sections
an azimuth of 350◦ (Fig. 4). Table 3 indicates geometrical (Fig. 6b) both show steeply dipping and subhorizontal re-
attributes of key reflections imaged along the north profile. flections in the upper crust, but upper-crustal reflections in
The first segment, ending at the contact between sedimen- the DMO stack section (Fig. 6a) show more coherency than
tary rocks of the Bordeleau Formation and mafic rocks of the those of the PSTM (Fig. 6b). Therefore, the DMO stack facil-
Bruneau Formation, appears seismically transparent without itates correlation with the surface geology. Reflection pack-
any prominent reflections (Fig. 5a, b). Labeled in Fig. 5, ages chs1, chs2, and chs3 mark the most prominent features
chn1, chn2, and chn3 mark the major reflections imaged in in the upper crust imaged along the south survey. The deeper
the upper crust. The most prominent reflection package of reflections include reflection chs4 at depths greater than 2 km
the north survey is chn3, with an apparent width of approxi- and two packages of steeply dipping reflections chs5 and
mately 3 km on the surface and an apparent thickness of ap- chs6 at depths greater than 6 km, together extending along
proximately 2 km (see Table 3 for detailed attributes). Re- 18 km length of the survey. Table 3 summarizes the geomet-
flections chn4, chn5, and chn6 imaged at depths greater than rical attributes of these reflections.
2 km could be related to a structure at the southern bound-
ary of the Barlow pluton (Fig. 1). The horizontal reflection
chn_diff, with a horizontal length of approximately 1 km, ap- 5 Cross-dip analysis
pears in the DMO stacked migrated section (Fig. 5a) and also
weakly in the PSTM section (Fig. 5b). Reflection chn_diff The analysis performed on offset distribution indicated that
intersects the chn4 reflections. The apparent geometry of the selecting a proper offset range, here 0–3 km, was crucial
chn_diff reflection in the migrated sections would suggest a for both DMO corrections and PSTM. Another factor that
could affect the imaging involves CMP locations relative to
https://doi.org/10.5194/se-12-1143-2021 Solid Earth, 12, 1143–1164, 20211150 S. Cheraghi et al.: Seismic imaging across fault systems of Chibougamau area Figure 4. CMP offset distribution at a range of 0–10 km for the north and the south survey in the Chibougamau area. The distribution for the north survey is shown for (a) CMPoffset(km) ≤ 3, (b) 3 < CMPoffset(km) ≤ 6, and (c) 6 < offsetCMPoffset(km) ≤ 9, and for the south survey it is shown for (d) CMPoffset(km) ≤ 3, (e) 3 < CMPoffset(km) ≤ 6, and (f) 6 < offsetCMPoffset(km) ≤ 9. The CDP line and the survey line are shown in the figure. Some shot and CDP locations are also shown. The azimuth of each section of the CDP line from the north survey and the angle between two sequential sections are presented. CDP bin centers. For the Chibougamau surveys, the maxi- First, the CMP offset relevant to a bin center and perpendicu- mum CMP offset perpendicular to the CDP line was about lar to the CDP line was calculated (Fig. 4). CDMO calculated ±0.4 km when an offset range of 0–3 km is considered for for dip angles varying from 40◦ to the west to 40◦ to the east processing (Fig. 4a and d). The 3D nature of subsurface with a step rate of 2◦ was then applied to DMO-corrected geology around a crooked-line survey requires that out-of- CMPs. Finally, we stacked DMO–CDMO-corrected traces plane features be evaluated, accounting for the time shifts using a velocity model designed from the one applied after from these features. When out-of-plane CMPs scatter or re- DMO corrections during standard processing (Table 2). Fur- flect seismic waves from steep structures off the CDP line ther velocity analysis checked whether the coherency of the (cross-dip direction), cross-dip analysis addresses time shifts reflections could be improved, but the new velocity model, of those structures and adjusts accordingly (for example, where different, showed less than ±5 % changes from the in- Larner et al., 1979; Bellefleur et al., 1995; Nedimovic and put model. An example of the CDMO analysis applied to the West, 2003; Rodriguea-Tablante et al., 2007; Lundberg and Chibougamau surveys appears in Figs. 7–9. Table 3 summa- Juhlin, 2011; Malehmir et al., 2011). Calculated time de- rizes which CDMO elements (i.e., toward east or west or no lays, called cross-dip moveout (CDMO) and treated as static cross dip) increase the coherency of the reflections when con- shifts, can be applied to both NMO- or DMO-corrected sec- sidering time delays associated with out-of-plane reflections. tions (Malehmir et al., 2011; Ahmadi et al., 2013). CDMO In the Chibougamau north survey, most of the seismic re- is sensitive to both velocity and the cross-dip angle applied; flectivity is observed at CDPs 700–2500 (Figs. 4 and 5), however, the variation in the angle appears more crucial for which include segments 2 and 3 of the processing line; as hard rock data (Nedimovic and West, 2003). such, we have performed the CDMO analysis for those two In this Chibougamau case study, we used DMO-corrected sections, separately. In segment 2 (CDPs 670–1250, Fig. 4), sections (constant velocity of 5500 ms−1 , Table 2) for reflections chn1, chn2, and chn3 appear with no cross-dip el- CDMO analysis, similar to a study by Malehmir et al. (2011). ement applied (Fig. 7c). The CDMO analysis of segment 2 Solid Earth, 12, 1143–1164, 2021 https://doi.org/10.5194/se-12-1143-2021
S. Cheraghi et al.: Seismic imaging across fault systems of Chibougamau area                                                      1151

(Fig. 7) did not reveal any significant reflectivity in the deeper   images (Figs. 5 and 6). The analysis summarized in Figs. 2
part of the section, i.e., 2–4 s (∼ 6–12 km, mid-crust). The         and 3 indicates that the survey geometry resulted in irregu-
CDMO analysis along segment 3 is shown as Fig. 8. Apply-             lar offset distribution in CDP bins, especially for longer off-
ing the westward CDMO increased the coherency of diffrac-            sets. The immediate effect of this irregularity was underper-
tion chn_diff. A diffraction package imaged at depths lesser         formance of DMO and PSTM for the longer offsets (Figs. 5
than 1 s (dashed area in Fig. 8c) is not imaged in the mi-           and 6). We explain in Appendix A that several factors in-
grated sections (Fig. 5). One horizontal reflection at a depth       cluding spatial attributes of the reflectors (i.e., dip and strike)
of approximately 11 km (∼ 3.5 s) between CDPs 1600–2000              and survey geometry (i.e., shot and receiver location) define
located within reflection package chn6 shows almost equal            the DMO illumination. Ideally, the impact of known subsur-
coherency independent of the applied cross dip to the east or        face architecture on DMO illumination should be analyzed
west (Fig. 8).                                                       before data acquisition at the survey design stage (Beasley,
   The CDMO analysis in the south profile was more chal-             1993; Ferber, 1997). In our study, the DMO illumination cri-
lenging because of interfering reflections that dip steeply to       teria can be extended to the PSTM process because common-
the north and to the south (Fig. 6). The CDMO analysis re-           offset DMO correction and common-offset PSTM utilize
sults for the south survey appear in Fig. 9 and Table 3. The re-     similar algorithms for migration (Fowler, 1997, 1998).
flection chs2 displays a complicated CDMO analysis (Fig. 9).            In the Chibougamau area, our strategy adjusted DMO and
With cross dip towards the west assumed, reflection chs2 be-         PSTM to find an offset range that better serves the con-
comes less steep (Fig. 9). Assuming a cross dip of 30◦ to the        cept of regularity. We performed detailed velocity analysis
west, chs2 dips 20◦ to the south (Fig. 9a), whereas with no          to design a velocity model producing the highest illumina-
CDMO correction it dips 40◦ to the south and features less           tion. The DMO and PSTM images with an offset range of 0–
continuity (Fig. 9c). With any cross-dip element towards the         3 km provided the most convincing images for both profiles
east applied, chs2 dips more steeply. Reflection chs2 dips 50◦       when considering only reflection coherency (Figs. 5a, b and
to the south with a cross-dip element of 40◦ to the east ap-         6a, b). Artifacts in the form of subhorizontal features appear
plied (Fig. 9f). CDMO analysis for reflection chs3 presents          in DMO sections where the longer offsets (0–6, and 0–9 km)
another complicated scenario. This reflection shows the same         are used to create the images (Figs. 5c, e, 6c, e). Such arti-
dip (40◦ ) and its coherency improves with an increasing west        facts disguise the DMO images of the surveys, especially in
cross-dip element (Fig. 9a–c). On the other hand, with an east       the upper crust at depths less than 6 km, and indicate a de-
cross-dip element applied, reflection chs3 becomes less steep        structive contribution of CMPs in the DMO process as pre-
(for example 20◦ in Fig. 9e versus 40◦ in Fig. 9c), and its co-      viously recognized in other surveys acquired in crystalline
herency decreases (Fig. 9c–f).                                       rock environments (Cheraghi et al., 2012). PSTM images of
                                                                     the both profiles (Figs. 5b, d, f and 6b, d, f) had less capa-
                                                                     bility to image steeply dipping reflection at depths less than
6     Discussion                                                     6 km. This could relate to either a lack of a detailed veloc-
                                                                     ity model or an inadequate contribution of CMPs, especially
The high-resolution seismic profiles acquired in the Chi-            for longer offsets. PSTM images of longer offsets do show
bougamau area present an essential case study to address             an adequate capability of preserving deeper reflections, for
the challenges of the application of the method in a crys-           example, reflection chn6 in Fig. 5d and f (cf. Fig. 5c and e,
talline rock environment. One goal of our research was to ad-        respectively) and reflections chs5 and chs6 in Fig. 6d and f
just the processing flow to improve subsurface illumination.         (cf. Fig. 6c and e, respectively).
To achieve this, we analyzed the performance of common-
offset DMO and PSTM. Another aspect of our research in-              6.2   Seismic interpretation in the Chibougamau area
volved geologic interpretation of the seismic sections, es-
pecially around the fault zones, that could unravel potential        Both surveys imaged several packages of reflections from the
zones for detailed mineral exploration. Detailed study of fault      near-surface down to 12 km (upper crust, Figs. 5 and 6). As
zones including age, kinematics, and alteration could provide        noted before, DMO stacked migrated sections and PSTM im-
more insight about mineral exploration but requires inclusive        ages with an offset range of 0–3 km presented more coherent
field investigation and petrography beyond the scope of our          reflections; thus our interpretation used the images shown
present study.                                                       in Figs. 5a and b and 6a and b. The geometrical attributes
                                                                     of the reflections are shown in Table 3. The geological map
6.1    The effect of survey geometry on seismic imaging              (Fig. 1) shows several fault zones in the Chibougamau area
                                                                     intersected by each profile. Both profiles show reasonable
The analysis performed on common-offset DMO and PSTM                 correlations of seismic reflections to the surface geology at
sections showed the importance of offset range and CMP dis-          depths less than 6 km. Some imaged reflectors may match
tribution on CDP bins and whether CMP offsets at ranges of           known faults. Here, the aim is to get geometrical attributes
0–10 km could all contribute constructively in the resulting         on the planar structures being imaged and to discuss possi-

https://doi.org/10.5194/se-12-1143-2021                                                          Solid Earth, 12, 1143–1164, 2021
1152 S. Cheraghi et al.: Seismic imaging across fault systems of Chibougamau area Figure 5. Migrated sections from the north survey considering an offset plane at a range of 0–9 km. DMO-corrected migrated section and PSTM section shown in (a) and (b), respectively, for an offset plane of 0–3 km, in (c), (d), respectively, for an offset plane of 0–6 km, and in (e) and (f), respectively, for an offset plane of 0–9 km. Prominent reflections are imaged in shallow and deep zones of the sections. For the interpretation of chn1, chn2, chn3, chn4, chn5, chn6, and chn_diff, see text. The survey includes three sections which are projected at the top of the image. The rock units along the survey path are projected at the top of each section with no dip in the contacts implied. The surface location of the Barlow fault is marked at the top of the section. Solid Earth, 12, 1143–1164, 2021 https://doi.org/10.5194/se-12-1143-2021
S. Cheraghi et al.: Seismic imaging across fault systems of Chibougamau area                                                                                                               1153

Table 3. Geometrical attributes of reflections imaged in the Chibougamau area.

                       Reflection                  CDP        Dip                     Dip             Subsurface extension                    CDMO                   CDMO
                       name                     location      (◦ )                    direction
  North profile                                                                                                                               Segment 2              Segment 3
                       chn1PF                800–1300         40                      South           Near surface down to ∼ 2 km             No cross dip           –
                       chn2PF                900–1700         40                      South           Near surface down to ∼ 3 km             10◦ to the east        10◦ to the east
                       chn3GC,BF            1000–2500         30                      South           Near surface down to ∼ 5 km             10◦ to the east        10◦ to the east
                       chn4PF               1500–2600         40                      South           2–7 km                                  –                      No cross dip
                       chn5GC               1800–2600         Subhorizontal           South           7–12 km                                 –                      12◦ to the west
                       chn6GC               1400–2600         Subhorizontal           South           7–12 km                                 –                      30◦ to the west
                       chn_diff             1900–2000         Horizontal              –               At depth of ∼ 4 km                      –                      12◦ to the west
  South profile                                                                                                                                                      CDMO
                       chs1GC               1600–1700         40                      South           Near surface down to ∼ 3 km             No cross dip
                       chs2GC,PF,GV         1700–2800         40                      South           1–5 km                                  Complicated structure for CDMO analysis∗
                       chs3GC                600–1800         40                      North           Near surface down to ∼ 7 km             Complicated structure for CDMO analysis∗
                       chs4GC,PF,DF           100–800         30                      North           2–5 km                                  30◦ to the west
                       chs5GC                100–1700         Steeply dipping         North           6–9 km                                  30◦ to the west
                       chs6GC               1700–2700         Steeply dipping         South           6–9 km                                  10◦ to the east
∗ The reflection package shows varying dip with cross dip to the east or west applied. See text for more details. GC The geological contact. PF The possible fault. BF The Barlow fault.
GV The Guercheville fault DF The Doda fault.

ble relationships to mapped faults (Fig. 1) without further                                                Reflection package chn3 occupies 3 km of the seismic sec-
investigation of the kinematics, alteration, age, and mineral-                                          tion (Fig. 5 and Table 3) and helps to interpret both the Bar-
ogy, which are not within the scope of this study. This helped                                          low fault and geological contacts in the north of the Chi-
us to map the major fault zones and interpret the seismic sec-                                          bougamau area (Figs. 1 and 5). At CDP 1950, reflections
tions. The CDMO analysis also served as a tool to investigate                                           within chn3 (see Table 3 for geometric attributes) correlate
the out-of-plane apparent dip of the reflection packages. The                                           to the contact between sedimentary rocks of the Opémisca
interpretation of each seismic profile follows.                                                         Group and mafic lava flows of the Bruneau Formation. This
                                                                                                        contact is overprinted by the Barlow fault at the surface
6.2.1      Seismic interpretation along the north profile                                               (Sawyer and Ben, 1993), and the migrated images (Fig. 5a, b)
                                                                                                        suggest that the fault dips at 30◦ to the south (Table 3; see
Migrated sections of the north profile (Fig. 5) show a gen-                                             also Bedeaux et al., 2020). The Barlow fault zone strikes
eral trend of south-dipping reflectors without any conflicting                                          east–west, and the northern seismic profile makes an angle
dips in the upper crust (depths less than 6 km). The contact                                            of ∼ 130◦ where it crosses the fault zone (Fig. 1). This would
of the Bruneau Formation (mafic volcanic rocks) with the                                                suggest that the true dip of the fault zone is steeper than
Opémisca Group (sedimentary rocks) and Obatogamau For-                                                  the apparent dip imaged in the migrated section (i.e., greater
mation (mafic to intermediate volcanic rocks) is likely the                                             than 30◦ ; Fig. 5a, b). Reflections within chn3 also correlate
major cause of the reflectivity in the upper crust (chn1, chn2,                                         with the contact of the Bruneau Formation (mafic rocks) and
chn3, and probably chn4 in Fig. 5). The reflection chn4 lies                                            Obatogamau Formation (mafic to intermediate lava flows)
within a seismically transparent zone and also separates the                                            at CDP 2400. We previously noted that the reflection pack-
deeper subhorizontal reflections sets (chn5 and chn6, Fig. 5)                                           age chn3 forms the most coherent package along the north
from the upper-crust steeply dipping reflections. The thick-                                            survey in the upper crust. The CDMO analysis around re-
ening of the upper-crust rocks around the reflection set chn3                                           flections chn3 (Fig. 8) would suggest a 0–10◦ strike towards
correlates with the Barlow fault and the regional Waconichi                                             the east (Fig. 8c and d, Table 3). Furthermore, these reflec-
syncline cored by a successor (Opémisca) basin (Fig. 5)                                                 tions became weakly imaged assuming a CDMO towards
(Matthieu et al., 2020b).                                                                               the west (Fig. 8a, b) or toward the east at dips greater than
   Reflection chn1 (Fig. 5, Table 3) at CDP 1300 projects                                               10◦ (Fig. 8e, f). Thus reflection set chn3 most likely origi-
to the surface within the sandstones and conglomerates of                                               nates within a complex structure, off the plane of the north
the Opémisca Group and may correspond to internal struc-                                                profile. It is possible that the Cummings sills located east
ture such as an unconformity or small fault that is part of                                             of the northern profile and near the Barlow fault contribute
the Waconichi Tectonic Zone or lithological variations inside                                           to the structures imaged as reflection package chn3. Finally,
the Opémisca Group. Similar to reflection chn1, reflection                                              the CDMO analysis also indicates an eastward apparent dip
chn2 (Fig. 5, Table 3) correlates with a local structure, i.e.,                                         for other upper-crustal reflection packages of the north pro-
a small fault or mafic and/or ultramafic lithology in outcrops                                          file (chn1 and chn2, Table 3). The seismic images shown in
of Opémisca Group rocks.

https://doi.org/10.5194/se-12-1143-2021                                                                                                          Solid Earth, 12, 1143–1164, 2021
1154 S. Cheraghi et al.: Seismic imaging across fault systems of Chibougamau area Figure 6. Migrated sections from the south survey considering an offset plane at a range of 0–9 km. DMO-corrected migrated section and PSTM section shown in (a) and (b), respectively, for an offset plane of 0–3 km, in (c) and (d), respectively, for an offset plane of 0–6 km, and in (e) and (f), respectively, for an offset plane of 0–9 km. Prominent reflections are imaged in shallow and deep zones of the sections. For the interpretation of chs1, chs2, chs3, chs4, chs5, and chs6, see text. The rock units along the survey path are projected at the top of each section with no dip in the contacts implied. The surface location of the Guercheville fault is marked at the top of the section. Figs. 5 and 8 suggest that the Barlow fault forms part of a terpretation. These reflections show westward cross-dip ele- steeply dipping structure (dip > 30◦ ) that dips slightly to- ments (Table 3). Mathieu et al. (2020b) suggested that reflec- wards the east. tors at those depths in northern Chibougamau represent im- Unless the north profile was extended beyond CDP 2600 brication between the Opatica plutonic belt and the Abitibi (Figs. 1 and 5), we cannot be sure that the reflection set chn4 greenstone belt. correlates to surface geology. The regional survey in the Chi- The DMO stacked section of the north survey and CDMO bougamau area (Mathieu et al., 2020b) does not show any analysis also provided insights into the diffractions within the surface correlation to these reflections at depth. The CDMO upper crust. Diffractions could be generated from spherical analysis did not show any prominent cross-dip elements for or elliptical (ore) bodies within fault zone structures, and they this reflection (Table 3). We noted that reflection chn4 could are potentially relevant to mineral exploration (Malehmir et be associated with the southern structure of the Barlow plu- al., 2010; Cheraghi et al., 2013; Bellefleur et al., 2019). Our ton. Deeper reflection packages (greater than 6 km) do not analysis suggests the utility of considering DMO stacked sec- correlate to surface geology; subhorizontal reflections chn5 tions with cross dips to image diffractions better. The imaged and chn6, at depths of 7–12 km, have no clear geological in- Solid Earth, 12, 1143–1164, 2021 https://doi.org/10.5194/se-12-1143-2021
S. Cheraghi et al.: Seismic imaging across fault systems of Chibougamau area                                                    1155

                                                                      diffraction enhances our understanding of chn3 and its inter-
                                                                      est for exploring for massive sulfide deposits.
                                                                         CDMO analysis revealed a more coherent image of the
                                                                      diffraction chn_diff assuming a cross dip of 12◦ to the west
                                                                      (Fig. 8b and Table 3). The diffraction chn_diff shows a larger
                                                                      width (∼ 2 km in the plane of the DMO stacked section) com-
                                                                      pared to the diffraction within reflection package of chn3
                                                                      (Fig. 8c). The shallower diffraction appears clearer with no
                                                                      cross-dip element (dashed area in Fig. 8c) and thus seems to
                                                                      be located in the plane of the seismic profile with no lateral
                                                                      dip. It is not imaged in the migrated section (Fig. 5a) mainly
                                                                      because its low amplitude did not survive a migration that
                                                                      collapsed diffraction energy.
                                                                         In order to scrutinize the diffraction imaging capability, we
                                                                      compare an enlarged section of the upper crust of the Chi-
                                                                      bougamau north survey (shallower than 1.5 s) with no cross
                                                                      dip applied (Fig. 8c) with a section with cross dip 12◦ to the
                                                                      west applied (Fig. 8b) in Figs. 10 and 11, respectively. Fig-
                                                                      ure 10a clearly shows the diffraction tail imaged within re-
                                                                      flection package chn3 at CDP 1600 (marked with red dashed
                                                                      ellipse).
                                                                         A zoomed view of the diffraction chn_diff in a section
                                                                      with a cross-dip element of 12◦ to the west is shown in
                                                                      Fig. 11. Similar to the analysis shown in Fig. 10, we visu-
                                                                      ally checked the shot gathers around CDP locations where
                                                                      chn_diff was imaged (CDPs 1900–2200). Shot gather 2730
                                                                      (Fig. 4a for location) is shown as an example. This shot
                                                                      gather imaged a package of reflections interpreted as chn3
                                                                      and also diffracted events at approximately 1.5 s in CDP lo-
                                                                      cations where chn_diff was expected to be imaged (see CDP
                                                                      2088 marked as the apex of the diffraction in Fig. 11b).
                                                                         Diffractions are easy to miss and require a focused vi-
                                                                      sual inspection of DMO stacked sections and shot gathers
                                                                      (Malehmir et al., 2010; Cheraghi et al., 2013). The analy-
                                                                      sis of DMO/CDMO stacked images shown in Figs. 5 and
                                                                      8 helped to image both out-of-plane and planar diffractions
                                                                      (Fig. 8b, c, respectively) near the Barlow fault. In particular,
                                                                      the CDMO stack image enhanced the illumination of diffrac-
                                                                      tion chn_diff (Fig. 8b). These diffractions can be considered
                                                                      a target of more detailed exploration.

                                                                      6.2.2   Seismic interpretation along the south profile

Figure 7. CDMO analysis for the north survey along Sect. 2 (see       The south profile shows more complexity in the upper crust
Fig. 4 for the location of the section). (a) DMO-corrected stacked    where both north- and south-dipping reflections are im-
section with cross-dip element of 30◦ to the west applied. (b) DMO-
                                                                      aged (Fig. 6). It seems that the lithological contact of the
corrected stacked section with cross-dip element of 12◦ to the west
                                                                      Obatogamau Formation (intermediate to mafic rocks) and the
applied. (c) DMO-corrected stacked section with no cross-dip el-
ement applied. (d) DMO-corrected stacked section with cross-dip       Caopatina Formation (sedimentary rocks) is the main cause
element of 10◦ to the east applied. (e) DMO-corrected stacked sec-    of the reflectivity along the south profile in the upper crust
tion with cross-dip element of 30◦ to the east applied. (f) DMO-      (Fig. 6). The volcanic–sedimentary reflection packages in
corrected stacked section with cross-dip element of 40◦ to the east   the upper crust (chs1, chs2, and chs3) and deeper reflection
applied. See text for the interpretation of marked reflections.       packages (chs4, chs5, chs6) depict a synform structure along
                                                                      the south profile. The geometry of this structure includes the
                                                                      south-dipping reflection in the north of the profile and north-
                                                                      dipping reflection in the south (Fig. 6). Similar to the north

https://doi.org/10.5194/se-12-1143-2021                                                          Solid Earth, 12, 1143–1164, 2021
1156 S. Cheraghi et al.: Seismic imaging across fault systems of Chibougamau area Figure 8. CDMO analysis for the north survey along Sect. 3 (see Fig. 4 for the location of the section). (a) DMO-corrected stacked section with cross-dip element of 30◦ to the west applied. (b) DMO-corrected stacked section with cross-dip element of 12◦ to the west applied. (c) DMO-corrected stacked section with no cross-dip element applied. (d) DMO-corrected stacked section with cross-dip element of 10◦ to the east applied. (e) DMO-corrected stacked section with cross-dip element of 30◦ to the east applied. (f) DMO-corrected stacked section with cross-dip element of 40◦ to the east applied. See text for the interpretation of marked reflections and diffractions. The surface location of the Barlow fault is presented at the top of the section. profile (Fig. 5), the upper-crustal rocks around the reflection 40◦ dip to the south in the migrated section (Fig. 6 and Table sets chs1, chs2, chs3, and chs4 (Fig. 6) are approximately 3), which is much less than the reported field measurements. 6 km thick. Further knowledge about the geometry of reflection chs2, if Reflection chs1 (Fig. 6, Table 3) at CDP 1700 likely cor- associated with the Guercheville fault, would help to better relates with the contact between pelitic to siliciclastic sed- understand the subsurface architecture and its relationship to imentary rocks of the basin-restricted Caopatina Formation gold deposits along strike to the east. and mafic to intermediate lava flows of the Obatogamau For- CDMO analysis along the south survey (Fig. 9) suggested mation. dips for reflection chs2 varying between 20–50◦ depending Reflection sequence chs2 (Fig. 6, Table 3) also corre- on different CDMO correction values. To evaluate CDMO lates with the contact between the Obatogamau (sedimentary results around chs2, shot gather 15 135 is considered. Fig- rock) and Caopatina formations (mafic rocks) but includes ure 12 shows shot gather 15 135 from the south survey (see two packages of reflectivity including a set of steeply dip- Fig. 4d for location) that was acquired near CDP 2220 where ping reflections and another set of subhorizontal reflections chs2 turns from a steeply dipping reflector into a subhori- (Fig. 6). The surface geology associated with the subhori- zontal reflector (see Figs. 6 and 9). The chs2 reflection in zontal set of chs2 contains mafic rocks of the Obatogamau this shot gather shows both subhorizontal and steeply dip- Formation. The surface location of the Guercheville fault is ping parts at approximately 1 s (see the dashed line in Fig. 12, marked at CDP 2400; thus the reflection set of chs2 could be which separates those parts). The steeply dipping part of associated with this fault. The Guercheville fault is described chs2 in Fig. 12 has an associated high apparent velocity as subvertical (Daigneault, 1996). The reflection chs2 has a (∼ 8000 ms−1 ), required so that a reflector dipping ∼ 40– Solid Earth, 12, 1143–1164, 2021 https://doi.org/10.5194/se-12-1143-2021
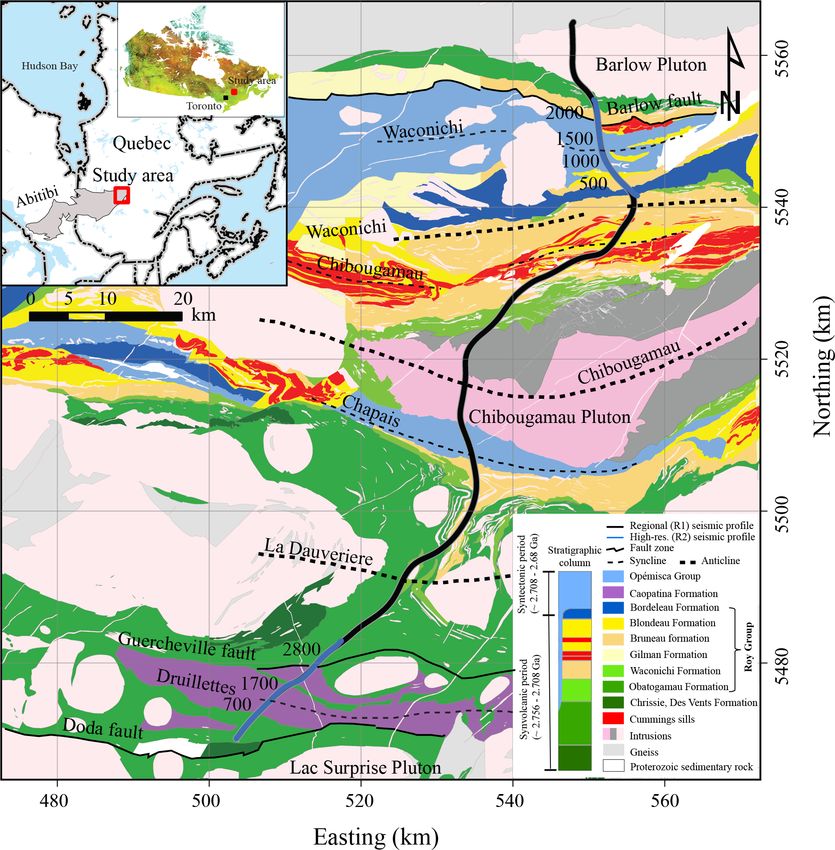
S. Cheraghi et al.: Seismic imaging across fault systems of Chibougamau area                                                          1157

Figure 9. CDMO analysis for a part of the south survey around the Guercheville fault. (see Fig. 4 for the location). (a) DMO-corrected
stacked section with cross-dip element of 30◦ to the west applied. (b) DMO-corrected stacked section with cross-dip element of 12◦ to
the west applied. (c) DMO-corrected stacked section with no cross-dip element applied. (d) DMO-corrected stacked section with cross-dip
element of 10◦ to the east applied. (e) DMO-corrected stacked section with cross-dip element of 30◦ to the east applied. (f) DMO-corrected
stacked section with cross-dip element of 40◦ to the east applied. The surface location of the Guercheville fault is shown at the top of the
section. See text for the interpretation of marked reflections.

50◦ constructively stacks; this appears consistent with Fig. 9c         the reflection sets chs1 and chs2, the chs3 set dips to the north
(no cross dip applied) and sections with a cross-dip element            (30◦ , Table 3) and represents the deepest reflector associated
to the east (Fig. 9d, e, f). These reflections are also imaged          with the contact of the Obatogamau and Caopatina forma-
with westward CDMO (Fig. 9a, b). This uncertainty would                 tions along the south survey (Table 3). The CDMO analysis
suggest greater complexity of the Guercheville fault off the            implies that the north-dipping reflector chs3 shows more co-
plane of the south profile. The angle between the southern              herency with westward strike (12 and 30◦ – Fig. 9b and a, re-
profile and the strike of the Guercheville fault where the pro-         spectively). The reflector chs3 is less coherent at depths shal-
file crosses the fault is ∼ 40◦ . This means that the true dip of       lower than 2 km. This may suggest a steeper dip that CDMO
the fault is higher than the apparent dips imaged with reflec-          was not able to image.
tion chs2 in Fig. 9, i.e., greater than 50◦ . Both scenarios in-           Reflection chs4 (Fig. 6, Table3), located at depths of 2–
cluding the cross-dip element to the east or west could there-          5 km, dips towards the north with a westward cross-dip ele-
fore be valid. It appears that the structure associated with the        ment. Because the seismic profile lies oblique to the strike
reflection chs2, the Guercheville fault, is a steeply dipping           of the mapped geological structures (Fig. 1), the true dip
structure and shows an asymmetric anticline structure with              of this reflection is greater than 30◦ (Table 3). Reflection
its eastern flank steeper than its western flank, i.e., the cross       chs4 likely images structures off the seismic profile in the
dip of 40◦ to the east in Fig. 9f vs. 12◦ to the west in Fig. 9b.       south (Fig. 1). This reflection set probably lies within mafic
Using either cross dip coherently images reflection chs2 with           rocks of the Obatogamau or Waconichi formations; there-
an apparent dip of 50◦ along the profile.                               fore, it most likely originates at more felsic interlayers, chert
   Similar to reflection sets chs1 and chs2, the reflection set         and iron formations, sulfide (VMS) accumulations, or faults
chs3 (Fig. 6, Table 3) correlates with the contact between the          within the mafic rocks. Reflection chs4 could alternatively
Obatogamau and Caopatina formations at CDP 500. Unlike                  be associated with structures from the northern border of the

https://doi.org/10.5194/se-12-1143-2021                                                              Solid Earth, 12, 1143–1164, 2021
1158                                           S. Cheraghi et al.: Seismic imaging across fault systems of Chibougamau area

Figure 10. (a) A zoomed view from Fig. 8c (DMO stacked section
with no cross-dip element applied) around the diffraction imaged.
(b) Shot 4070 (see Fig. 4 for the location) acquired for the north    Figure 11. (a) A zoomed view from Fig. 8b (DMO stacked section
survey, which shows the signal from the diffraction around CDP        with cross-dip element 12◦ to the west applied) around the diffrac-
1600 in (a). The location of CDP 1600 is shown in (b). See text for   tion chn_diff. (b) Shot 2730 (see Fig. 4 for the location) acquired
interpretation.                                                       for the north survey, which shows the signal from the diffraction
                                                                      chn_diff; the apex of chn_diff is imaged around CDP 2088 in (a).
                                                                      The location of CDP 2088 is shown in (b). See text for interpreta-
                                                                      tion.
Lac Surprise Pluton (Fig. 1). If interpreted as a fault, re-
flection chs4 most likely correlates to the Doda fault. The
Doda fault is measured as subvertical at surface (Daigneault,         appear consistent with a regional syncline, perhaps the Druil-
1996). Reflection chs4 may image the extension of this fault          lettes syncline (Mathieu et al., 2020a).
at depths greater than 2 km.
   At depths of 6–9 km, two packages of dipping reflections,          6.3   Potential for the exploration of orogenic gold
chs5 to the north and chs6 to the south (Fig. 6, Table 3), sug-
gest a syncline structure. These reflectors may correspond            The Barlow fault and the associated diffractions in the north
to the proposed basal contact of greenstones with under-              (reflection package chn3, Fig. 5) and in the south, the joint
lying tonalite–trondhjemite–granodiorite (TTG) or tonalite–           compound structure of the Guercheville fault (reflection
trondhjemite–diorite (TTD) intrusive rocks (Mathieu et al.,           package chs2, Fig. 6), and the Doda fault (reflection package
2020a). Alternatively, the reflectors may lie within these in-        chs4, Fig. 6) all lie within the greenstone belt rocks of the
trusive rocks as represented by outcrops of the Hébert pluton         upper crust (Mathieu et al., 2020a). Both surveys show deep
to the south of the profile (Mathieu et al., 2020b). At shal-         reflectors, reflections chn5 and chn6 along the north profile
lower depths, reflection sets chs3 and chs4 (north-dipping,           and reflections chs5 and chs6 along the south profile, that ap-
Fig. 6, and Table 3) and chs2 (south-dipping, Fig. 6, Table 3)        pear related to regional synclines. Fault zones within Abitibi

Solid Earth, 12, 1143–1164, 2021                                                          https://doi.org/10.5194/se-12-1143-2021
You can also read