Serum Metabolite Biomarkers for Predicting Residual Feed Intake (RFI) of Young Angus Bulls - MDPI
←
→
Page content transcription
If your browser does not render page correctly, please read the page content below
H

         OH
               OH
                    metabolites
Article
Serum Metabolite Biomarkers for Predicting Residual
Feed Intake (RFI) of Young Angus Bulls
Aidin Foroutan 1,2 , Carolyn Fitzsimmons 1,3 , Rupasri Mandal 2 , Mark V. Berjanskii 2
and David S. Wishart 2,4, *
 1            Department of Agricultural Food and Nutritional Science, University of Alberta,
              Edmonton, AB T6G 2P5, Canada; aidin@ualberta.ca (A.F.); cfitzsim@ualberta.ca (C.F.)
 2            Department of Biological Sciences, University of Alberta, Edmonton, AB T6G 2E9, Canada;
              rmandal@ualberta.ca (R.M.); mb1@ualberta.ca (M.V.B.)
 3            Agriculture and Agri-Food Canada, Edmonton, AB T6G 2P5, Canada
 4            Department of Computing Science, University of Alberta, Edmonton, AB T6G 2E8, Canada
 *            Correspondence: dwishart@ualberta.ca

 Received: 19 October 2020; Accepted: 27 November 2020; Published: 30 November 2020

 Abstract: Residual feed intake (RFI) is a feed efficiency measure commonly used in the livestock
 industry to identify animals that efficiently/inefficiently convert feed into meat or body mass.
 Selection for low-residual feed intake (LRFI), or feed efficient animals, is gaining popularity
 among beef producers due to the fact that LRFI cattle eat less and produce less methane per
 unit weight gain. RFI is a difficult and time-consuming measure to perform, and therefore a
 simple blood test that could distinguish high-RFI (HRFI) from LRFI animals (early on) would
 potentially benefit beef farmers in terms of optimizing production or selecting which animals to
 cull or breed. Using three different metabolomics platforms (nuclear magnetic resonance (NMR)
 spectrometry, liquid chromatography-tandem mass spectrometry (LC-MS/MS), and inductively
 coupled plasma mass spectrometry (ICP-MS)) we successfully identified serum biomarkers for RFI
 that could potentially be translated to an RFI blood test. One set of predictive RFI biomarkers included
 formate and leucine (best for NMR), and another set included C4 (butyrylcarnitine) and LysoPC(28:0)
 (best for LC-MS/MS). These serum biomarkers have high sensitivity and specificity (AUROC > 0.85),
 for distinguishing HRFI from LRFI animals. These results suggest that serum metabolites could be
 used to inexpensively predict and categorize bovine RFI values. Further validation using a larger,
 more diverse cohort of cattle is required to confirm these findings.

 Keywords: residual feed intake; serum; metabolite; biomarker; Angus bulls

1. Introduction
      Residual feed intake (RFI) is a livestock feed efficiency measure defined as the difference between
an animal’s actual feed intake and its expected feed requirements for maintenance and growth over
a specific time period. RFI is independent of growth characteristics such as body weight (BW) and
average daily gain (ADG) [1,2]. RFI measurements are laborious, expensive, and time-consuming
as they require measuring an individual animal’s BW and feed intake over a period of 76 days [1,3].
The RFI value is typically calculated over a group or herd of cattle, where the mean RFI for that group is
defined as 0 kg/day. Low-RFI (LRFI) animals eat less than average, while high-RFI (HRFI) animals eat
more than average. For example, an animal with an RFI value of −1.9 kg/day eats 1.9 kg/day less than
the mean of 0 kg/day and is considered to be a LRFI or a feed efficient animal. Selection for LRFI animals
is gaining popularity among beef producers because LRFI cattle eat less per unit weight gain. Another
positive attribute of LRFI cattle is that they produce less methane. Methane is a greenhouse gas, which

Metabolites 2020, 10, 491; doi:10.3390/metabo10120491                               www.mdpi.com/journal/metabolites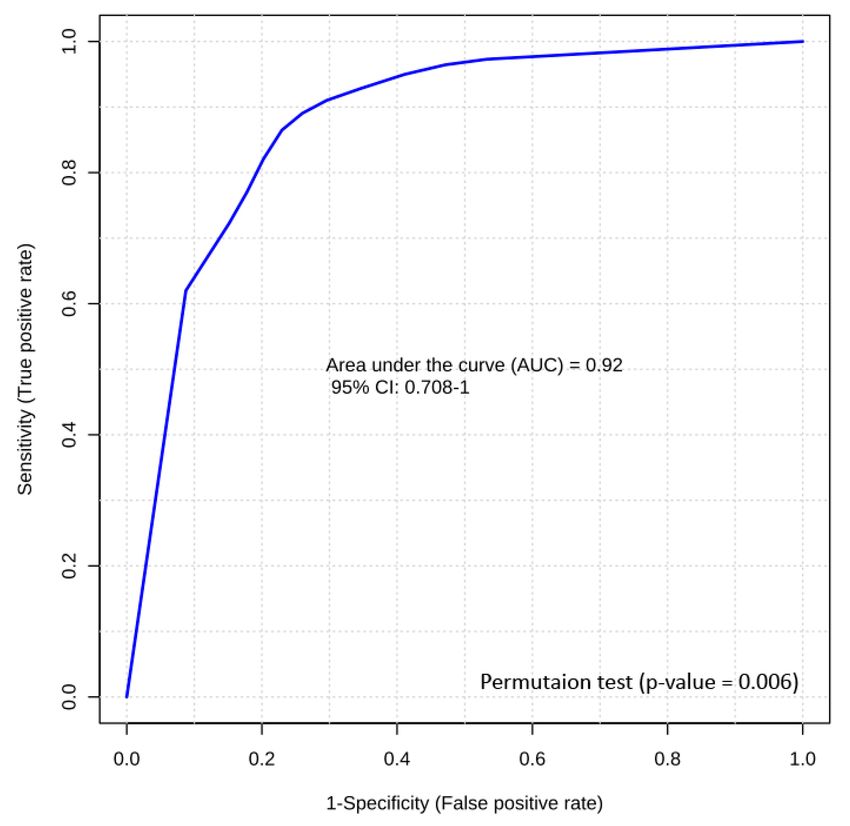
Metabolites 2020, 10, 491                                                                            2 of 20

is produced by ruminants during digestion and fermentation [4]. Livestock are responsible for the
emission of ~18% of the global anthropogenic output of greenhouse gases [4,5], and therefore reducing
their carbon footprint is a key factor in reducing global warming. Several studies have shown that
selecting for LRFI cattle is associated with reduced methane production [6,7]. Indeed, compared with
HRFI cattle, 25–28% lower methane production in LRFI animals has been reported [6,7]. Therefore,
selection for feed efficiency can favor both the farmer (decreased production costs) and the environment
(lower methane and manure production). In addition, RFI has a moderate heritability (h2 = 0.29−0.46)
in cattle, which makes it a good candidate for genetic improvement through selective breeding [1,8,9].
     However, because RFI measurements are expensive and time-consuming, they are performed
only on a small percentage of the cattle population. Simpler or cheaper proxies for measuring RFI
are clearly desirable. Because RFI is a measure of metabolic efficiency, it has been proposed that
metabolomics or metabolite measurements of bovine biofluids may offer a lower cost alternative to
manual RFI measurement. Several metabolomics studies have been conducted in beef cattle to explore
the relationship between RFI and metabolite levels [10–12]. For example, higher concentrations of
glucose [10], urea [10], creatine [11], carnitine [11], and β-hydroxybutyrate [12], but lower concentrations
of creatinine [10] were reported in the plasma of HRFI beef cattle as compared with LRFI beef
cattle. However, neither the performance of these biomarkers nor a precise mathematical model for
predicting RFI from these biomarkers has been described. Likewise, these studies were limited to
measuring a relatively small number of metabolites via a single metabolomics platform (such as nuclear
magnetic resonance (NMR) spectroscopy) or a laboratory chemistry analyzer. Here, we describe a
more comprehensive metabolomic study that uses multiple metabolomics platforms, including NMR
spectroscopy, liquid chromatography-tandem mass spectrometry (LC-MS/MS), and inductively coupled
plasma mass spectrometry (ICP-MS), to quantitatively characterize 145 serum metabolites in HRFI
and LRFI young Angus bulls. Using this comprehensive metabolomics dataset, we were able to
identify several new metabolite biomarkers for RFI. Furthermore, we have constructed two logistic
regression models (one optimized for NMR, the other optimized for LC-MS/MS) that use just two
serum metabolites to differentiate HRFI and LRFI animals with a high sensitivity and specificity
(AUROC > 0.85). A more complete description of the methods, the biomarkers, and the models are
given below.

2. Results

2.1. The Serum Metabolome of Beef Cattle
     Serum metabolomic data were obtained from 15 HRFI and 10 LRFI young Angus bulls using three
metabolomics platforms including NMR, LC-MS/MS, and ICP-MS. A total of 145 metabolites were
identified and quantified in each serum sample (Table 1). We have deposited this information into the
Bovine Metabolome Database (BMDB) (www.bovinedb.ca) [13]. Inspection of our experimental data
reveals that the chemical composition of bovine serum is dominated by inorganic ions (primarily sodium,
potassium, calcium, and phosphorus), carbohydrates (glucose), organic acids (lactate, acetate,
and 3-hydroxybutyrate), amino acids (glycine, valine, and glutamine), and various amine-containing
compounds (urea, creatinine). We found that for those metabolites that were measured by both
LC-MS/MS and NMR, there was a generally good overall agreement with the concentration values
across both platforms. Therefore, to simplify the presentation of the data we only report the LC-MS/MS
values for those metabolites measured on both platforms. According to our data, the range of metabolite
concentrations detected in bovine serum varied from 1.2 ± 0.2 µM (fumarate) to 5393 ± 2341 µM (lactate)
for NMR, from 0.0075 ± 0.0011 µM (C14:2-OH (hydroxytetradecadienylcarnitine)) to 4115 ± 326 µM
(glucose) for LC-MS/MS, from 0.0016 ± 0.0001 µM (cesium) to 132,919 ± 3122 µM (sodium) for ICP-MS.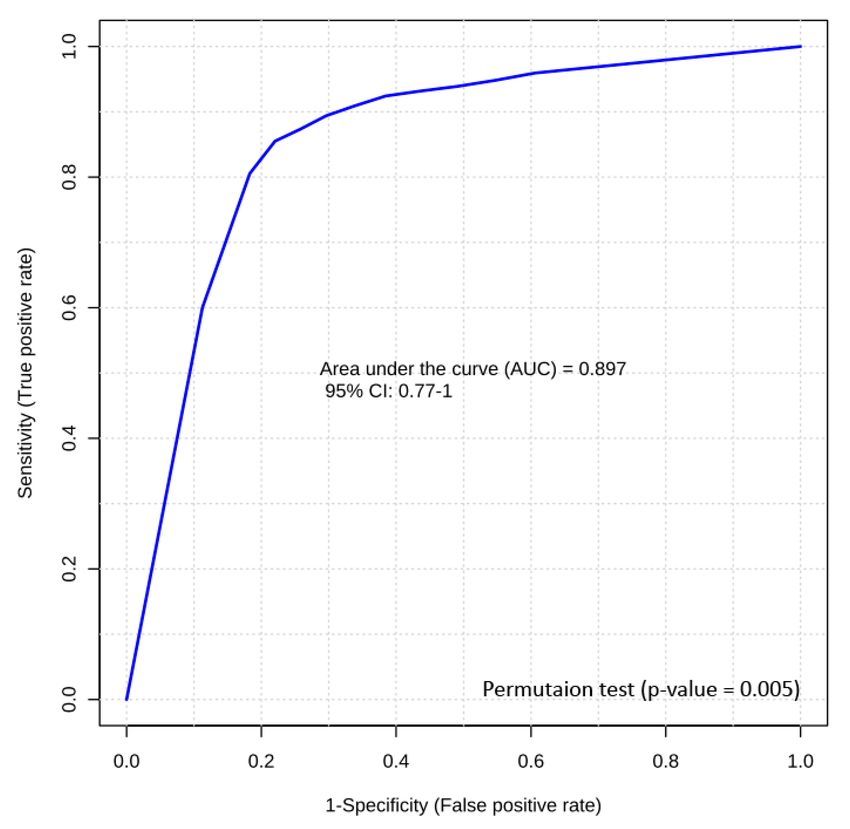
Metabolites 2020, 10, 491                                                                                  3 of 20

      Table 1. List of serum metabolites along with their analytical platform, measured concentrations, fold
      change, and log2 fold change.

                                                                                                       Log2 Fold
                                                                                       Fold Change
 Metabolite                         Platform          HRFI (µM)        LRFI (µM)                        Change
                                                                                       (HRFI/LRFI)
                                                                                                      (HRFI/LRFI)
 AMINO ACIDS
 Alanine                        LC-MS/MS & NMR         236 ± 29 1       245 ± 30           0.96          −0.05
 Arginine                       LC-MS/MS & NMR          218 ± 32        218 ± 35           1.00           0.00
 Asparagine                     LC-MS/MS & NMR           26 ± 4          24 ± 3            1.08           0.12
 Aspartate                      LC-MS/MS & NMR           26 ± 12         22 ± 10           1.18           0.24
 Beta-alanine                        NMR                   8±1            8±1              0.99          −0.02
 Citrulline                     LC-MS/MS & NMR           93 ± 15         81 ± 14           1.15           0.20
 Creatine                       LC-MS/MS & NMR          194 ± 31        199 ± 23           0.97          −0.04
 Glutamate                      LC-MS/MS & NMR           93 ± 22         89 ± 15           1.04           0.06
 Glutamine                      LC-MS/MS & NMR          330 ± 52        330 ± 22           1.00           0.00
 Glycine *                      LC-MS/MS & NMR          377 ± 66        429 ± 52           0.88          −0.19
 Histidine                         LC-MS/MS              78 ± 12          79 ± 8           0.99          −0.02
 Isoleucine                     LC-MS/MS & NMR          156 ± 15        150 ± 11           1.04           0.06
 Leucine *                      LC-MS/MS & NMR          221 ± 25        197 ± 15           1.12           0.17
 Lysine                         LC-MS/MS & NMR           91 ± 18          84 ± 9           1.08           0.12
 Methionine                     LC-MS/MS & NMR            33 ± 5         34 ± 3            0.97          −0.04
 Ornithine                      LC-MS/MS & NMR           60 ± 13         63 ± 12           0.95          −0.07
 Phenylalanine                  LC-MS/MS & NMR            72 ± 7         69 ± 7            1.04           0.06
 Proline                        LC-MS/MS & NMR          105 ± 15        101 ± 16           1.04           0.06
 Serine *                       LC-MS/MS & NMR           91 ± 13         76 ± 10           1.20           0.26
 Threonine                      LC-MS/MS & NMR           76 ± 12         72 ± 13           1.06           0.08
 Tryptophan                        LC-MS/MS               47 ± 7         47 ± 6            1.00           0.00
 Tyrosine                       LC-MS/MS & NMR           91 ± 12          90 ± 6           1.01           0.02
 Valine                         LC-MS/MS & NMR          367 ± 33        338 ± 28           1.09           0.12
 BIOGENIC AMINES
 Acetyl-ornithine                  LC-MS/MS             3.3 ± 0.71      2.8 ± 0.74         1.18           0.24
 Asymmetric-dimethylarginine       LC-MS/MS            1.15 ± 0.21     1.06 ± 0.11         1.08           0.12
 Carnosine                         LC-MS/MS              31 ± 16          29 ± 6           1.07           0.10
 Creatinine                     LC-MS/MS & NMR          109 ± 18        118 ± 16           0.92          −0.11
 Kynurenine                        LC-MS/MS             7.3 ± 1.2        7.6 ± 2.4         0.96          −0.06
 Methionine-sulfoxide              LC-MS/MS             1.2 ± 0.3        1.2 ± 0.3         1.00           0.00
 Methylhistidine                   LC-MS/MS               15 ± 2          14 ± 2           1.07           0.10
 Putrescine                        LC-MS/MS           0.035 ± 0.021   0.041 ± 0.014        0.85          −0.23
 Sarcosine                      LC-MS/MS & NMR         2.79 ± 0.73     3.08 ± 0.74         0.90          −0.15
 Serotonin                         LC-MS/MS                8±3            10 ± 4           0.80          −0.32
 Spermidine                        LC-MS/MS            0.21 ± 0.01     0.18 ± 0.01         1.17           0.22
 Spermine                          LC-MS/MS            0.21 ± 0.14     0.12 ± 0.04         1.75           0.81
 Taurine                        LC-MS/MS & NMR           80 ± 25          81 ± 10          0.99          −0.02
 Total-dimethylarginine            LC-MS/MS              2.1 ± 0.3       2.1 ± 0.3         1.00           0.00
 Trans-hydroxyproline              LC-MS/MS               24 ± 5          27 ± 4           0.89          −0.17
 Trimethylamine-N-oxide            LC-MS/MS                5±1             7±4             0.71          −0.49
 CARBOHYDRATES
 Glucose                        LC-MS/MS & NMR         3860 ± 490      4115 ± 326          0.94          −0.09
 ORGANIC ACIDS
 3-hydroxybutyrate                   NMR               375 ± 164         287 ± 94          1.31           0.39
 Acetate                             NMR               452 ± 228         329 ± 123         1.37           0.46
 Alpha-aminoadipate                LC-MS/MS            1.25 ± 0.54      1.31 ± 0.44        0.95          −0.07
 Ascorbate (Vitamin C)               NMR                  11 ± 3          10 ± 3           1.10           0.14
 Formate *                           NMR                 82 ± 13          72 ± 3           1.14           0.19
 Fumarate                            NMR                1.2 ± 0.2        1.2 ± 0.2         1.00           0.00
 Lactate                             NMR              4488 ± 1761      5393 ± 2341         0.83          −0.27
 Pyruvate                            NMR                142 ± 27         162 ± 54          0.88          −0.19
 MISCELANEOUS
 Acetone                             NMR                 71 ± 27         69 ± 12           1.03           0.04
 Betaine                        LC-MS/MS & NMR          169 ± 27        168 ± 37           1.01           0.01
 Choline                        LC-MS/MS & NMR           20 ± 4          22 ± 4            0.91          −0.14
 Ethanol                             NMR                7.8 ± 1.2       8.1 ± 1.4          0.96          −0.05
 Glycerol                            NMR                312 ± 41        318 ± 36           0.98          −0.03
 Isopropanol                         NMR               2.27 ± 0.82     2.54 ± 0.34         0.92          −0.12
 Methanol                            NMR                  32 ± 5         31 ± 3            1.03           0.05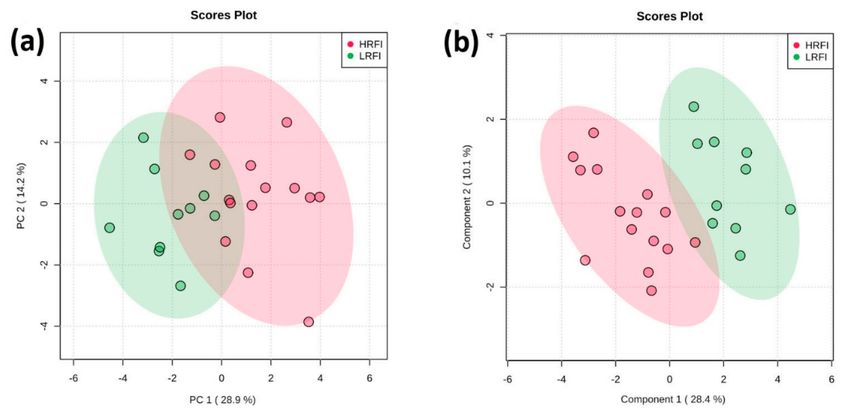
Metabolites 2020, 10, 491                                                                       4 of 20

                                          Table 1. Cont.

                                                                                             Log2 Fold
                                                                              Fold Change
 Metabolite                    Platform       HRFI (µM)       LRFI (µM)                       Change
                                                                              (HRFI/LRFI)
                                                                                            (HRFI/LRFI)
 Myo-inositol                    NMR             43 ± 12          48 ± 8         0.90         −0.16
 Urea                            NMR           1389 ± 266      1220 ± 289        1.14          0.19
 Uridine                         NMR            3.1 ± 0.71      2.8 ± 0.52       1.11          0.15
 PHOSPHATIDYLCHOLINES, ACYL-ALKYL
 PC ae (36:0)                  LC-MS/MS        1.68 ± 0.41     1.64 ± 0.41       1.02          0.03
 PC ae (40:6)                  LC-MS/MS        0.47 ± 0.13     0.44 ± 0.04       1.07          0.10
 PHOSPHATIDYLCHOLINES, DIACYL
 PC aa (32:2)                  LC-MS/MS          4.3 ± 1.3       3.8 ± 1.1       1.13          0.18
 PC aa (36:6)                  LC-MS/MS          0.7 ± 0.2       0.6 ± 0.2       1.17          0.22
 PC aa (36:0)                  LC-MS/MS         6.05 ± 1.4      6.18 ± 1.4       0.98         −0.03
 PC aa (38:6)                  LC-MS/MS       1.007 ± 0.284   0.901 ± 0.194      1.12          0.16
 PC aa (38:0)                  LC-MS/MS       0.801 ± 0.162   0.831 ± 0.161      0.96         −0.05
 PC aa (40:6)                  LC-MS/MS          1.6 ± 0.4       1.7 ± 0.4       0.96         −0.05
 PC aa (40:2)                  LC-MS/MS       0.367 ± 0.061   0.376 ± 0.061      0.95         −0.08
 PC aa (40:1)                  LC-MS/MS       0.209 ± 0.034   0.214 ± 0.044      0.98         −0.03
 LYSOPHOSPHATIDYLCHOLINES, ACYL C
 LysoPC(14:0)                  LC-MS/MS        0.83 ± 0.12     0.77 ± 0.11       1.08          0.11
 LysoPC(16:1)                  LC-MS/MS        0.63 ± 0.14     0.63 ± 0.11       1.00          0.00
 LysoPC(16:0)                  LC-MS/MS           20 ± 4         19 ± 3          1.05          0.07
 LysoPC(17:0)                  LC-MS/MS        2.83 ± 0.61     2.86 ± 0.41       0.99         −0.02
 LysoPC(18:2)                  LC-MS/MS           16 ± 4         14 ± 2          1.14          0.19
 LysoPC(18:1)                  LC-MS/MS         6.5 ± 1.4       6.4 ± 1.1        1.02          0.02
 LysoPC(18:0)                  LC-MS/MS           29 ± 6         30 ± 3          0.97         −0.05
 LysoPC(20:4)                  LC-MS/MS        0.51 ± 0.14     0.44 ± 0.11       1.17          0.23
 LysoPC(20:3)                  LC-MS/MS         1.7 ± 0.4       1.6 ± 0.3        1.06          0.09
 LysoPC(24:0)                  LC-MS/MS       0.051 ± 0.014   0.051 ± 0.011      1.00          0.00
 LysoPC(26:1)                  LC-MS/MS       0.109 ± 0.051   0.095 ± 0.042      1.15          0.20
 LysoPC(26:0)                  LC-MS/MS         0.9 ± 0.3       0.6 ± 0.3        1.50          0.58
 LysoPC(28:1)                  LC-MS/MS       0.349 ± 0.122   0.266 ± 0.064      1.30          0.37
 LysoPC(28:0) *                LC-MS/MS       0.322 ± 0.121   0.228 ± 0.044      1.41          0.50
 SPHINGOMYELINS
 SM(16:1)                      LC-MS/MS           6±1             5±1            1.10          0.13
 SM(16:0)                      LC-MS/MS          69 ± 10         65 ± 9          1.06          0.09
 SM(18:1)                      LC-MS/MS          11 ± 3           9±2            1.22          0.29
 SM(18:0)                      LC-MS/MS          12 ± 1          11 ± 2          1.09          0.13
 SM(20:2) *                    LC-MS/MS         1.2 ± 0.3       0.9 ± 0.2        1.33          0.42
 HYDROXYSPHINGOMYELINS
 SM(14:1(OH))                  LC-MS/MS         5.6 ± 1.2       5.1 ± 1.1        1.10          0.13
 SM(16:1(OH))                  LC-MS/MS           9±1             8±2            1.13          0.17
 SM(22:2(OH))                  LC-MS/MS           5±1             4±1            1.10          0.13
 SM(22:1(OH))                  LC-MS/MS         9.3 ± 1.4       8.8 ± 1.4        1.06          0.08
 SM(24:1(OH))                  LC-MS/MS         1.9 ± 0.4       1.9 ± 0.4        1.00          0.00
 ACYLCARNITINES
 C0 (Carnitine) *              LC-MS/MS           8±2             7±1            1.16          0.22
 C2 (Acetylcarnitine)          LC-MS/MS        1.84 ± 0.81     1.54 ± 0.44       1.19          0.25
 C3:1 (Propenoylcarnitine)     LC-MS/MS       0.028 ± 0.004   0.029 ± 0.004      0.97         −0.05
 C3 (Propionylcarnitine) *     LC-MS/MS        0.22 ± 0.052   0.18 ± 0.014       1.22          0.29
 C4:1 (Butenylcarnitine)       LC-MS/MS       0.017 ± 0.002   0.017 ± 0.002      1.00          0.00
 C4 (Butyrylcarnitine) *       LC-MS/MS       0.197 ± 0.041   0.143 ± 0.034      1.38          0.46
 C3-OH
                               LC-MS/MS       0.027 ± 0.004   0.028 ± 0.004      0.96         −0.05
 (Hydroxypropionylcarnitine)
 C5:1 (Tiglylcarnitine)        LC-MS/MS       0.023 ± 0.004   0.023 ± 0.004      1.00          0.00
 C5 (Valerylcarnitine)         LC-MS/MS        0.11 ± 0.034   0.08 ± 0.014       1.38          0.46
 C4-OH (C3-DC)
                               LC-MS/MS       0.041 ± 0.004   0.042 ± 0.004      0.98         −0.03
 (Hydroxybutyrylcarnitine)
 C6:1 (Hexenoylcarnitine)      LC-MS/MS       0.023 ± 0.004   0.023 ± 0.004      1.00          0.00
 C6 (C4:1-DC)
                               LC-MS/MS       0.053 ± 0.014   0.049 ± 0.011      1.08          0.11
 (Hexanoylcarnitine)
 C5-OH (C3-DC-M)
                               LC-MS/MS       0.038 ± 0.004   0.036 ± 0.004      1.06          0.08
 (hydroxyvalerylcarnitine)
 C5:1-DC (Glutaconylcarnitine) LC-MS/MS       0.018 ± 0.003   0.018 ± 0.003      1.00          0.00
 C5-DC
                               LC-MS/MS       0.028 ± 0.004   0.027 ± 0.004      1.04          0.05
 (C6-OH)(Glutarylcarnitine)
Metabolites 2020, 10, 491 5 of 20
Table 1. Cont.
Log2 Fold
Fold Change
Metabolite Platform HRFI (µM) LRFI (µM) Change
(HRFI/LRFI)
(HRFI/LRFI)
C8 (Octanoylcarnitine) LC-MS/MS 0.019 ± 0.011 0.018 ± 0.004 1.06 0.08
C5-M-DC
LC-MS/MS 0.019 ± 0.002 0.019 ± 0.003 1.00 0.00
(methylglutarylcarnitine)
C9 (Nonaylcarnitine) LC-MS/MS 0.022 ± 0.002 0.021 ± 0.003 1.05 0.07
C7-DC (Pimelylcarnitine) LC-MS/MS 0.037 ± 0.042 0.026 ± 0.031 1.42 0.51
C10:2 (Decadienylcarnitine) LC-MS/MS 0.05 ± 0.01 0.06 ± 0.01 0.89 −0.18
C10:1 (Decenoylcarnitine) LC-MS/MS 0.172 ± 0.032 0.163 ± 0.034 1.06 0.08
C10 (Decanoylcarnitine) LC-MS/MS 0.19 ± 0.04 0.18 ± 0.03 1.06 0.08
C12:1 (Dodecenoylcarnitine) LC-MS/MS 0.085 ± 0.013 0.081 ± 0.014 1.05 0.07
C12 (Dodecanoylcarnitine) LC-MS/MS 0.038 ± 0.011 0.035 ± 0.003 1.09 0.12
C14:2
LC-MS/MS 0.036 ± 0.004 0.033 ± 0.004 1.09 0.13
(Tetradecadienylcarnitine)
C14:1 (Tetradecenoylcarnitine) LC-MS/MS 0.06 ± 0.01 0.05 ± 0.01 1.13 0.17
C14 (Tetradecanoylcarnitine) LC-MS/MS 0.018 ± 0.011 0.015 ± 0.004 1.20 0.26
C12-DC
LC-MS/MS 0.018 ± 0.002 0.019 ± 0.003 0.95 −0.08
(Dodecanedioylcarnitine)
C14:2-OH
LC-MS/MS 0.0079 ± 0.0021 0.0075 ± 0.0011 1.05 0.07
(Hydroxytetradecadienylcarnitine)
C14:1-OH
LC-MS/MS 0.008 ± 0.002 0.009 ± 0.001 0.89 −0.17
(Hydroxytetradecenoylcarnitine)
C16:2
LC-MS/MS 0.012 ± 0.002 0.012 ± 0.002 1.00 0.00
(Hexadecadienylcarnitine)
C16:1 (Hexadecenoylcarnitine) LC-MS/MS 0.026 ± 0.004 0.025 ± 0.002 1.04 0.06
C16 (Hexadecanoylcarnitine) LC-MS/MS 0.021 ± 0.011 0.019 ± 0.004 1.11 0.14
C16:2-OH
LC-MS/MS 0.005 ± 0.001 0.006 ± 0.001 0.83 −0.26
(Hydroxyhexadecadienylcarnitine)
C16:1-OH
LC-MS/MS 0.018 ± 0.003 0.019 ± 0.004 0.95 −0.08
(Hydroxyhexadecenoylcarnitine)
C16-OH
LC-MS/MS 0.007 ± 0.001 0.008 ± 0.001 0.88 −0.19
(Hydroxyhexadecanoylcarnitine)
C18:2
LC-MS/MS 0.006 ± 0.001 0.007 ± 0.001 0.86 −0.22
(Octadecadienylcarnitine)
C18:1 (Octadecenoylcarnitine) LC-MS/MS 0.014 ± 0.003 0.016 ± 0.003 0.88 −0.19
C18 (Octadecanoylcarnitine) LC-MS/MS 0.022 ± 0.011 0.021 ± 0.004 1.10 0.14
C18:1-OH
LC-MS/MS 0.009 ± 0.001 0.008 ± 0.001 1.13 0.17
(Hydroxyoctadecenoylcarnitine)
METAL IONS
Sodium (Na) ICP-MS 132919 ± 12091 134408 ± 16387 0.99 −0.02
Magnesium (Mg) ICP-MS 920 ± 77 948 ± 104 0.97 −0.04
Phosphorus (P) ICP-MS 1315 ± 193 1271 ± 111 1.03 0.05
Potassium (K) ICP-MS 4283 ± 428 4315 ± 341 0.99 −0.01
Calcium (Ca) ICP-MS 2251 ± 232 2193 ± 211 1.03 0.04
Iron (Fe) ICP-MS 49 ± 14 57 ± 10 0.86 −0.22
Copper (Cu) ICP-MS 8±2 9±2 0.89 −0.17
Zinc (Zn) ICP-MS 13 ± 2 12 ± 1 1.05 0.07
Selenium (Se) ICP-MS 1.4 ± 0.2 1.3 ± 0.2 1.08 0.11
Rubidium (Rb) ICP-MS 1.8 ± 0.2 1.8 ± 0.2 1.00 0.00
Strontium (Sr) ICP-MS 0.94 ± 0.14 0.98 ± 0.04 0.96 −0.06
Cesium (Cs) * ICP-MS 0.0016 ± 0.0002 0.0019 ± 0.0003 0.84 −0.25
Barium (Ba) ICP-MS 0.19 ± 0.04 0.21 ± 0.02 0.90 −0.14
1 Mean ± standard deviation * p-value < 0.05.
Using a combination of NMR and LC-MS/MS, a total of 58 water-soluble organic compounds were
identified and quantified in bovine serum. The most abundant water-soluble organic compounds in
serum were lactate (5393 ± 2341 µM), glucose (4115 ± 326 µM), and urea (1389 ± 266 µM). The lowest
concentration that could be reliably detected in serum was 0.035 ± 0.021 µM for putrescine.
The TMIC Prime assay (a locally developed LC-MS/MS assay) provided quantitative results for
74 lipids or lipid-like compounds including 10 phosphatidylcholines (PCs), 14 lysophosphatidylcholines
(LysoPCs), 5 sphingomyelins (SMs), 5 hydroxysphingomyelins (SM(OH)s), and 40 acylcarnitines (ACs)
in bovine serum. Note that some LysoPC and PC species identified by the TMIC Prime assay correspondMetabolites 2020, 10, 491 6 of 20
to multiple (ranging from as few as 2 to as many as 24) possible unique lipid structures. In our study,
SM(16:0) (69 ± 10 µM) and C14:2-OH (hydroxytetradecadienylcarnitine) (7.5 ± 1.1 nM) were the most
and least abundant lipid-like compounds identified in serum, respectively.
ICP-MS also provided quantitative results for 13 trace minerals in bovine serum. The most abundant
elements identified and quantified by ICP-MS were sodium (134 ± 16 mM), potassium (4.3 ± 0.3 mM),
calcium (2.2 ± 0.2 mM), and phosphorus (1.3 ± 0.2 mM). While the least abundant metals quantified by
ICP-MS were cesium (1.6 ± 0.2 nM), barium (190 ± 40 nM), and strontium (940 ± 140 nM).
2.2. Univariate Statistical Analysis of Bovine Serum Metabolites
Using univariate analysis, we compared the serum metabolite profile of those young Angus bulls
identified as being HRFI with those identified as being LRFI. The most significantly different metabolites
(p-value < 0.05) between the HRFI and the LRFI animals are shown in Figure 1. In total, 10 differentially
expressed metabolites achieved statistical significance in this comparison. Specifically, the serum
concentrations of serine, leucine, formate, C0 (carnitine), C3 (propionylcarnitine), C4 (butyrylcarnitine),
LysoPC(28:0), and SM(20:2) were greater in HRFI bulls than LRFI bulls. The most upregulated
metabolites were LysoPC(28:0) with a fold change (HRFI/LRFI) of 1.41 and C4 (butyrylcarnitine) with
a fold change (HRFI/LRFI) of 1.38. In addition to these eight upregulated metabolites, two other
metabolites, glycine and cesium, were downregulated in the HRFI bulls as compared with their
LRFI counterparts.
Figure 1. Comparison of fold change of significantly regulated metabolites (p-value < 0.05) in the
serum of high-residual feed intake (HRFI) versus low-residual feed intake (LRFI) bulls.
2.3. Multivariate Analysis of Bovine Serum Metabolites
Principle component analysis (PCA) showed moderately separable clustering between HRFI
and LRFI animals (Figure 2a), while partial least squares discriminant analysis (PLS-DA) showed
a good separation for these two groups (Figure 2b). Permutation tests conducted on the PLS-DA
model indicated that the observed separation was statistically significant (p-value < 0.01). A variable
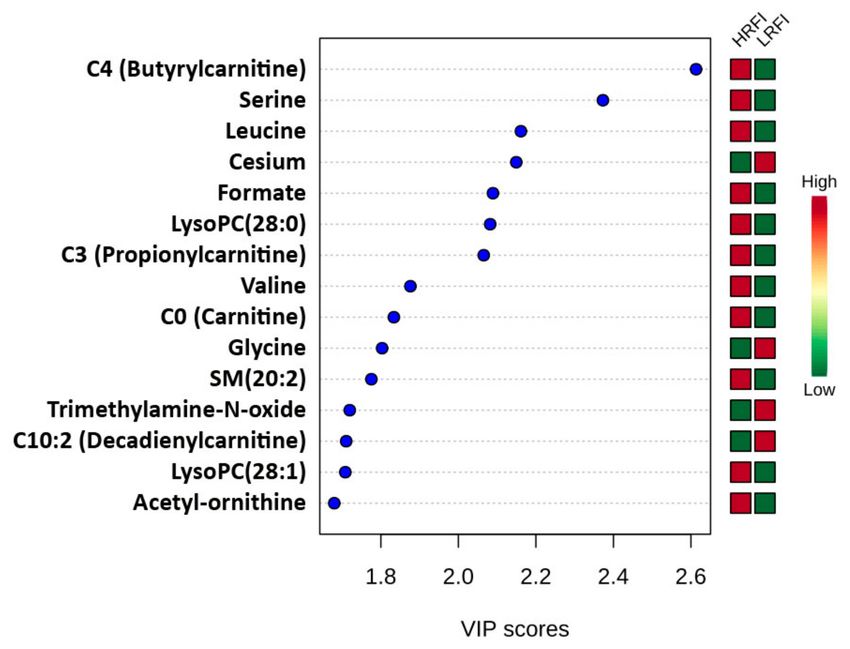
importance of projection (VIP) plot of the PLS-DA data, which ranks the top 15 metabolites based on
their contribution to the discriminant model, is shown in Figure 3. The heat map on the right side
of the VIP plot indicates that four metabolites (cesium, glycine, trimethylamine-N-oxide, and C10:2
(decadienylcarnitine)) were more abundant in the LRFI group, while the other 11 metabolites were
more abundant in the HRFI group. All, except five metabolites (valine, trimethylamine-N-oxide,
C10:2 (decadienylcarnitine), LysoPC(28:1), and acetyl-ornithine), identified via our multivariate analysisMetabolites 2020, 10, 491 7 of 20
overlapped with the metabolites identified as significantly different between LRFI and HRFI animals
by our univariate analysis.
Figure 2. Comparison between serum metabolite data acquired for HRFI versus LRFI group. (a) Principal
component analysis (PCA) graph; (b) Partial least squares discriminant analysis (PLS-DA) graph with
permutation test p-value of < 0.01.
Figure 3. Variable importance in projection (VIP) plot acquired from the comparison between HRFI
vs. LRFI group. The most discriminating metabolites are shown in descending order of their coefficient
scores. The color boxes indicate whether metabolite concentration is increased (red) or decreased
(green) in HRFI vs. LRFI group.
2.4. Biomarkers for Bovine RFI
From the significant metabolites identified via our univariate and multivariate analyses, we used logistic
regression to generate two optimal models for distinguishing HRFI from LRFI animals. One biomarker
panel uses only NMR-acquired data while the second uses only LC-MS/MS acquired data. The NMR modelMetabolites 2020, 10, 491 8 of 20
used two metabolites that are easily measured by NMR, i.e., formate and leucine (with an AUROC of 0.92
and a p-value of < 0.01). The LC-MS/MS model also used two metabolites that are easily measured by
LC-MS/MS, i.e., C4 (butyrylcarnitine) and LysoPC(28:0) (with an AUROC of 0.89 and a p-value of < 0.01).
As noted above, the best performing panel was the NMR-based test, which included formate and
leucine. A logistic regression equation for these two candidate biomarkers was used to calculate the
receiver operating characteristic (ROC) curve and to calculate the area under the ROC curve or AUROC
(Figure 4). Permutation testing (n = 1000) confirmed the significance of this model (p-value = 0.006).
The logistic regression model developed for this prediction is given as follows:
logit(P) = log(P/(1 − P)) = −1.6 − 3.554 × formate − 2.161 × leucine (1)
where P is the probability of an animal being classified as LRFI. The optimal cutoff point for the above
equation is 0.38. This means that an animal with a value greater than or equal to 0.38 belongs to the LRFI
group, while an animal with a value less than 0.38 belongs to the HRFI group. Because the concentrations
of the metabolites used in this study were cube-root transformed, and then scaled via auto scaling,
the value for formate in the above equation corresponds to the (cube root [formate] − 4.2684)/0.1951
(where [formate] is the measured concentration of this compound in µM, as quantified by NMR).
Likewise, the value for leucine corresponds to the (cube root [leucine] − 5.9522)/0.2257 (where [leucine]
is the measured concentration of this compound in µM, as quantified by NMR).
Figure 4. Biomarker analysis of bovine RFI. Logistic regression receiver operating characteristic (ROC)
curve analysis of a panel of two NMR-detectable candidate biomarkers (formate and leucine) from
bovine serum samples.Metabolites 2020, 10, 491 9 of 20
The second best performing RFI prediction panel included two metabolites that could only be
measured by LC-MS/MS, i.e., C4 (butyrylcarnitine) and LysoPC(28:0). A logistic regression equation for
these two candidate biomarkers was used to generate a model with a final AUROC of 0.89 (Figure 5).
Permutation testing (n = 1000) confirmed its significance (p-value = 0.005). The logistic regression
model developed for this prediction is given as follows:
logit(P) = log(P/(1 − P)) = −3.625 − 5.351 C4(butyrylcarnitine) − 6.378 LysoPC(28:0) (2)
where P is the probability of an animal being classified as LRFI. The optimal cutoff point for the
above equation is 0.53. This means that an animal with a value greater than or equal to 0.53 belongs
to the LRFI group, while an animal with a value less than 0.53 belongs to the HRFI group. Because the
concentrations of the metabolites used in this study were cube root transformed, and then scaled
via auto scaling method, the value for C4 (butyrylcarnitine) in the above equation corresponds to
the (cube root [C4(butyrylcarnitine)] − 0.5557)/0.0499 (where [C4(butyrylcarnitine)] is the measured
concentration of this compound in µM, as quantified by LC-MS/MS). Likewise, the value for
LysoPC(28:0) corresponds to the (cube root [LysoPC(28:0)] − 0.6494)/0.0726 (where [LysoPC(28:0)] is
the measured concentration of this compound in µM, as quantified by LC-MS/MS).
Figure 5. Biomarker analysis of bovine RFI. Logistic regression ROC curve analysis of a panel of two
LC-MS/MS candidate biomarkers (C4 (butyrylcarnitine) and LysoPC(28:0)) from bovine serum samples
yields an AUC of 0.89.Metabolites 2020, 10, 491 10 of 20
3. Discussion
The main objective of this study was to identify candidate serum biomarker metabolites
that could successfully discriminate HRFI cattle from LRFI cattle. To optimize the likelihood
of identifying robust RFI biomarkers we used a combination of three quantitative metabolomics
platforms (NMR, LC-MS/MS, and ICP-MS). Using these three platforms, we were able to identify
and quantify a total of 145 metabolites, including 58 water-soluble organic compounds, 74 lipid-like
compounds, as well as 13 metal ions. Overall, we found a very good agreement between the results
of these 145 experimentally quantified metabolites with those of reported elsewhere (available in
www.bovinedb.ca [13]). Indeed, the concentrations reported for serum in the BMDB agreed well with
our experimental data. For instance, the value of asparagine reported by our study ranged from 21 to
30 µM, and for the literature-derived data it ranged from 20 to 33 µM. This widespread agreement was
not unexpected, because serum/plasma must be highly stable and cannot vary much in its metabolite
concentrations, to ensure physiological homeostasis [14].
Of course, there were a few exceptions to this rule. The most variable metabolite reported in
serum was betaine. The value of betaine reported by our study ranged from 131 to 205 µM, and the
literature-reported values ranged from 14 to 26 µM [15]. This variation could be due to a number of
factors, including differences in diet, sex, age, breed, sample work-up or extraction, sample storage
protocols, analytical platforms, and instrument sensitivity. We believe the most likely contributor to
this difference is diet, as the amount of betaine in the diet of our beef cattle would be expected to be
different than that of dairy cattle in the reference study of Artegoitia et al. [15]. Overall, there were very
few outliers like betaine. Therefore, the good agreement for metabolite concentrations we obtained
for the Angus bulls used in this study, with other cattle breeds suggests that the RFI biomarkers we
discovered here should be transferrable to other breeds of beef cattle fed similar kinds of diets.
3.1. Comparison with Literature-Reported Biomarkers of Bovine RFI
To date, there have been four other published metabolomic studies that have attempted to
identify relationships between blood metabolite levels and bovine RFI [10,11,16,17]. The study of
Fitzsimons et al. [10] showed higher concentrations of glucose and urea and lower concentrations of
creatinine in the plasma of HRFI vs. LRFI heifers. The study by Karisa et al. [11] reported higher
concentrations of creatine, carnitine, formate, hydroxyisobutyrate, and tyrosine in the plasma of HRFI beef
cattle along with higher concentrations of glycine in the plasma of LRFI beef cattle. Clemmons et al. [16]
reported that the serum concentrations of pantothenate, homocysteine, glutamine, and carnitine
were found to be associated with divergent RFI in beef steers, although no concentration values for
these metabolites were reported in the Clemmons et al. study. A very recent study conducted by
Jorge-Smeding et al. [17] found that plasma metabolites that are directly (ornithine) or indirectly
(aspartate, lysine, valine) associated with the urea cycle were correlated with RFI in Charolais heifers.
Table 2 summarizes these previous metabolomic findings and compares them with the findings
reported here. As can be seen in this table, there was a good agreement between our findings and
those reported from Fitzsimons et al. [10], Karisa et al. [11], and Jorge-Smeding [17]. For example,
serum/plasma concentrations of tyrosine were higher in our HRFI group, which is in agreement with
the findings of Fitzsimons et al. [10], and Karisa et al. [11]. Likewise, the serum concentrations of
valine was higher in the HRFI group, which is similar to the findings of Fitzsimons et al. [10] and
Jorge-Smeding et al. [17]. However, there were some discrepancies, with the most significant variations
being seen in the study of Karisa et al. [11]. For instance, the serum concentration of 3-hydroxybutyrate
was higher in HRFI animals in our study but reported as being lower in the study of Karisa et al. [11].
Karisa et al. [11] also reported exceptionally high concentrations for succinate (~250 µM), oxobutyrate
(~40 µM), and allantonin (~90 µM), which do not match values reported by our study, by any other
bovine studies, or by the referential data in the BMDB [13]. Indeed, closer analysis of the NMR spectral
regions corresponding to these metabolites (especially at higher fields) suggests that these peaks may
have been incorrectly identified, and therefore incorrectly quantified. Other reasons for the differencesMetabolites 2020, 10, 491 11 of 20
between the Karisa et al. study and other bovine studies could be due to differences in diet, sex, age,
breed, sample work-up or extraction, or instrument sensitivity.
Table 2. Blood components associated with RFI as measured by different studies.
Fitzsimons et al., 2013 Karisa et al., Karisa et al.,
Jorge-Smeding et al.,
Metabolite This Study (Olympus Chemistry 2014_Discovery 2014_Validation
2019 (LC-MS/MS)
Analyzer) Population (NMR) Population (NMR)
Glucose * L1 H2
Urea H H
Creatinine L L L
Creatine * L H (Glutamine overlap) H (Glutamine overlap)
Carnitine H H H (Glutamine overlap) H (Glutamine overlap)
Formate H H L
Hydroxyisobutyrate ND 3 H H (Glucose overlap)
Tyrosine H H H
Glycine L L H
Pantothenate ND
Hippurate ND H (Glutamine overlap) L (Glutamine overlap)
Threonine H H
Acetate * H L
Phenylalanine H H
Lysine H H
Citrate ND H
Betaine H H
Glutamate * H L
Valine H H H
Choline * L H
Histidine L L
Uridine H H
2-methylamine ND L
3-methylamine ND L
2-hydroxybutyrate ND H
3-hydroxybutyrate * H L
4-hydroxybutyrate ND H (Acetone overlap)
Succinate ND L (Mis-match)
Oxo-butyrate ND L (Mis-match)
Trans-4-hydroxy-L-proline ND L
Proline H H
Allantonin ND H (Mis-match)
L (Overlap with
Glutamine H=L glutamate, creatine,
carnitine, hippurate)
Aspartate H H
Ornitine * L H
Fumarate H=L L
Lysine H H
* Metabolites which concentration values do not agree with literature values; 1 L, LRFI; 2 H, HRFI; 3 ND, not detected.
Another notable difference was found for blood glucose concentrations between our study and
the values reported by Fitzsimons et al. [10]. In particular, the concentration of glucose was found
to be higher in the serum of LRFI Angus bulls in our study but reported as being higher in the
plasma of medium- and high-RFI Simmental heifers, respectively, in the study of Fitzsimons et al. [10].
Apart from glucose, other metabolites measured in both studies showed similar trends in terms of RFI
classification (i.e., both studies found that the concentration of urea and carnitine were higher in HRFI
animals). Glucose concentrations can vary significantly depending on how long samples are left at
room temperature prior to being frozen. This is because glycolytic reactions in liquid serum/plasma can
readily lead to conversion of glucose to lactate. Unfortunately, no details were provided in the study
by Fitzsimons et al. [10] regarding sample preparation time or lactate levels. Furthermore, given the
fact that the highest concentration of glucose was seen in medium-RFI animals as opposed to the
LRFI or HRFI animals, suggests the glucose data reported by Fitzsimons et al. may have been more
reflective of differences in sample preparation time than true differences in RFI. As a general rule,
we treat reported glucose concentrations in livestock studies with a good deal of caution because of the
extreme sensitivity of glucose levels to sample preparation/storage.
3.2. Candidate Serum Biomarkers of Bovine RFI
While other studies have identified possible associations between blood metabolites and bovine
RFI, as yet, no published study has attempted to develop quantitative metabolite biomarker panels to
predict RFI in cattle. Using logistic regression models, two categorical predictive biomarker panelsMetabolites 2020, 10, 491 12 of 20
were developed from this study to categorically predict RFI and to distinguish HRFI animals from
LRFI animals.
The best performing panel was an NMR-based, two-metabolite model that included formate
and leucine. The second-best performing panel was an LC-MS/MS based two-metabolite model that
included C4 (butyrylcarnitine) and LysoPC (28:0). Both panels have high sensitivity and specificity
(AUROC > 0.85), making them good candidates to distinguish or predict HRFI animals from LRFI
animals. Because these panels consist of just two metabolites, it is possible to construct very fast
(Metabolites 2020, 10, 491 13 of 20
3.3. Metabolite Markers and Their Role in RFI Biochemistry
Our study identified a number of significantly different metabolites that seemed to drive
the observed differences in RFI, i.e., C4 (butyrylcarnitine), LysoPC(28:0), formate, and leucine.
Each of these compounds plays an important role in bovine metabolism. C4 (butyrylcarnitine)
is an acylcarnitine formed when fatty acyl-coenzyme A (fatty acyl-CoA) enters through the carnitine
shuttle into the mitochondria for β-oxidation and the tricarboxylic acid (TCA) cycle to produce
ATP [25]. Besides facilitating fatty acids crossing the mitochondrial membranes to be degraded by
β-oxidation, acylcarnitines along with branched-chain amino acids (BCAAs) (leucine, iso-leucine,
and valine), also mediate activation of several important hepatic metabolic signaling pathways leading
to diseases such as non-alcoholic fatty liver disease and type 2 diabetes mellitus in humans and
other mammals [26,27]. The short-chain acylcarnitines C3, C4, and C5 are degradation products of
BCAAs [28] and saturation of the BCAA degradation pathway has been shown to inhibit the initial step
of β-oxidation, leading to weight gain and body fat deposition [28]. High concentrations of BCAAs
are associated with higher oxidative stress, and as seen in human and rodent studies, can serve as
biomarkers for obesity-associated insulin resistance and diabetes [28,29].
LysoPC(28:0) belongs to the lysophosphatidylcholine family of lipids which are derived by
partial hydrolysis of phosphatidylcholines by removing one of the fatty acid groups, via the action of
phospholipase A2 (PLA2) [30]. High concentrations of lysoPC species (especially those containing
palmitoyl (C16:0) or stearoyl (C18:0) groups) in the blood are known to stimulate cytosolic PLA2 and
this results in an increased release of arachidonate, which is associated with cardiovascular disease [31].
In the vascular system, lysophosphatidylcholines have been shown to increase oxidative stress [32–34].
For example, Zou et al. [34] reported that lysophosphatidylcholines enhanced oxidative stress in rat
aorta during aging via the 5-lipoxygenase pathway. Lehmann et al. [35] reported that circulating
lysophosphatidylcholines can serve as biomarkers of a metabolically benign non-alcoholic fatty liver in
humans. In particular, Lehmann et al. found that the plasma concentration of lysophosphatidylcholines
was higher in insulin-sensitive patients with non-alcoholic fatty liver as compared with insulin-resistant
ones with non-alcoholic fatty liver. Stiuso et al. [36] also reported that lipidomic or oxidative status of
serum caused by lysophosphatidylcholines was associated with liver diseases (i.e., non-alcoholic fatty
liver or steatohepatitis). A recent study [37] reported lower levels of reactive oxygen species (ROS)
in the liver of LRFI steers which suggested they have lower levels of hepatic oxidative stress than
HRFI steers. Decreased oxidative stress in the liver has been associated with lower feed maintenance
requirements, due to a lower lipid and protein turnover and better efficiency in energy usage [37].
As comprehensively reviewed by Herd and Arthur [38], variations in RFI can be explained by
differences in energy expenditure from metabolic processes, body composition, and physical activity.
Typically, greater energy expenditures and higher maintenance requirements are seen in HRFI animals
as compared with LRFI animals [38]. Richardson et al. [39] also reported that Angus steers born from
HRFI parents had less whole-body protein and more whole-body fat as compared with progeny steers
of LRFI parents. Therefore, higher levels of C4 (butyrylcarnitine) and LysoPC(28:0) in the serum of our
HRFI bulls might be associated with increased oxidative stress in the HRFI group.
The other two serum metabolites that were most differentiating between HRFI and LRFI animals
included formate and leucine. The concentration of formate and leucine was higher in HRFI animals
and lower in LRFI animals. Formate participates in NADPH synthesis and catalyzes the conversion of
fumarate into succinate in the TCA cycle [40,41]. The associations between RFI and several metabolites
(i.e., acetate, citrate, and succinate) linked to the TCA cycle were recently discussed by Karisa et al. [11],
as well as Wang and Kadarmideen [42]. Formate is the simplest carboxylic acid and serves as a potent
reductive force against oxidative stress. It is produced when the keto-acid, glyoxylate, neutralizes ROS
in cells [40,41]. Therefore, a higher level of formate in the serum of HRFI animals suggests that
these less feed-efficient cattle are more prone to oxidative stress in the form of higher levels of ROS.
This conclusion also agrees with the results reported in the study performed by Casal et al. [37].Metabolites 2020, 10, 491 14 of 20
Additionally, Fitzsimons et al. [10] also reported positive correlations between RFI and formate levels
in the plasma of beef cattle.
Leucine is a branched-chain amino acid and its catabolism generates succinyl-CoA and acetyl-CoA,
both of which can upregulate the activity of the TCA cycle [43,44]. BCAAs are also involved in protein
turnover in skeletal muscle [44–46]. Leucine also increases fatty acid oxidation [47]. As discussed earlier,
high concentrations of BCAAs are associated with higher levels of oxidative stress [28,29]. Therefore,
leucine could have an important role in RFI variation, since both protein turnover, oxidative stress,
and energy metabolism are key factors affecting this phenotype [38].
We also performed a further study to understand if the variations in the concentration of C4
(butyrylcarnitine), LysoPC(28:0), formate, and leucine between HRFI and LRFI bulls correlated with
the concentration of these metabolites in their rumen. This was done to explore whether these
metabolite difference may be associated with differences in ruminal activity or rumen microbial activity.
However, we found no such correlation (data not shown).
4. Materials and Methods
4.1. Ethics Approvals
The collection and analysis of bovine serum in this study was approved by the University of
Alberta’s Animal Care Committee (Animal Use Protocol [AUP] 1129) under the auspices of the
Canadian Council of Animal Care [48].
4.2. Animals and Experimental Design
Twenty-five purebred Angus bulls, raised on the University of Alberta’s Roy Berg Kinsella
Research Ranch (Kinsella, AB, Canada), were used in this study. After weaning, bulls were fed and
managed according to industry standards for production of potential replacement yearling bulls in
Alberta until their RFI test at approximately 13 months of age [49].
4.3. Measurement of Phenotypic RFI Values for the Angus Bull Cohort
From the end of May 2015 until mid-August 2015, bulls were tested for RFIf (RFI that was
adjusted for rib fat thickness at the end of feedlot test) at approximately 13 to 16 months of age using
the GrowSafe™ automated feed recording system (GrowSafe Systems Ltd., Calgary, AB, Canada) at
Agriculture and Agri-Food Canada (AAFC, Lacombe, AB, Canada). The RFI test was conducted
following the protocols and calculation of RFI as reported by Mao et al. [50] and Johnson et al. [49],
except that standardized daily dry matter intake (STDDMI) was calculated as an average of dry matter
intake over the test period and standardized to 12 megajoules of metabolizable energy (MJ ME) per kg
dry matter for finishing bulls (instead of 10 MJ ME for heifers). The GrowSafe diet consisted of 45%
barley and 55% silage (as fed basis), and the nutrient analysis is presented in Table 3. An adaptation
period of 21 days was used to acclimatize cattle to the GrowSafe system and diet. The quantity of
feed intake for each feeding event of each bull was recorded by the GrowSafe system, which was
further used to calculate total feed intake over the 77-day test period. Bulls were weighed twice at the
beginning of test, once per month throughout the test, and once at slaughter, which was a few days
after the RFI test was complete.
The end of the RFI test weight was estimated from the slaughter weight. Rib fat thickness
measurements (12/13th rib fat depth and LT area) were also determined at end of test, using an Aloka
SSD-210 portable ultrasonographic scanner (Aloka Co., Tokyo, Japan). The initial BW at the start of the
test and ADG were derived from a linear regression of the serial BW measurements against time (day).
Then, the metabolic BW (MWT) in kg was calculated as midpoint BW0.75 , where the midpoint BW
was computed as the sum of the initial BW and the product of ADG multiplied by half of the days on
test. Using the dry matter (DM) content of the diet, as well as the bull’s daily intake, daily DMI in kg
was calculated as an average of dry matter intake over the test period and was further standardizedMetabolites 2020, 10, 491 15 of 20
to 12 MJ ME per kg dry matter (STDDMI). In order to generate regression coefficients to predict an
animal’s expected DMI required for maintenance of body weight and growth, a linear regression model
was fit using PROC GLM in SAS (SAS Institute, Inc., Cary, NC, USA). The model was as follows:
Yi = β0 + β1 ADGi + β2 MWTj + β3 FUFATk + eijk {1} (3)
where Yi is the STDDMI for the ith bull, β0 is the intercept, β1 is the partial linear regression coefficient
of ADG, β2 is the partial linear regression coefficient of MWT, β3 is the partial regression coefficient
of final ultrasound backfat thickness (FUFAT), and ei is residual error for the ith bull. RFIf in kg of
DMI per day (kg/day) was computed as the difference between the standardized daily DMI and the
expected DMI that was predicted based on animal’s ADG, MWT, and ultrasound backfat thickness
in mm at the end of feedlot test (FUFAT) using the regression intercept and regression coefficients
resulting from {1}. In total, 15 HRFI (0.39 ± 0.28 (mean RFIf ± standard deviation (SD))) and 10 LRFI
(−0.52 ± 0.26) bulls were identified in this study. Those animals with RFIf value higher and lower than
0 kg/day were classified as HRFI and LRFI, respectively. RFIf values ranged from −1.05 kg to +1.07 kg
DM per day, with an average of 0.00 kg/day.
Table 3. Nutrient analysis of barley-silage ration fed to bulls during the RFI test period in the
GrowSafe system.
Diet Composition Value
DM 1%(actual) 56.10
CP 2 (%DM) 14
ADF 3 (%DM) 25.25
NDF 4 (%DM) 40.50
TDN 5 (%DM) 69.60
Ca (%DM) 0.94
P (%DM) 0.34
Mg (%DM) 0.23
K (%DM) 1.38
Na (%DM) 0.13
Fe (PPM) 336
Mn (PPM) 70
Zn (PPM) 61
Cu (PPM) 16
1DM, dry matter basis; 2 CP, crude protein; 3 ADF, acid detergent fibre; 4 NDF, neutral detergent fibre; 5 TDN, total
digestible nutrients.
4.4. Sample Collection
Blood samples (10 mL) were collected in the morning (just before feeding) at 15 months of age from
a jugular vein using vacutainer serum collection tubes (Becton Dickinson, Mississauga, ON, Canada).
Blood samples were kept in a cooler on ice, transferred to the laboratory within 3 h after collection,
and centrifuged at 2000× g at 4 ◦ C for 15 min. Then, the upper layer of serum was collected, and 4 mL
was stored at −80 ◦ C.
4.5. Metabolomics Tests
Three metabolomics platforms, including NMR, LC-MS/MS, and ICP-MS, were used to identify and
quantify a total of 145 metabolites in each bovine serum sample. Using NMR, LC-MS/MS, and ICP-MS,
42, 116, and 13 metabolites were identified and quantified, respectively, of which 26 metabolites were
common between NMR and LC-MS/MS. Details of sample preparation along with how the samples were
run on each metabolomics platform have been previously described in detail by Foroutan et al. [13,51].
Briefly, for NMR analysis, serum samples were filtered using a 3-kDa ultrafiltration unit (Amicon
Micoron YM-3, Sigma-Aldrich, St. Louis, MO, USA) to remove large molecular weight proteinsMetabolites 2020, 10, 491 16 of 20
and lipoproteins. These macromolecules can seriously compromise the quality of 1 H-NMR spectra
though the generation of intense, broad lines that interfere with the identification and quantification
of lower abundance metabolites [51]. Then, the de-proteinized sample was frozen and stored at
−80 ◦ C until further use. For NMR spectroscopic analysis, 280 µL of the ultra-filtered serum was
transferred to a 1.5 mL Eppendorf tube, to which an additional 70 µL of a standard NMR buffer
solution (250 mM potassium phosphate (pH 7.0), 5 mM 2,2-dimethyl-2-silapentane-5 sulfonate (DSS-d6 ),
5.84 mM 2-chloropyrimidine-5-carboxylic acid, and D2 O 54% v/v in H2 O) was added. The mixture was
then transferred to a 3 mm NMR tube for spectral analysis. All 1 H-NMR spectra were collected on a
Bruker Avance III Ascend 700 MHz spectrometer equipped with a 5 mm cryo-probe (Bruker Biospin,
Rheinstetten, Germany). Compound identification and quantification by NMR were performed
according the procedure described by Foroutan et al. [52], using the Chenomx NMR Suite 8.1 software
package (Chenomx Inc., Edmonton, AB, Canada).
A targeted, quantitative LC-MS/MS metabolite profiling approach was employed that combined
reverse-phase liquid chromatography and mass spectrometry (RPLC-MS) with direct flow injection
(DFI) mass spectrometry (DFI-MS) (RPLC-DFI-MS/MS). LC-MS/MS was employed to determine the
concentrations of up to 143 compounds (including amino acids, biogenic amines, glucose, organic acids,
acylcarnitines, PCs, LysoPCs, SMs, and SM(OH)s) using an in-house quantitative metabolomics assay
(TMIC Prime) [13,53,54]. All LC-MS analyses were conducted on an AB SCIEX QTRAP® 4000 mass
spectrometer (Sciex Canada, Concord, ON, Canada) equipped with an Agilent 1260 series UHPLC system
(Agilent Technologies, Palo Alto, CA, USA). The Analyst software 1.6.2 (Concord, ON, Canada) was used
to control the entire assay’s workflow. The macro- and micro-elemental analyses were performed on a
NexION 350× ICP-MS (Perkin Elmer, Woodbridge, ON, Canada) according the procedure described by
Foroutan et al. [13].
4.6. Statistical Analysis
Data analysis was performed using MetaboAnalyst 4.0 according to previously published
protocols [55,56]. Those metabolites having more than two missing values in each group were
removed from further analyses. A univariate analysis including t-tests and fold-change analysis was
performed in order to identify differentially expressed metabolites between the HRFI and LRFI groups.
Statistical significance was declared at a p-value < 0.05.
Multivariate statistics, including PCA, PLS-DA, and ROC curve analysis, were performed using
MetaboAnalyst 4.0. The data was scaled and normalized using a cube root transformation and auto
scaling, which generated a clear Gaussian distribution plot prior to multivariate analysis. A permutation
test involving 2000 randomized datasets was implemented to minimize the possibility that the observed
separation of the PLS-DA was due to chance (a valid model should have a p-value < 0.05).
ROC curves were calculated by MetaboAnalyst 4.0 to evaluate the predictive ability of potential
metabolic biomarkers using a logistic regression model. The area under the ROC curve (AUC or
AUROC) was used to interpret the performance across the two different biomarker models to determine
the best cut-off point for maximal sensitivity and specificity. A ROC curve plots the false-positive rate
(1-specificity) on the X axis versus sensitivity on the Y axis. On the one hand, sensitivity (or recall) is
defined as the number of true positives divided by the sum of the true positives and false negatives.
On the other hand, specificity is defined as the number of true negatives divided by the sum of the
true negatives and false positives. In a ROC curve, the accuracy of a test for correctly distinguishing
one group from another, such as HRFI bulls from LRFI bulls, is measured by the area under the ROC
curve (AUROC). The AUROC equal to 1 is the highest value indicating a perfect discriminating test,
which is obtained when all positive samples are ranked before negative ones. A permutation test
involving 1000 randomized permutations was implemented to validate (a valid model should have a
p-value < 0.05) the reliability of the model for each ROC curve.Metabolites 2020, 10, 491 17 of 20
5. Conclusions
In this study we evaluated the effectiveness of using multi-platform, quantitative metabolomics
to identify candidate serum biomarkers that can easily distinguish HRFI animals from LRFI animals.
LC-MS/MS, NMR, and ICP-MS were used to identify and quantify 145 serum metabolites in an
effort to maximize our chances to identify and develop a suitable set of metabolite RFI biomarkers.
We successfully identified two significant candidate biomarkers panels (AUROC > 0.85) that can predict
RFI categorically. These include a two-metabolite model (formate and leucine) that is compatible with
NMR analysis and a two-metabolite model (C4 (butyrylcarnitine) and LysoPC(28:0)) that is compatible
with LC-MS/MS analysis. These results suggest that serum metabolites could be used to categorically
predict RFI (early on) and inexpensively distinguish HRFI cattle from LRFI cattle.
While the results we obtained are very statistically significant and appear to be consistent with
other reported studies on bovine RFI, the main limitation in this study was the small sample size
(15 HRFI vs. 10 LRFI cattle). Given the significant costs and time associated with performing RFI
measurements on cattle, this is a limitation that is difficult to overcome. Another limitation lies in
the fact that the study was conducted on only a single sex (bulls), from a single breed (Angus cattle),
consuming the same diet. However, it is important to note that we demonstrated that the data we
measured in this study was broadly consistent with data collected for other beef cattle RFI studies.
This gives us reason to believe that the results presented here will be shown to be largely reproducible
elsewhere. Nevertheless, in order to properly confirm the robustness of these serum biomarkers as
proxies to distinguish between divergent RFI cattle, further validation studies using a larger cohort of
cattle with more diverse genetic backgrounds and from different management settings will be needed.
Author Contributions: Conceptualization, A.F. and D.S.W.; Funding acquisition, C.F. and D.S.W.; Sample acquisition,
A.F. and C.F.; Data curation, A.F.; Data analysis, A.F., R.M., and M.V.B.; Experimental data acquisition, A.F.;
Writing—original draft, A.F.; Writing—review and editing, C.F., R.M., and D.S.W. All authors have read and agreed to
the published version of the manuscript.
Funding: This research was funded by Genome Canada and the Canada Foundation for Innovation Major Science
Initiative (CFI-MSI), grant number 35456. Animal studies were supported by Alberta Livestock and Meat Agency,
grant numbers 2012C002R and 2014F151R. Aidin Foroutan was supported by an Alberta Innovates Technology
Future (AITF) from Alberta Innovates.
Conflicts of Interest: The authors declare no conflict of interest. The funders had no role in the design of the study;
in the collection, analyses, or interpretation of data; in the writing of the manuscript, or in the decision to publish
the results.
References
1. Basarab, J.A.; Price, M.A.; Aalhus, J.L.; Okine, E.K.; Snelling, W.M.; Lyle, K.L. Residual feed intake and body
composition in young growing cattle. Can. J. Anim. Sci. 2003, 83, 189–204. [CrossRef]
2. Koch, R.M.; Swiger, L.A.; Chambers, D.; Gregory, K.E. Efficiency of feed use in beef cattle. J. Anim. Sci. 1963,
22, 486–494. [CrossRef]
3. Wang, Z.; Nkrumah, J.D.; Li, C.; Basarab, J.A.; Goonewardene, L.A.; Okine, E.K.; Crews, D.H.; Moore, S.S. Test
duration for growth, feed intake, and feed efficiency in beef cattle using the GrowSafe System. J. Anim. Sci.
2006, 84, 2289–2298. [CrossRef] [PubMed]
4. Beauchemin, K. Dietary mitigation of enteric methane from cattle. Cab Rev. Perspect. Agric. Vet. Sci. Nutr.
Nat. Resour. 2009, 4, 35. [CrossRef]
5. Steinfeld, H.; Wassenaar, T. The Role of Livestock Production in Carbon and Nitrogen Cycles. Annu. Rev.
Environ. Resour. 2007, 32, 271–294. [CrossRef]
6. Basarab, J.A.; Beauchemin, K.A.; Baron, V.S.; Ominski, K.H.; Guan, L.L.; Miller, S.P.; Crowley, J.J. Reducing
GHG emissions through genetic improvement for feed efficiency: Effects on economically important traits
and enteric methane production. Animal 2013, 7, 303–315. [CrossRef]
7. Nkrumah, J.D.; Okine, E.K.; Mathison, G.W.; Schmid, K.; Li, C.; Basarab, J.A.; Price, M.A.; Wang, Z.;
Moore, S.S. Relationships of feedlot feed efficiency, performance, and feeding behavior with metabolic rate,
methane production, and energy partitioning in beef cattle. J. Anim. Sci. 2006, 84, 145–153. [CrossRef]You can also read