Street lighting in Wellington City - Making a case for adopting LED lighting
←
→
Page content transcription
If your browser does not render page correctly, please read the page content below
Street lighting in
Wellington City

Making a case for
adopting LED lighting

                        0
0

Introduction .......................................................................................................................................... 1
Street lighting ....................................................................................................................................... 2
   A brief history ................................................................................................................................... 2
   Reasons for street lighting ............................................................................................................... 3
   Connections to the Long-Term Plan ................................................................................................ 4
Street lighting in Wellington ................................................................................................................. 5
   Existing street lighting ...................................................................................................................... 5
   Existing street lighting stock ............................................................................................................ 5
   Energy consumption and costs ........................................................................................................ 5
   Variable costs versus fixed costs ..................................................................................................... 7
   Maintenance and renewals programmes......................................................................................... 7
   Existing lighting strategies ............................................................................................................... 7
Making changes to how we light Wellington ........................................................................................ 8
   Solar-powered street lights .............................................................................................................. 8
   LED technology................................................................................................................................ 8
   Control systems ............................................................................................................................. 10
   Adaptive lighting............................................................................................................................. 11
   Tvilight – CitySense and CityManager........................................................................................... 11
Impacts from changing the way we light the city ............................................................................... 13
   Energy savings .............................................................................................................................. 13
   Economic benefits .......................................................................................................................... 14
   Maintenance .................................................................................................................................. 14
   Payback calculations ..................................................................................................................... 15
   Disposal costs ................................................................................................................................ 15
   Levels of service ............................................................................................................................ 16
   Other benefits ................................................................................................................................ 16
   Smart lighting networks.................................................................................................................. 17
   LED lights in Wellington ................................................................................................................. 18
   Additional installations ................................................................................................................... 19
Roll-out options .................................................................................................................................. 19
Finance options ................................................................................................................................. 20
   Traditional competitive price (CP) specification and tender .......................................................... 21
   Product supply-and-install competitive price (CP) contract ........................................................... 22
   Product supply-only competitive price (CP) contract ..................................................................... 23
   Innovative procurement contracts .................................................................................................. 25
   Performance contract - non-financed ............................................................................................ 25
   Performance contract - financed .................................................................................................... 26
Risk .................................................................................................................................................... 27
Appendix One – Cost Savings tables ................................................................................................ 29
Appendix Two – Payback tables ....................................................................................................... 32
Appendix Three – Dark-sky initiative ................................................................................................. 33
Appendix Four – Photographs of LED installations ........................................................................... 34
   Los Angeles installations ............................................................................................................... 34
   Wellington Installations .................................................................................................................. 35
Appendix Five – selected reference materials and sources .............................................................. 39
   Publications .................................................................................................................................... 39
   Internet sources ............................................................................................................................. 39

                                                                                                                                                          0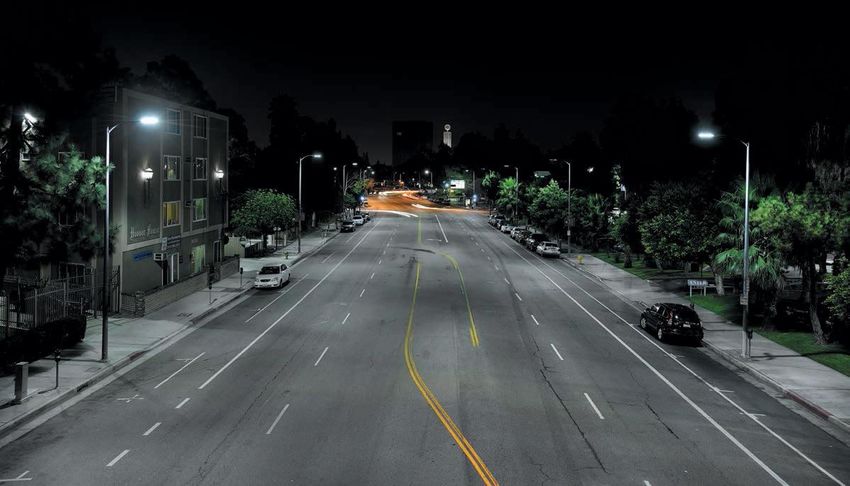
[STREET LIGHTING IN WELLINGTON CITY]

Introduction

The evolution of street lighting has reached a new level of efficiency and effectiveness with the
development of technologies utilising light emitting diodes (LED) as their source of light. As this
technology matures and the opportunity cost of waiting for future evolutions narrows there has been a
slow but steady movement around the world towards adopting LED street lights.

This trend is largely driven by a desire to reduce energy and maintenance costs through the superior
life offered by LEDs. Where existing technologies, such as the dominant high-pressure sodium street
                                        1
light, can last around 16,000 hours , manufacturers have used laboratory testing regimes to
demonstrate a life expectancy of 100,000 hours for the LED counterpart.

Other benefits from LED technology are found in controlling light pollution, improved reaction times for
road users through better colour differentiation and visibility leading to safer environments, greater
levels of comfort and a whole-of-life benefit from the lack of toxic materials in LED lights.

LED lights are highly adaptable which enables the use of control systems to manage use. This results
in increased efficiency and gives the user the ability to adopt other technologies enabling lights to be
dimmed when the need for lighting no longer exists. Directional lighting; another strength of the LED
street light; means energy is no longer consumed in lighting areas of less importance. Conversely this
ability to produce highly focused lighting enables solutions to light areas that were previously too
difficult to light due to the distribution flaws found in existing lighting units.

Running parallel to LED lighting is the ability to create ’smart’ networks – for example lights that report
their own faults, or turn on the instant they are instructed to rather than after an ignition period. This
can enable different approaches to be taken in lighting our topographically-challenging city. A truly
networked street lighting system can be used to light different areas, suburbs or even street to
different levels depending on the needs of that area – lighting can be used to channel pedestrians to
and from public transport options before and after a sport event or concert for example.

This paper articulates the research carried out by Wellington City Council in investigating the
procurement and adoption of LED technology, adaptive dimming, and asset and performance
management control systems. It uses data collected about the existing lighting stocks, maintenance,
renewal and upgrade programmes alongside the advantages and benefits shown to exist in LED
lighting.

In advancing discussions on the benefits of changing the way Wellington City is lit it is suggested
readers keep in mind why cities are lit and which cities have taken the opportunity to use lighting to
benefit the wider community. Wellington has the potential to save significant amounts of money
through efficient outdoor lighting – there exists even greater potential to the city if the lighting
network’s true potential to the city is realised simultaneously.

1
    3.8 years at an average of 11.5 hours of operation per day versus 23.8 years
[STREET LIGHTING IN WELLINGTON CITY]

Street lighting

A brief history

Street lighting is nothing new – providing light to enable travellers and pedestrians a safer passage
dates back to early Greek and Roman civilisations. Over the centuries lighting technology and
practices evolved and with the industrial age came the concept of purpose-built street lights.
                                                         th
The time for candles and oil had passed by the 19 century and gas lamps where eventually seen
across the larger European cities as well as parts of the USA, South Africa and Australia. The first gas
                                                          th
street lighting in New Zealand arrived in the mid-19 century but kerosene lamps were still used to
allow safe navigation at night by illuminating bridges, culverts and drains.

By 1876 Christchurch boasted 152 gas lamps. Although far superior to previous lighting, their
illumination and extent was still limited. The early systems required lamp lighters, but pilot lights were
soon introduced, which lit the lamp when the gas was turned on centrally.

The street light usage was also not continuous: it was recorded the Wellington gas lights were “lighted
                                                                      2
on moonless nights only and then not later than twelve o’clock ”.

The next significant change was replacement of gas with electricity. In 1888 Reefton, on the West
Coast, was the first town in the Southern Hemisphere to install electric street lights. Wellington
followed a year later as the first Southern Hemisphere city with electric lights (one of the original street
                                                                                      3
lights still stands at the intersection of Featherston Street and Lambton Quay) .

Lights were usually on from dusk to dawn, though some suburban areas extinguished them in the
early morning. The new electric lights were significantly brighter than their predecessors with the first
street lights being arc lamps.

By 1912 the incandescent lamp had been invented – these offered a longer life and easier
maintenance – and before long most of the country’s cities and towns were using them.

As the country developed and grew there was a need for stronger and smoother roads – faster and
larger numbers of motor vehicles in turn required much brighter lighting. Experiments were carried out
with new bulbs to increase brightness which led to the development of sodium or mercury-vapour
lamps.

In a similar fashion to the advantages of electric lights over gas, the new sodium or mercury lamps
had the added advantage of using less power than their respective predecessors. From the 1950s
fluorescent lights were also installed.

Wellington City Council called for tenders in 1964 to replace 5000 old lamps with modern fluorescent
lights. The fluorescent lighting produces a cool bright white light, and the lamps have a very long life.

2
    www.teara.govt.nz/en/streets-and-lighting
3
    http://www.stuff.co.nz/dominion-post/capital-life/9621582/Lamp-commemorating-electric-lighting

                                                                                                             2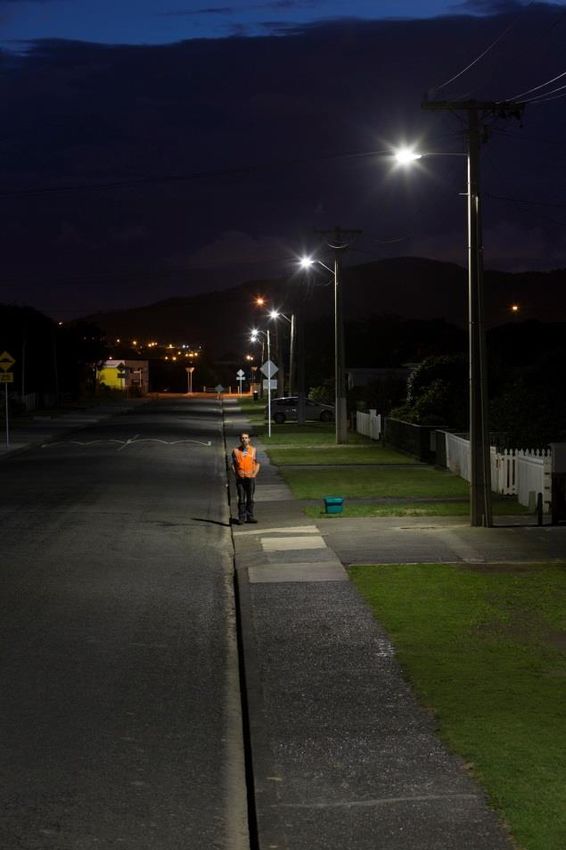
[STREET LIGHTING IN WELLINGTON CITY]
Fluorescent was the predominant lighting used until the 1970s, when they began to be replaced by
st
high-pressure sodium and metal-halide lights. By the 21 century most street lights in New Zealand
were high-pressure sodium lamps. There were over 330,000 street lights across the country, running
4
for more than 4000 hours each per year, consuming some $18 million worth of electricity.
Reasons for street lighting
5
The Australian and New Zealand Standard Lighting for Roads and Public Spaces (NZ1158) outlines
that the performance criteria for road and public space lighting schemes can include any or all of three
basic aims of:
a) Facilitating safe movement
b) Discouraging illegal acts and
6
c) Contributing to the amenity of an area through increased aesthetic appeal.
Street lighting has social and economic benefits. Primarily the reason for providing street lighting has
not changed from the historical precedents, that is, the increased safety of night time travellers and
pedestrians. What has changed over the centuries and years are the volume of night-time traffic, the
pace at which people move from point to point, the numbers of pedestrians and cyclists who share
space with motor vehicles and the diversity of activities after dark.
Effective street lighting helps reduce criminal activities like car-crime and assaults. Further, high-
quality lighting aids the use of CCTV cameras in that colours are more easily discernible. Effective
lighting allows pedestrians and cyclists to identify potential risks at a greater distance, thus allowing
for more decision-making time.
Providing quality lighting, including decorative and feature lighting, for key tourist, cultural and
hospitality locations within a city has been shown to increase both local and visitor patronage while
providing well-lit linkages enables increased mobility and interactions between public and alternative
modes of transport.
For Wellington City Council the desired results from providing and maintaining street lighting assets
are:
improved road safety for motorists, pedestrians and cyclists
reduced incidence of night-time crime
improved perceptions of street safety and security
increased leisure and commercial activity after dark
increased walking, cycling and use of public transport
community resilience through lighting solutions designed for specific environments (paths vs
streets for example)
4
Now estimated to be about $30 million
5
Note: AS/NZ1158 is made up of six parts each of which provides guidance on different aspects of street lighting
and its application to different environments.
6
AS/NZ1158.1.12005 page 2
3
[STREET LIGHTING IN WELLINGTON CITY]
lighting infrastructure that maximises efficiency, minimises maintenance and reduces the risk
of excessively long outages
best long-term value through suitable application of street lighting technologies
minimised energy consumption.
These expectations contain overlaps and to one extent or another most of the lighting technologies
available today can provide for an element of success in one or two of the results listed above. Based
on overseas experiences and research only LED lighting (solid-state lighting) offers the potential to
cover the entire list with any real certainty.
Connections to the Long-Term Plan
Street lighting does not appear as a distinct item in recent planning documents – largely this is due to
existing strategies being based only on maintenance and ongoing renewals. It also may be the quality
and quantity of lighting was satisfactory given the performance and cost limitations associated with
the existing stock – in other words there were no tangible benefits to be gained from investing heavily
in technology that could not increase service levels and performance, reduce costs or save energy to
a level where it was a financially-viable exercise.
This situation has now changed – evolving LED lighting technology along with the adaptive and
intelligent controls mean we can look at the contributions street lighting can make towards the
achievement of the city’s aspirations.
Alongside are the four key areas in to which Wellington City Council is directing energies – alongside
are the areas where street lighting can produce an impact.
4
[STREET LIGHTING IN WELLINGTON CITY]

Street lighting in Wellington

Existing street lighting

Wellington City Council operates just under 18,000 street lights – these light major and minor roads,
pathways, access-ways, subways, through-paths, area lighting, amenity lighting and an element of
decorative lights (such as the lights in the Norfolk pines on Oriental Parade).

The Council also has about 2400 lights on the waterfront between the Railway Station and Clyde
Quay wharf, another 835 lights operated by the Council’s Parks, Sports and Recreation unit, and a
number of lights providing external lighting for buildings and property. These lights are not part of the
street lighting portfolio.

Existing street lighting stock

Across the city and suburbs the street lighting stock is more variable (including manufacturer, design,
wattage and type) than is desirable. To an extent this is due to legacy issues and
maintenance/renewal programmes of the day that reflected the budgets and technology available to
the Council officers and contractors at that time.
                        7
With an estimated 28 different light manufacturers and potentially 34 different levels of lighting output
(wattage), providing a consistent level of service has become somewhat problematic.

Recorded in the database are around 100 different types of lamp technologies. Table 1 shows these
broken down into the main subgroups and their respective average energy consumption.

                             Network                                                              Watts per
    Technology                  %            Tally            Total (W)         Total (kW)        unit (Ave)
HP Sodium                       87.9%           15,749          1,764,105          1,764.11             112.01
Metal Halide                     5.4%              976            138,454             138.45            141.86
Fluorescent                      2.0%              362             22,603              22.60             62.44
Mercury Vapour                   1.3%              232             16,591              16.59             71.51
LED                              0.7%              117               4,093              4.09             34.98
Other                            2.7%              478             21,326              21.33             44.62
Grand Total                    100.0%           17,914          1,967,172          1,967.17             109.81

Table 1 - distribution of lighting technology in Wellington / average power consumption distribution by technology

Energy consumption and costs

In providing the existing street lighting service to the city we consume in the order of 7.3 megawatts of
                                                  8
electricity at a cost of just over $2.36 million a year. Without taking into consideration any increases
in the electricity network costs or changes to the lighting stock, this price will increase to $2.55 million
in 2014/15 due to the tariff structure in place between the Council and our existing electricity retailer.

7
  Within the street lighting data base there are some gaps in the data – this may result in more manufacturers
being identified as well as an increased number of different wattages.
8
  2013/14 financial year

                                                                                                                     5
[STREET LIGHTING IN WELLINGTON CITY]

Of significance to any conversation about street lighting is an understanding of how the costs for
operating the street lights are calculated for the different parties. In Wellington’s case the electricity
retailer is Contact Energy Limited - this is who the Council purchases the electricity from. The
electricity network which supplies power to the
street lights is owned and maintained by
Wellington Electricity.

Contact Energy pays Wellington Electricity to
distribute the electricity consumed by their
customer (the Council) and recovers this cost
via the monthly power bill. The retailer also
collects an administrative charge on behalf of the     Table 1 - agent/charge revenue distribution

Electricity Authority (previously called the Electricity
Commission) which is also recovered from the
customer.

The graph alongside shows the distribution of costs
to each party for every $1000 spent on powering
Wellington’s streetlights. This also shows the
relationship between the fixed and variable
components of the Council’s street lighting power
costs.

                                                                       Figure 1 - energy cost distribution

                                                                                                             6
[STREET LIGHTING IN WELLINGTON CITY]

Variable costs versus fixed costs

The way in which the Council pays for its street lighting electricity costs can seem somewhat
complicated at first. The structure, shown in the table, is made up of fixed and variable components
which are then applied to various elements of the street lighting network, the hours of operations,
regulatory requirements or direct cost recovery. In the case of the ‘energy’ costs the tariff is further
complicated with different rates applying to different hours and months of operation.

These elements are significant to the Council due to their ability to affect any future investments in
upgrading the lighting technology. In seeking greater efficiencies and better lighting solutions the
global trend is moving towards the adoption of solid-state lighting. Commonly manifested as LED
lights the technology is enabling street light operators to significantly reduce their power consumption
though the lower power requirements of the new technology.

As will be discussed later in this document, additional development of LED street lighting now makes
adaptive lighting more viable which in turn can significantly reduce power consumption further. For
Wellington City Council this is of particular interest due to the fact a major portion of our spending on
street lighting is demand-driven - based on kilowatts. In short, if the Council can reduce the number
of kilowatt hours (variable costs) we consume, we can reduce the overall cost.

Maintenance and renewals programmes

Maintenance of the existing street lighting stock is largely reactive – although regular patrols are used
to identify faults on arterial routes, the majority of faults are reported by residents. This reflects the
practices seen around the world where the street lighting network is effectively ‘dumb’.

The existing technology is susceptible to weather-related faults which with a relatively short life span
(relative to LED lights) results in an ongoing process of replacing or repairing bulbs, ignition and
electrical controls and protective shields.

With a transition to LED technologies there is proportional reduction in the maintenance costs due to
the longer life of the asset – effectively a high-pressure sodium light will be replaced between 4 and 6
times during the same lifespan of a high-quality LED luminaire.

Additionally, with high levels of weather protection, there is no need to replace shields and drive
systems which means a reduction in patrols, turnouts, replacement parts and traffic management.

The only maintenance expected to continue is a small number of faults, occasional washing with a
low pressure water blaster from the ground (mobile operation) coupled with a pole/outreach arm
inspection programme.

Existing lighting strategies

Although Wellington City Council does not have a formal street lighting strategy there was an attempt
in 2010 to establish a formal approach to outdoor lighting. Advanced by the Wellington City Lighting

                                                                                                             7
[STREET LIGHTING IN WELLINGTON CITY]
Strategy is an approach that identifies the benefits of good lighting but unfortunately focuses almost
exclusively on decorative and amenity type lighting.
It is suggested that this strategy document is evolved into an actionable Council plan to incorporate
street lighting, pathway and access-way lighting that is aligned with lighting in open spaces, Council
housing and property operators. It would also enable the Council to work with property owners,
developers, retailers, businesses and the hospitality industry to collectively provide lighting that
delivers vibrancy as well as safe and efficient navigation.
Making changes to how we light Wellington
Wellington City Council, in achieving the aspirations of the LTP and Towards 2040 strategy, can make
considerable advances through the adoption of LED street lighting. In reducing the Council’s carbon
footprint through reduced energy consumption and street lighting-related maintenance the Council
has a real opportunity to help Wellington become the one of the first cities in the southern hemisphere
to replace its entire lighting stock with energy-efficient lights.
Taking an additional step, the City Council has the ability to be a world leader in sustainability through
the adoption of adaptive lighting in its residential streets – furthermore in adopting adaptive
technologies, the Council has the ability to significantly improve street lighting while simultaneously
reducing energy consumption further.
With intelligent lighting management systems included in a street lighting upgrade the ability to enable
the street light to communicate a fault to maintenance contractors removes the need for residents to
advise the Council a streetlight is not working thus reducing the delay in fixing faults significantly.
Solar-powered street lights
While solar-powered street lights have been developed there are very small numbers in use for
metropolitan lighting. In Wellington the cost of installing such technology where there is existing
infrastructure is too high in comparison to LED technologies.
Where there is no existing infrastructure to support a need for lighting – for example on isolated
pathways with no nearby power source – solar-powered options are being explored. To date there
have been only three solar-powered lights installed across the city.
LED technology
A light-emitting diode (LED) is an electronic device that produces light when an electrical current is
passed through it. The wavelength (or colour) of light emitted depends on the materials from which
the LED is made. LEDs are available in many colours, including red, blue, amber and green. The
LEDs used predominantly in general lighting applications are ‘phosphor converted blue’ LEDs - blue
diodes covered with a layer of yellow phosphor. The phosphor absorbs some of the blue light, and
8[STREET LIGHTING IN WELLINGTON CITY]
emits yellow light. When the unabsorbed blue light mixes with the yellow light it creates what the eye
perceives as ‘white’ light.
It should be noted that LED technology is not new - it has its history in low-powered lights that have
appeared for a long time as Christmas lights or signal lights within many electronic devices. The
radical change has been in the increased efficacy of high-powered LED units. Although additional and
unexpected benefits such as reduced graffiti or reduced street crime are yet to be fully qualified by
local authorities that have transitioned to LED lighting technologies, the key drivers for change are:
Reduced energy consumption
Reduced maintenance costs due to long lifetimes
Environmentally friendly as they do not contain toxic materials (e.g. mercury)
Desired lighting levels provided
instantly with no warm up period
needed
No production of ultraviolet light
(which attracts insects)
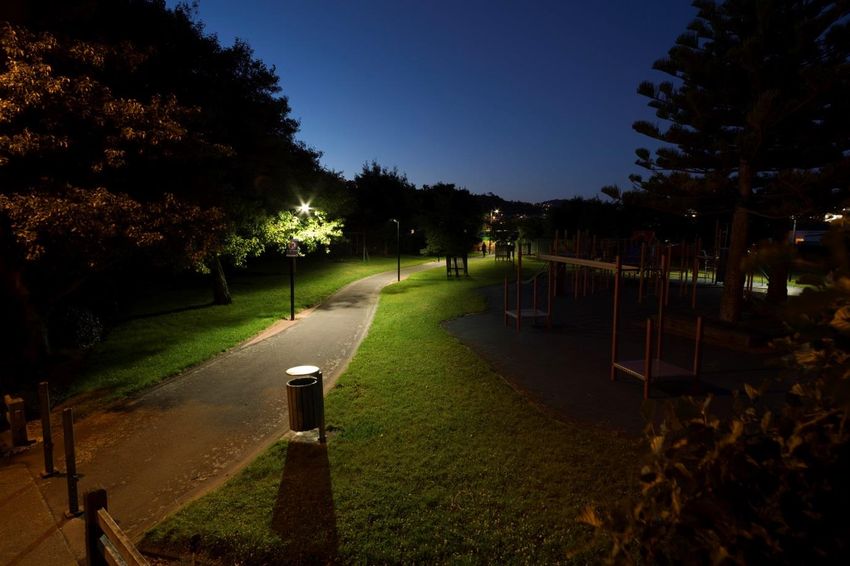
Less light pollution (or ‘spill’) as light
is emitted directionally, rather than
as a diffused glow (picture 1)
Lighting output is controllable - allowing for dimming or adaptive
management
High colour rendition index - enabling improved recognition of
different colours (good for CCTV)
Reduced glare.
Picture 1 - light distribution comparison
Graph 1 - LED market growth 2011-2016 (source: statista)
9[STREET LIGHTING IN WELLINGTON CITY]
The graph above shows the speed with which LED street lights will achieve dominance in the
marketplace – this has been documented as being is due to the many benefits seen to be available
through the adoption of LED lighting as well as their ongoing reduced relative cost.
LED Magazine predicts the LED lighting share of the industry to grow from $1.75 billion to more than
$3.25 billion in 2016.
Control systems
Control or central management systems offer tele-management options for monitoring, controlling,
metering and diagnosing outdoor lighting and further enhance the benefits of LED lighting. The ability
of the LED to respond instantly to commands, its lower power consumption (relative to equivalent
lighting solutions) and the manner in which the light is produced make intelligent systems a valuable
addition to the technology. Basic central management systems will enable our street light operators to
have faults reported instantly to a central system or communicate it to a maintenance provider, with
crews able to respond based on system information. The days of residents telling the Council their
street light has not been working for weeks should be little more than a memory.
Critical to realising the best level of return on any investment in the city’s street lights is the
requirement to be able to report exactly how much energy is being consumed by each and every light.
With the right level of control, we will be able to present our electricity retailer with a monthly report
providing an exact account of our consumption – it will remove lights that are not working as they will
not have consumed any power, it will take into account any reduction in consumption from some lights
coming on later than others – even to the extent that some lights may come on or go off earlier or
later than other lights within the same suburb or even street.
Control systems can also be used to manage events – in Auckland, as with other cities that have
adopted LED lights around key venues, there is an ability to increase the lighting levels around Eden
Park before and after a major event. This enable people to arrive and leave the event in safety but
also enables pedestrian traffic to be directed in a manageable fashion towards public transport and
parking infrastructure.
If suitable protocols are in place there is no reason that emergency services cannot request for task-
specific lighting levels - brighter for some events, darker for others. Via a central control point an
operator could possess the technology to increase or reduce the level of lighting to a street or larger
area through a desktop computer or mobile device. This technology could also be used to support
community events held over the darker months of winter.
As the strengths of LED lighting become more apparent there has been an increase in the
technologies available to support and enhance its application. One of the more exciting areas of this
is the potential for adaptive street or outdoor lighting.
10[STREET LIGHTING IN WELLINGTON CITY]
Adaptive lighting
Adaptive lighting, to put it simply, uses technology to moderate the amount of light used to suit the
purpose to which it is being applied. In the realm of street lighting this means lights can be dimmed or
turned off when there is no need to provide lighting. The ability to run a large percentage of the city’s
street lights at a reduced level when there is nobody requiring the benefits of street lighting offers two
significant and immediate benefits.
First, there is an obvious ability to increase power savings by not running lights at a high output level
when they don’t have to be. Second, as LED lights operate better at lower temperatures an LED light
operating at a reduced power setting will last longer – this means the projected lifespan of the unit can
be increased thus reducing the capital outlay (or depreciation) in replacing the asset.
As LED lights have an ability to respond instantly to on/off instructions there is little concern the
correct amount of light not be available when needed – furthermore in contrast to some of the
dimming programmes adopted thus far in LED upgrades the use of adaptive lighting guarantees to
provide the same level of service to a motorist, pedestrian or cyclist regardless of whether they are
using the city’s streets during an arbitrarily determined ‘peak’ or ‘off peak’ period
This means rather than adopting a ‘traditional’ dimming profile (refer below) which effectively reduces
the level of service to achieve savings the adoption of an adaptive system ensures the right amount of
light is available for all pedestrians, cyclists and motorists.
Picture 2 traditional vs. adaptive dimming
Tvilight – CitySense and CityManager
A Netherlands company, Tvilight, has devised what seems to be the most viable adaptive option to
reach the market so far. Using a passive infra-red (PIR) sensor attached to each pole a light can be
turned up from a dimmed setting when a pedestrian, cyclist or motorist approaches and then after a
programmed time the light will return to its dimmed state.
The CitySense system, shown in the image below, can enable lights to be configured in a way that
increases lighting outputs progressively with movement and collectively greatly increases the energy
savings potential for the city.
11[STREET LIGHTING IN WELLINGTON CITY]
Picture 3 - Tvilight’s CitySense system in operation
Alongside CitySense sits CityManager – its web-based software for remote
monitoring, management and control of street lighting infrastructures. The software
is directly coupled, although not proprietary, to CitySense through the internet and
features remote programming and modification of settings of individual and groups of streetlights,
context-specific lighting levels to reflect local conditions such as weather changes, special events and
emergency situations as well as analytical tools to allow the use of exact data for energy
savings/consumption, detection patterns and lamp failure detection.
Like more basic systems it is also capable of reporting faults. As the system is based on an open
platform it can be developed to allow an interface with hardware from other providers (e.g. traffic and
local weather monitoring).
Unlike other systems currently available the CitySense approach does not require cameras or any
other intrusive mechanism to enable the city to maintain a high level of service in providing street
lighting services.
Built from marine-grade materials the PIR receiver (shown above) is built to survive in hostile
environments and is resilient to UV and the effects of aggressive coastal conditions. Should a reviver
fail, its default position will automatically instruct the lighting unit to go to full power, this default setting
will then be detected by the CityManager system enabling a replacement unit to be sourced or repairs
carried out.
Currently a full trial of the Tvilight systems is being planned – this will see about 250 LED lights
monitored over a period of time suitable to gather sufficient evidence of their performance. As an
indication the following data from recent traffic count surveys has been used to assess what effect
CitySense would have had on the power consumption of a light in five different settings across the
city.
12[STREET LIGHTING IN WELLINGTON CITY]
Totals Severn Priscilla Black Rock Duthie Fitzpatrick
Total Operation (minutes) 27,329 5,940 4,560 5,250 6,330 5,250
Minutes on Full 7,281 2,174 1,235 807 2,280 785
Minutes dimmed 20,048 3,766 3,325 4,443 4,050 4,464
Dimmed % 73.4% 63.4% 72.9% 84.6% 64.0% 85.0%
Vehicle count (#) 12,367 4,229 1,754 1,011 4,394 979
Consumption (kWh)
70w (HPS) 1,913.1 415.8 319.2 367.5 443.1 367.5
30w (LED) 819.9 178.2 136.8 157.5 189.9 157.5
25w (LED) 683.2 148.5 114.0 131.2 158.2 131.2
30w LED with Tvilight 278.6 76.5 47.0 37.5 80.5 37.0
14w LED with Tvilight 152.1 39.8 25.6 22.4 42.0 22.2
Savings
HPS to LED (30w) 57.1%
HPS to LED (25w) 64.3%
30w LED with Tvilight 85.4% 81.6% 85.3% 89.8% 81.8% 89.9%
14w LED with Tvilight 92.1% 90.4% 92.0% 93.9% 90.5% 94.0%
Table 2 - effects of LED and adaptive lighting (Tvillight CitySense) on sample streets
Although it may not be necessary or beneficial to adopt adaptive lighting across all of the city’s streets
there is sufficient evidence to suggest residential areas would be well suited to this approach.
Impacts from changing the way we light the city
As discussed above, the benefits of LED lights in their street lighting application are numerous. The
more significant benefits are discussed below but it should be noted that although it is relatively
straightforward to predict savings in energy and energy costs there is a risk that the energy sector
may respond to reduced revenue by increasing their charges.
Energy savings
In 2013/14 Wellington’s street lights consumed 7.33 megawatts of electricity at a cost of $2.36 million.
With the adoption of LED street lights this figure can be reduced by at least 50% and potentially closer
to the 70-80 per cent range if adaptive lighting technologies are applied.
The following table shows the most common lights within the current lighting stock and the assumed
LED replacement alongside (it should be noted that the ‘assumed’ wattage of the LED is
conservative). The table represents almost 90% of the city’s street lighting stocks.
13[STREET LIGHTING IN WELLINGTON CITY]
Current Wattage No. Consumption (w) LED New consumption (w) Saving
50 173 8,650 25 4,325 50.00%
70 10,277 719,390 25 256,925 64.29%
100 554 55,400 40 22,160 60.00%
110 487 53,570 40 19,480 63.64%
150 4,100 615,000 60 246,000 60.00%
250 451 112,750 100 45,100 60.00%
400 61 24,400 120 7,320 70.00%
Totals 16,103 1,589,160 601,310 62.16%
Table 3 - assumed wattages of LED placement lights
Economic benefits
Quantifying the savings potential achievable through a change to LED lighting technologies is
relatively straightforward in terms of energy savings. As can been seen below a 50% reduction in
consumption will result in a direct savings of $1.03 million – based on current tariffs a 75% reduction
in energy consumption will achieve savings of $1.5 million.
Line Charges
Administration Electricity 2013/2014
Energy Costs
Variable Fixed Charges Authority Levies Totals
Direct lighting costs $ 735,657 $ 1,335,901 $ 277,782 $ 6,551 $ 9,380 $ 2,365,270
45% reduction in load $ 405,979 $ 737,262 $ 277,761 $ 6,551 $ 5,177 $ 1,432,730
50% reduction in load $ 369,207 $ 670,598 $ 277,806 $ 6,551 $ 4,708 $ 1,328,870
55% reduction in load $ 332,442 $ 603,739 $ 277,768 $ 6,551 $ 4,239 $ 1,224,739
60% reduction in load $ 295,674 $ 536,977 $ 277,782 $ 6,551 $ 3,770 $ 1,120,754
65% reduction in load $ 258,906 $ 470,215 $ 277,782 $ 6,551 $ 3,301 $ 1,016,755
70% reduction in load $ 222,138 $ 403,454 $ 277,782 $ 6,551 $ 2,830 $ 912,755
75% reduction in load $ 185,369 $ 336,692 $ 277,782 $ 6,551 $ 2,359 $ 808,754
80% reduction in load $ 147,365 $ 267,787 $ 277,782 $ 6,551 $ 1,875 $ 701,360
There are also savings to be made in the maintenance budgets with the focus shifting from
maintaining or replacing bulbs, fuses and gear trays to one of inspecting and washing LED lights
every four or five years and replacing poles and outreach arms.
Maintenance
The Council spends $300,000 each year on maintaining the parts of the existing network that would
be replaced by LED street lights – additional funding covers the replacement of poles and outreach
arms.
The following table outlines potential savings based on reducing maintenance by 80% - leaving funds
to operate the central management system, keep the lights clean and renew or replace poles and
outreach arms (based on a 30-year life cycle).
It should be noted that the savings shown are based on a complete replacement programme –
scenarios indicate savings across different roll-out periods are shown on page 20.
14[STREET LIGHTING IN WELLINGTON CITY]
It should also be noted that subsidies received from NZTA will also be affected by a reduction in
energy consumption and opex and capex spending. These calculations are included in Appendix 1.
CAPEX
2013/2014
OPEX Overall Lighting Potential savings
Totals Renewals Upgrades
Costs
Direct lighting costs $ 2,365,270 $ 531,000 $ 904,455 $ 68,077 $ 3,349,273
45% reduction in load $ 1,432,730 $ 53,100 $ 180,891 $ 68,077 $ 1,632,779 $ 1,716,494
50% reduction in load $ 1,328,870 $ 53,100 $ 180,891 $ 68,077 $ 1,528,919 $ 1,820,353
55% reduction in load $ 1,224,739 $ 53,100 $ 180,891 $ 68,077 $ 1,424,788 $ 1,924,484
60% reduction in load $ 1,120,754 $ 53,100 $ 180,891 $ 68,077 $ 1,320,804 $ 2,028,469
65% reduction in load $ 1,016,755 $ 53,100 $ 180,891 $ 68,077 $ 1,216,805 $ 2,132,468
70% reduction in load $ 912,755 $ 53,100 $ 180,891 $ 68,077 $ 1,112,804 $ 2,236,469
75% reduction in load $ 808,754 $ 53,100 $ 180,891 $ 68,077 $ 1,008,803 $ 2,340,469
80% reduction in load $ 701,360 $ 53,100 $ 180,891 $ 68,077 $ 901,409 $ 2,447,863
Table 4 - potential savings showing all components.
Payback calculations
Although the total price for a full rollout of LED street lights and their associated controlling systems
cannot be determined until an approach is made to the marketplace, a simple payback calculation has
been completed across a range of assumed prices.
Best estimates available to us indicate a good-quality luminaire designed to last at least 20 years will
cost in the range of $350-350 - adding a control system may add another $150 per luminaire and
adopting an adaptive dimming system (Tvlight for example) an additional $330 per unit.
Depending on the extent of technology applied, the quality of lights adopted and the desire of the
Council to maximise energy savings, the simple payback period ranges from 4.2 – 9.2 years.
The following table shows the payback periods for the three amounts ranging from $9 million to $19.6
million (being the best case, mid-range and worst case pricing assumptions) against the savings
indicated above (a full table of payback periods is shown in Appendix 2).
Energy savings
50% 55% 60% 65% 70% 75% 80%
$ 9,000,000 4.9 4.7 4.4 4.2
$ 14,400,000 7.9 7.5 7.1 6.8
$ 15,150,000 7.1 6.8 6.5 6.2
$ 19,650,000 9.2 8.8 8.4 8.0
Table 5 - payback periods
Disposal costs
In replacing the existing lighting assets there will also be a cost in disposing (physical removal,
destruction or recycling and financial write-off) of the existing lighting assets. The overall cost of this
key pricing component can vary if the opportunity is taken to replace other componentry at the same
time. For example this could see cables, outreach arms or fuses being included (or not) in any rollout
programme.
15[STREET LIGHTING IN WELLINGTON CITY]
This element should be calculated based on net current value and included in the total cost or value
of ownership scenarios and shown separately when overall project costs are established.
Levels of service
With LED technologies it is possible to direct lights very accurately which means that less light is
being wasted – this we believe will in turn enable the Council to provide a better level of street lighting
across the city than provided now. Historic pole placements have meant some areas of the city are
not well lit – with LED lighting getting more and more efficient it is now feasible to install additional
lights and still maintain significant energy savings.
An example of this has been demonstrated in Mariri Road and Boundary Road in Kelburn where nine
high-power sodium lights totalling 747 watts (each being 83 watts) were replaced with 11 LED lights
9
totalling 163 watts thus achieving a reduction in energy consumption of 75%.
In this installation the Wellington City Council became the
10
first council in New Zealand to trial the award-winning
NXT luminaire from Canada (right) – although the light is
only rated at 14 watts feedback from the street’s
residents has been very good with favourable comments
received on both the volume and quality of light.
With the ability to use powerful yet highly-efficient lights it
will now be possible to light some of the harder to reach
corners and dark spots previously considered
unreachable. With the use of photocell technology and
exploiting the on/off capabilities of LED lights it will also be possible to light streets the instant a
predetermined level of light has been reached. This will mean that energy savings are maximised and
light is available when needed.
Other benefits
Picture 4 - LED Roadway NXT luminaire
In addition to those already discussed LED street lights offer the following benefits.
Higher efficiency and low light pollution due to directional light:
As LED lights are very directional street lights with a lower lumen output can replace
conventional lamps with a higher output. The light emitted from the LED lamp is directed
downwards, spread throughout the entire area it covers. This means that a lower amount of
light is needed to properly illuminate the area.
9
NOTE: In this installation 10 lights of 14w were used in conjunction with a 21 w light (10x14 + 1x23)
10
In 2014 the NXT was named as “Best in Class” (Roadway – Local Residential) in the 2013 Next Generation
Luminaires Outdoor Lighting Competition as judged by the Illuminating Engineering Society, the U.S. Department
of Energy and the International Association of Lighting Designers.
16[STREET LIGHTING IN WELLINGTON CITY]
Reduced light pollution, which can affect the mood of human beings, navigation in birds and
insects, animals’ lifecycles and flowering in plants. Also no ultraviolet radiation is emitted from
the LED street lamps.
Reduced light depreciation
The loss of brightness or lumen depreciation is slower over the life of an LED lamp than that
of sodium or other types of lamp. Not only does the LED have a longer lifespan than the
conventional lamp, but it stays brighter longer than other lamps thus reducing the need to
replace lights as often.
Better operating characteristics
LED lights operate at lower temperatures, are not sensitive to low temperature and unaffected
by on-off cycling. This makes them safer and more efficient in cold environments.
Resilience
These bulbs are shock- and vibration-resistant making them the best choice for places like
bridges or windy environments.
Dark-sky friendly
Because of the directional light, light is carefully distributed exactly where it is meant to go
and therefore there is no or little light wasted by illuminating the night sky. This is a
considerable plus especially if the local community has a Darksky Initiative (refer Appendix 3).
Natural light spectre – Colour Rendering Index
LED street lamps with colour temperature 3.500-4.200 kelvins are rendering more natural
light than the yellow of sodium lamps or green of fluorescent streetlights. Colour rendering
index (CRI) is high (80-90) and displays the natural colours of illuminated objects.
Free of harmful substances with a lower environmental impact when disposed of.
LED luminaires contain no harmful substances, like mercury, lead or other hazardous
chemical and gases. Spent LED lamps can be disposed of without any special handling since
they are recyclable and environmentally friendly. Other light technology often has hazardous
materials such as lead and mercury requiring special handling and waste management
procedures which have both economic and environmental costs.
Smart lighting networks
In addition to the benefits of adaptive dimming there is thinking among city administrators and
research organisations that a move to LED lighting is just the beginning – the digital era of street
lighting offers many opportunities for cities to maximise the capability of their street lighting network.
17[STREET LIGHTING IN WELLINGTON CITY]
11
One observer, Professor Michael Siminovich from the University of California, recently claimed
“Street lights with control systems offer dynamic dimming during long periods of inactivity, a
feature with tremendous potential to save energy, mitigate waste, reduce light pollution, and
increase public safety. In spite of all these advantages, there is no nationwide control
standard established to date, and LED street lights are being installed en masse without this
important feature. These fixtures are likely to be in use for as long as 20 years, so the fixed-
wattage, un-retrofittable fixtures sold today represent a significant loss in long-term savings
opportunity.”
It is foreseeable that smartphone applications could be used in synergy with the street lighting
network to:
Advise motorists of available parks via satellite navigation devices
Advise of bus arrival times
Perform traffic-count functions
Allow for waste management planning
Transmit remote metering information for area water meters
Transmit wastewater/stormwater pump-station performance data.
It is important that this aspect of taking the city’s street lighting network into the digital era recognises
both the potential of the network and the risk of not being in a position to build on the capability of the
network either through the correct selection of fittings now or the selection of lights that can be retro-
fitted with additional capabilities at a later date.
Without considering the wider capability of the street lighting network there is real potential a straight
replacement of existing technologies with a LED replacement could lock a territorial authority into a
programme of reduced energy savings that make further enhancements to the network’s capability
financially unattractive.
LED lights in Wellington
Wellington City Council has been installing LED lights on a number of pathways over the past few
years with good feedback received in the majority of cases. Where lights have proven to be too
powerful they have been successfully substituted for less powerful options.
With the increased efficacy and directional capability we can now use LED lights to illuminate long
and narrow stretches of pathway without running the risk of lighting up private property or houses.
11
Siminovich, M., UC Davis Professor calls for a state-wide “time out” on further public purchases of led street
lights, University of California, Davis,
18[STREET LIGHTING IN WELLINGTON CITY]
A small number of streets were chosen in Tawa earlier this year for a trial of LED lights from different
manufacturers. These streets, listed below, were chosen due to their proximity to each other, similar
topography and design and limited effects from hills, trees and corners.
Until mentioned the majority of residents spoken to in Tawa have not noticed any difference in the
lighting levels in the ‘trial’ streets – or in fact the lights had been changed.
Additional installations
In addition to the lights discussed above, street lights in Courtenay Place, Allen Street and Blair Street
have been replaced with LED lights. This was undertaken largely to reduce the network load and
lessen the probability of a network failure leaving the area unlit for an unacceptable period of time.
It also reduced the likelihood of Courtenay Place requiring a large trenching project that would have
resulted in significant disruptions to retailers, the hospitality sector, residents and commuters. Overall
the energy consumption for the area has been reduced by 66% (from 19 kilowatts to 6.5 kilowatts).
A lighting design is being completed for Cuba Mall – this will see the mall area lit to the same level as
Courtenay Place, Allen Street and Blair Street - with the intention to reduce the number of poles,
overall energy consumption and unwanted light pollution simultaneously.
This design, which will reduce energy consumption by 83%, will see the existing stock of 16 lights (at
a total of 3800 watts) replaced with a combination of LED lights centrally suspended on a catenary
system and 7 pole mounted lights (640 watts).
Roll-out options
One of the key considerations is the manner in which a project of this nature is implemented – at one
end of the scale is a slow and steady roll-out, possibly within existing budgets and maintenance
strategies and programmes over a period of 7–10 years (for example) and at the other end an
accelerated or rapid rollout carried out as quickly as financially and physically feasible.
The immediate differences can be simply expressed – the longer the rollout the longer it takes to
realise the advantages of LE technologies. This will be manifested in lower energy savings, continued
maintenance and operational costs and reduced purchasing power. The shorter the rollout period the
sooner the savings and benefits can be fully realised.
Reflecting a short, medium and long-term rollout scenario, the following tables illustrate the equation
numerically and also the scenario where the reduction in energy averages just 60%. The 2013/14
maintenance costs are used as a guideline. It should be noted that the maintenance figures are
assumed to remain constant in ratio to the percentage of old lights yet to be replaced.
19[STREET LIGHTING IN WELLINGTON CITY]
Year 1 Year 2 Year 3 Year 4 Year 5 Year 6 Year 7 Year 8 Year 9 Year 10
Installations 50% 100%
Short
OPEX / CAPEX 50% 100% Ongoing reduced budgets
(2 Years)
Energy Savings 50% 100%
Installations 20% 40% 60% 80% 100%
Medium
OPEX / CAPEX 20% 40% 60% 80% 100% Ongoing reduced budgets
(5 Years)
Energy Savings 20% 40% 60% 80% 100%
Installations 12.5% 25.0% 37.5% 50.0% 62.5% 75.0% 87.5% 100.0%
Long Ongoing reduced
OPEX / CAPEX 12.5% 25.0% 37.5% 50.0% 62.5% 75.0% 87.5% 100.0%
(8 Years) budgets
Energy Savings 12.5% 25.0% 37.5% 50.0% 62.5% 75.0% 87.5% 100.0%
Current Year 1 Year 2 Year 3 Year 4 Year 5 Year 6 Year 7 Year 8 Year 9
Purchase 5,850,000 5,850,000
Short (2
OPEX / CAPEX 985,000 492,500 246,250 200,000
Years)
Energy 2,365,000 1,743,012 1,120,754 1,120,754
Totals 3,350,000 8,085,512 7,217,004 1,320,754
Variance over Year One 4,735,512 3,867,004 - 2,029,246
Purchase 2,340,000 2,340,000 2,340,000 2,340,000 2,340,000
Medium
OPEX / CAPEX 985,000 788,000 630,400 504,320 403,456 322,765 200,000
(5 Years)
Energy 2,365,000 2,116,367 1,867,464 1,618,561 1,369,658 1,120,754 1,120,754
Totals 3,350,000 2,904,367 2,497,864 2,122,881 1,773,114 1,443,519 1,320,754
Variance over Year One - 445,633 - 852,136 - 1,227,119 - 1,576,886 - 1,906,481 - 2,029,246
Purchase 1,462,500 1,462,500 1,462,500 1,462,500 1,462,500 1,462,500 1,462,500 1,462,500
Long
OPEX / CAPEX 985,000 861,875 754,141 659,873 577,389 505,215 442,063 386,805 338,455 200,000
(8 Years)
Energy 2,365,000 2,209,706 2,054,141 1,898,577 1,743,012 1,587,448 1,431,883 1,276,319 1,120,754 1,120,754
Totals 3,350,000 3,071,581 2,808,282 2,558,450 2,320,401 2,092,663 1,873,947 1,663,124 1,459,209 1,320,754
Variance over Year One - 278,419 - 541,718 - 791,550 - 1,029,599 - 1,257,337 - 1,476,053 - 1,686,876 - 1,890,791 - 2,029,246
Table 6 - rollout scenario based on a 60% energy saving and 2013/14 maintenance costs
Finance options
A range of finance options are being made available to municipalities considering large capital
investments in energy and cost saving initiatives. This reflects what is happening globally as
municipal authorities look to replace ageing infrastructure.
Some of the options range from the traditional funding through rates to traditional lending against
capital, lease arrangements with manufacturers, power companies, investment funds and service
providers, public-private partnerships and ‘green loans’ with performance-based contracts.
The wider implications, advantages and risks associated with any funding option need to be carefully
balanced against the overall objective of providing a safe, efficient and effective lighting service to
residents, pedestrians, cyclists and motorists.
An advantage of initiatives of this nature is the ability to repay financing through the savings achieved
through reduced energy consumption and maintenance – the greater the energy reduction, the
greater the savings and therefore the shorter the payback period. This also means it is a shorter
period of time before the Council benefits from the reduced costs of providing street lighting services.
The three options appearing to impact the least on ratepayers are the public-private partnership (or
variants), a performance-based lease arrangement or a lending package based on achievable
savings (green lending).
With each of these options the Council is not required to fund the capital expense of the new
technologies itself. Although new to this country in terms of funding options exercised by councils
there are several examples of each approach being exercised overseas that can be explored further
20You can also read