Strength Analysis of Real-Life Passwords Using Markov Models
←
→
Page content transcription
If your browser does not render page correctly, please read the page content below
applied
              sciences
Article
Strength Analysis of Real-Life Passwords Using
Markov Models
Viktor Taneski *,†,‡ , Marko Kompara ‡ , Marjan Heričko ‡                           and Boštjan Brumen ‡

                                          Faculty of Electrical Engineering and Computer Science, University of Maribor, 2000 Maribor, Slovenia;
                                          marko.kompara@um.si (M.K.); marjan.hericko@um.si (M.H.); bostjan.brumen@um.si (B.B.)
                                          * Correspondence: viktor.taneski@um.si; Tel.: +386-40-179-471
                                          † Current address: Koroška cesta 46, 2000 Maribor, Slovenia.
                                          ‡ These authors contributed equally to this work.

                                          Abstract: Recent literature proposes the use of a proactive password checker as method for preventing
                                          users from creating easy-to-guess passwords. Markov models can help us create a more effective
                                          password checker that would be able to check the probability of a given password to be chosen by an
                                          attacker. We investigate the ability of different Markov models to calculate a variety of passwords
                                          from different topics, in order to find out whether one Markov model is sufficient for creating a more
                                          effective password checker. The results of our study show that multiple models are required in order
                                          to be able to do strength calculations for a wide range of passwords. To the best of our knowledge,
                                          this is the first password strength study where the effect of the training password datasets on the
                                          success of the model is investigated.

                                          Keywords: Markov models; passwords; password analysis; password strength; password score


Citation: Taneski, V.; Kompara, M.;
Heričko, M.; Brumen, B. Strength         1. Introduction
Analysis of Real-Life Passwords                Authentication is the core of today’s Web experience. The online services, social
Using Markov Models. Appl. Sci.           networks (e.g., Facebook, Twitter etc.) and websites require an authentication so that users
2021, 11, 9406. https://doi.org/          can create a profile, post messages and comments, and tailor the website’s content so it
10.3390/app11209406                       can match their interests. In an information security sense, authentication is the process of
                                          verifying someone’s identity and typically it can be classified into three main categories:
Academic Editor: Gianluca Lax
                                          knowledge-based authentication-“what you know” (e.g., textual or graphical passwords),
                                          biometrics authentication-“what you are” (e.g., retina, iris, voice, and fingerprint scans),
Received: 20 August 2021
                                          and token-based authentication-“what you have” (e.g., smart cards, mobile phones or other
Accepted: 30 September 2021
                                          tokens). Lately, another alternative authentication method is becoming more available-
Published: 11 October 2021
                                          the two-step verification. We focus on the first category and in particular, on the textual
                                          passwords and their security simply because the username-password combination used
Publisher’s Note: MDPI stays neutral
                                          to be [1,2] and still is the most widely used method for authentication [3], due to their
with regard to jurisdictional claims in
                                          simplicity and cost effectiveness. The problems related to textual passwords and password
published maps and institutional affil-
iations.
                                          security are not new. Morris and Thompson [4] were first to identify textual passwords
                                          as a weak point in information system’s security. More than three decades ago, they con-
                                          ducted experiments about typical users’ habits about how they choose their passwords.
                                          They reported that many UNIX-users have chosen passwords that were very weak: short,
                                          contained only lower-case letters or digits, or appeared in various dictionaries. The afore-
Copyright: © 2021 by the authors.
                                          mentioned problems still exist today and are still being made to solve them. However,
Licensee MDPI, Basel, Switzerland.
                                          users fail to implement the behaviours necessary to stay safe and secure, even though they
This article is an open access article
                                          are aware of the security issues. They create the easiest-to-remember passwords regard-
distributed under the terms and
conditions of the Creative Commons
                                          less of any recommendations or instructions and tend to trade security for memorability.
Attribution (CC BY) license (https://
                                          Some important literature [5–9] proposes the use of a proactive password checker as a
creativecommons.org/licenses/by/
                                          method (beyond simple dictionary lookup and composition rules) for preventing users
4.0/).                                    from entering simple and easy-to-guess passwords into a computer system. The core

Appl. Sci. 2021, 11, 9406. https://doi.org/10.3390/app11209406                                                https://www.mdpi.com/journal/applsci
Appl. Sci. 2021, 11, 9406 2 of 32
property of a proactive password checker to be more effective and more prudent is the
ability to check the probability of a given password to be chosen by the user and hence the
probability to be chosen by an attacker. Some passwords are more likely to be chosen than
others since certain letters and combinations of letters in any given language occur with
varying frequencies.
1.1. Motivation
Some relevant literature [10–13] suggests that Markov models can be used as a tool
that can aid the development of such a proactive checker since they can estimate the
strength of a password by estimating the probability of the n-grams that compose the
password. The estimation can be better if the model is trained on actual password datasets.
However, a recent study in this area [14] suggests that state-of-the-art strength meters
from academia, that are based on probabilistic context-free grammar (PCFG) and Markov
models, are not enough competent at scoring weak passwords (which is basically their
primary goal). They further argue (based on experimental comparison) that Markov models
are no longer suitable for password scoring since they underperform compared to the
PCFG technique. The authors present an explanation for this invalidation of commonly
accepted belief that Markov models could be used to create better proactive password
strength meters/checkers (than probabilistic context-free grammar). The provided rational
states that smoothing techniques (e.g., backoff, Laplace and Good-Turing [13]) used in
Markov models make them better at cracking passwords (i.e., predicting more unseen
passwords), yet this, in turn, makes Markov-based strength meters subject to the sparsity
problem and worse at measuring weak passwords.
Our motivation for this study is based on the weaknesses of Markov models stated
and presented in [14], and the commonly known issues related to Markov models-sparsity
and overfitting [9,13]. As stated in [9,14] at some point the performance of the Markov
model is reduced because the model overfits the data and is not able to properly score weak
passwords anymore. One possible reason (besides the ones stated in [14]) for this issue
could be due to the fact that datasets used for training differ in terms of size, password
types, localization etc. Furthermore, as it is clear from the literature ([9,12,15]), these models
are mostly trained only on one training dataset or, at most, on a few datasets ([16]). This
could limit the performance of the model in terms of properly scoring weak or very strong
passwords. Since training datasets are core in developing the models, it is clear that they
will have some effect in the final password scoring that the Markov model produces, which
is also clearly suggested in [16]. Therefore, what we explore in our study is how significant
is this effect and how other characteristics (e.g., size of the dataset, average password
length, number of unique passwords etc.) affect the final password scoring.
We primarily focus on investigating the effect of different, but similar, training datasets
on strength estimation. For the purpose of our study we analyse publicly available datasets
of “common passwords” and process them regarding the frequency distribution of letters
these passwords contain. Based on these datasets and the frequency distributions, we built
different Markov models. This would help us find out if one Markov model is sufficient, or
if multiple models are needed for the password checker to be effective for a wide range
of passwords. To the best of our knowledge, this is the first time where the effects of the
training dataset on the final password score are investigated in detail.
1.2. Goals
The goals of this paper are: (i) to find out if different Markov models (trained on
different password datasets) will provide statistically different results when tested on the
same password dataset, (ii) to find out if one model (that is trained on one big dataset,
composed of multiple different datasets) is sufficient for creating an effective password
checker, and (iii) to find out if Markov models of different orders (specifically of first
and second order) will produce statistically different results. We address these goals by
focusing on investigating whether there is a statistically significant difference in the scoresAppl. Sci. 2021, 11, 9406 3 of 32
from different models, trained on different training datasets. Furthermore, we investigate
whether the order of the model has some significant effect on the success of the model.
1.3. Contributions
We make three contributions in this area. The first, and also the novelty in this research
field, lies in training the models on a variety of datasets (12 in total), each with different
characteristics, and testing them on the same password dataset in order to investigate the
effect of the dataset on the success of the model. In particular, we show that the dataset has
a significant effect on the final scoring of the passwords. The fact that different training
datasets can lead to statistically different password scores, leads us to the conclusion that
it is very important what kind of dataset is used to train the Markov models. We argue
that one universal dataset should not be used to train one Markov model if we want to
have an effective password scoring tool. The second contribution is the confirmation of
our previous statement: the use of multiple different Markov models is better for efficient
estimation of password strength rather than using one universal model, which is trained on
one big dataset that combines multiple different datasets. Finally, the third contribution is
that we showed that the difference in outputs between two Markov models with different
orders (1st and 2nd) is, in most cases, not statistically significantly different. Therefore,
the general conclusion here is that, without a doubt, it is important to analyse the dataset
before selecting the order of the model.
Overall, we show that if we want to have an effective password scoring tool for
calculating the strength of a wide range of passwords, it would be required to use multiple
different Markov models, which should be constructed and trained on a particular dataset
of passwords so that they can be more efficiently used on that particular password group.
1.4. Organization
The rest of the paper is organized as follows: we present and review the related work
in Section 2, and we provide some background of Markov models in Section 3. In Section 4
we describe our experimental methodologies, the construction of our models, the datasets,
and the processing of the datasets we used, including the choice of training/testing datasets.
Next, we present the results of our study in Section 5. We discuss the results and the ethical
considerations of the study in Section 6. In Section 7 we present our final conclusions.
2. Related Work
In this section, we provide a short review of relevant previous studies that deal with
calculating the password strength or password cracking process and are closely related to
Markov models.
The strength analysis of users’ passwords has been one active research area since
passwords were exposed as the weakest link in information system’s security in 1979
by Morris and Thompson. There are various techniques that have been used for both
calculating the strength of the password and enhancing the password cracking process.
2.1. Basic Password Strength Calculation
The basic password strength calculation is done by a simple password policy or, as it
is also called-a password rule system. Such a system has the ability to estimate the strength
of a given password by analysing its structure i.e., the number of upper case, lower case,
or whether it contains numbers or special characters. The estimation is a binary result
which tells whether the passwords meets the requirements of the policy or not. One major
weakness of a password rule system is that users and their textual passwords are still
considered “the weakest link”. Users tend to choose weak passwords and passwords that
are easy-to-guess and can be found in a dictionary [17]. Because of this, such a password
rule system fails when it comes to preventing weak passwords from entering the system.
For example, a password “Password1!” may be acceptable for the password rule system (it
contains an upper case, a number and a special character), but it is still the most commonAppl. Sci. 2021, 11, 9406 4 of 32
and one of the easiest passwords to be cracked (with the use of a personal computer it can
be cracked within seconds). We need more advanced password rules that can additionally
check the possibility that a given password can be chosen by the attacker. This is where
Markov models come to the rescue since they can be used as an aid to brute-force or
dictionary password cracking.
2.2. Entropy
One of the earliest method for password scoring is entropy. In information theory,
entropy is the expected value of the information contained in a message. Authors in [18]
attempt to determine the effectiveness of using information entropy (more specifically,
Shannon entropy) as a measurement of the security of various password policies. They
accomplish this by analysing the success rate of standard password cracking techniques
against multiple sets of real-life passwords. Their experiments show that password entropy
does not provide a valid metric for measuring the security provided by password creation
policies. Furthermore, they found that the most common password creation policies remain
vulnerable to online attacks, since users are using easy-to-guess passwords that still comply
with the requested policy (e.g., ”Password1!”).
2.3. Probabilistic Context-Free Grammars
Another tool for password cracking are probabilistic context-free grammars as an
aid in the creation of word-mangling rules, proposed by Weir et al. in [19]. Probabilistic
password cracking is based on the assumption that not all guesses have the same prob-
ability of cracking a password (i.e., some passwords are more probable to be guessed
than others). Probabilistic context-free grammars are based on a probability distribution
of user’s passwords and measure the frequencies of certain patterns associated with the
password strings. Authors trained this method on different sets of previously disclosed
passwords. They used some of the sets for training and others for testing the solution and
calculating password probabilities. As a comparison against the PCFG password cracking
technique, authors use John the Ripper’s default word-mangling rules. The results of the
study show that this technique performed better than John the Ripper by cracking 28–129%
more passwords, given the same number of guesses.
A study by Houshmand et al. [20] presents an improved PCFG for password cracking
by systematically adding keyboard patterns and multi-word patterns to the context-free
grammars used in probabilistic password cracking. They state that while their probabilistic
password cracking approach shows consistent effectiveness, at one point it gets “stuck” in
a dead end. Authors suggest that maybe at that point it is better to support Markov or
brute force guessing.
2.4. Markov Models
One of the earliest use of Markov models as a password cracking tool was by
Narayanan and Shmatikov in [10]. They used them as an improvement of rainbow ta-
ble cracking, by training Markov models to general rules that passwords follow. They
show that Markov models might have an important application for distributed password
cracking. This work also is the first to hint that Markov models can be used as a tool for
calculating password strength and shows that they can perform better than the Rainbow
attack by recovering 96% of the passwords over the 39% recovered by the Rainbow attack.
Later, a survey of the most common techniques used in public and private tools
for enhancing the password cracking process was made by Marechal [11]. The paper is
mainly focused on using Markov models as a powerful tool for password cracking and as
a password generator, for generating the most common passwords used as a supplement
for the dictionary or the brute-force attack. The findings in this paper show that the
Markov password generator, despite it being slower than John the Ripper [21] was actually
performing better. According to this study, Markov tools can be included in a password-Appl. Sci. 2021, 11, 9406 5 of 32
checking policy so it can be more effective than those that only check the structural content
of the password.
Different password cracking techniques (attacks) were analysed by Dell’ Amico et al.
in [9] in order to find out what is the probability of breaking a given password. The authors
compared the search space against a number of cracked passwords for guessing techniques
like dictionary attacks, brute force, dictionary mangling, probabilistic context-free grammars,
and Markov models. These password cracking techniques were tested on three different large
datasets of passwords. Their findings show that no single cracking strategy prevails over
the others: dictionary attacks are most effective in discovering weak passwords, dictionary
mangling is useful when the base dictionaries are exhausted and Markov-model techniques
are powerful in breaking strong passwords. The authors of the study believe that proactive
password checking is a better approach in persuading the users to put more effort into
choosing their password.
Markov models as a tool for calculating password strength were already mentioned
in [11] where the authors showed that password crackers based on Markov models can
outperform existing cracking techniques. In [12] Markov models are used as a concept for
adaptive password strength meters that can estimate the password strength. Password
checkers have a very important role in providing security of computer systems since they
are the mechanism that should prevent bad passwords from getting into the system. This
study focuses on building adaptive password strength meters based on Markov models.
They measured the accuracy of their construction by comparing the scores of the meter to
the scores of other meters (Google, Microsoft etc.) as well as to the ideal password strength
meter. The results of the study show that their Markov-based password strength meter
achieves higher accuracy and outperforms commonly used password meters.
A similar probabilistic framework for estimation of password strength is proposed
in [15]. The proposed framework is based on a very large public dataset containing
75,000,000 unique passwords. As part of the framework, two different Markov mod-
els are considered and tested: simple Markov model, where the transition probability from
one character to another depends only on the previous state, and layered Markov model,
where the transition probability also takes into account the position of the character in
the given password. Both models are analysed and tested using different independent
datasets simulating a conventional password guessing attack. The authors argue, based on
the results of the study, that such a probabilistic framework may be capable of providing
a better estimation of the strength (i.e., the resistance to attacks) of a password. In [13]
Markov models were also proven to perform slightly better than the PCFG proposed by
Weir et al. in [19]. Through a systematic evaluation of many different password models
using 6 real-world plaintext password datasets, with about 60 million passwords, they
show that the model based on PCFG does not perform as well as the Markov model.
A related study presents results regarding the performance of Markov models that
counteract with the previous ones. Authors in [14] performed an experiment where they
tested existing password scoring meters from the industry (e.g., Zxcvbn, KeePSM and NIST
PSM) and academia (PCFG-based ones and Markov-based ones). Their results show PCFG-
based meter performs best among existing password scoring meters. Their conclusion
is that the PCFG-based model is better at measuring passwords, and the Markov-based
model is better at cracking passwords. Furthermore, the authors present a novel password
strength meter based on a fuzzy probabilistic context-free grammar. It can react dynamically
to changes in how users choose passwords.
A recent study [16] performs an extensive and empirical analysis of Chinese web
passwords where the authors evaluate the security of these passwords by employing two
state-of-the art cracking techniques: PCFG and Markov models. Their results show that
Chinese passwords are more prone to online guessing than English passwords. Further-
more, this study explores how password scoring meters measure the password strength,
which leads the authors to the claim that in order for a PSM to be accurate, its training setAppl. Sci. 2021, 11, 9406 6 of 32
should be representative of the password base of the target site and that there is no single
training set that can fit all PSMs. This claim is what we explore further in our study.
2.5. Neural Networks
Neural networks can be considered as a statistical technique in pattern recognition.
They implement non-linear mappings from several input variables to several output
variables, where the form of the mapping is governed by a number of adjustable parameters.
A neural network learns how to compute a mapping by trial and error, through a certain
parameter optimization algorithm. Such an algorithm, due to the biological premises of
the theory of neural networks, is called a learning algorithm. During the learning process
(also called training), the network receives a sequence of examples and adapts its internal
parameters to match the desired input-output functionality. The knowledge to compute
the mapping is therefore acquired during this learning process and it is stored in the
modified values of the internal parameters. It is known that neural networks have been
used for generating the probability of the next element in a string based on the preceding
elements [22,23] (e.g., in generating the string password, a neural network might be given
passwor and output that d has a high probability of occurring next).
Since password creation is conceptually similar to text generation, it was somehow
inevitable for neural networks to become more commonly used as a tool for password scor-
ing and password generation. Their main advantage over other password scoring methods
is their speed and lightweight regarding memory requirements. One of the first times
where neural networks have been fully and successfully applied to designing proactive
password checkers is presented in [24]. This study presents a way of using neural networks
in a password checker solution. The authors applied SLP (Single Layer Perceptrons) and
MLP (Multilayer Perceptron) networks to the design of proactive password checking. They
have evaluated the performance of several network topologies and compared the MLP
networks with kernel-based and fuzzy-based neural network models. Their comparison of
classification rates obtained by their solutions with previous proactive password checkers
showed that proactive password checkers based on this technology have high efficiency
and efficacy.
Another study [25] describes how to use neural networks to model human-chosen
passwords and measure password strength. In their study authors comprehensively
test the impact of varying the neural networks model size, model architecture, training
data, and training technique on the network’s ability to guess different types of passwords.
Furthermore, this study compares the implementation of neural networks to state-of-the-art
password-guessing models, like probabilistic context-free grammars and Markov models.
This comparison shows that in general neural networks at high guesses outperform other
models, with some exceptions which are related to the training dataset (in this case authors
used a combination of datasets-one of which is the Rockyou training dataset used also in
our experiment). The main contribution of this study is the client-side implementation of a
proactive password checker based on neural networks. It is implemented in JavaScript and
light-weighted (requires only 60MB of disk space).
2.6. Summary of the Related Work
Based on the reviewed related work regarding Markov models, we can say that
Markov models can be used as an efficient tool for successful cracking of difficult passwords,
even though they have some setbacks (like overfitting). We argue that they can be used as
a framework for estimating password strength in a proactive password checker, as long as
they are properly trained and properly developed (see Section 1.1). Our approach has a
similar background as some of the related work that we described. In this work, we inspect
the possibility of using one universal Markov model, or multiple different models, as a
mechanism for password checking, by analysing publicly available datasets of passwords
that we used to train and test our Markov models on.Appl. Sci. 2021, 11, 9406 7 of 32
3. Background
Markov model is a stochastic process where the next state of the system depends
only on the present state and not on preceding states [26]. That is, only on the single
present state and not the history of the states. Markov models are commonly used as a
language processing tool in speech recognition systems, like in [26], but they can also be
used in other fields, particularly in the context of passwords. Such Markov models have
already been used before (see Section 2) as an aid to brute-force or dictionary password
cracking. These models are based on the fact that particular characters or sub-strings in
a particular language area have a higher frequency of occurrence than others (e.g., the
string “the” is much more likely to occur than “tqe” and the letter e is very likely to follow
“th”). This approach can be used to calculate the strength of the password, by defining
a probability distribution over a sequence of characters, which constitutes the password.
Such constructed Markov model assigns each password a probability P, which is calculated
differently based on the order of the Markov model. The general equation for calculating
this probability is [12]:
l
P(“c1 c2 ...c00l ) = P(ci |c1 ...cn ) ∏ P(ci |ci−n+1 ...ci−1 ). (1)
i=n
and can be applied to every order of the Markov models.
The models used by Narayanan and Shmatikov are zero-order model and first-
order model.
Zero-order Markov model is a Markov model, where the characters are independent
of each other i.e., each character’s probability is calculated according to the underlying
frequency distribution and independently of the previous characters.
On the other hand, first-order Markov model is a Markov model, where each 2-gram
(i.e., diagram, ordered pair, or a sub-string of length 2) of characters is assigned a probability
by looking at the previous character. The probability assigned to a password “c1 c2 ...cl ” in
the case of a first-order Markov model would be ([13]):
P(“c1 c2 ...c00l ) = P(c1 ) P(c2 |c1 ) P(c3 |c2 )...P(cl |cl −1 ). (2)
The probabilities P(α j |αi ) are called conditional transitional probabilities and denote the
probability of a transition to state α j when the automata is in state αi . In the context of
passwords that would be the probability of a character ci following the character ci−1 . The
conditional probabilities can be easily computed with the following formula ([13]):
count(ci−1 ci )
P ( c i | c i −1 ) = (3)
count(ci−1 x )
where count(ci−1 ci ) presents the number of occurrences of the sub-string ci−1 ci and
count(ci−1 x ) denotes the number of occurrences of ci−1 when followed by another character
x. This character x is part of the password’s alphabet A, i.e., the set of distinct characters
that are identified in a particular password dataset, which is also the number of possible
states of the Markov model. The number of sub-strings ci−1 x in a particular dataset is
by definition equal to: count(ci−1 x ) = ∑ci ∈ A count(ci−1 ci ). By using this substitution, the
above Equation (3) takes the form:
count(ci−1 ci )
P ( c i | c i −1 ) = . (4)
∑ci ∈ A count(ci−1 ci )
The transitional probabilities (P(α j |αi )) between the states of the model (α j being the
current state and αi being the previous state) are described by a matrix called transition
probability matrix or simply transition matrix. Each value P(α j |αi ) denotes the probability
that, given the model is currently in state αi , it will be in state α j in the next step.Appl. Sci. 2021, 11, 9406 8 of 32
The power of Markov models lies in the ability to use the transition matrix for de-
termining the probability of the model being in a certain state after a certain number of
steps (more than one). For e.g., if we have a transition matrix with probabilities for the
various kinds of weather, we can denote the probability for the weather being rainy, sunny
or snowy two, three or four days from now. This probability is denoted by Pαni α j , where:
• αi denotes the current state of the model
• α j denotes the next state of the model
• n denotes the number of steps
The probabilities Pαnj αi are calculated by setting the transition matrix to power n-the
number of steps.
When the above statements are applied to the passwords, the transitional probabilities
simply represent the probability of a character c j appearing after a character ci in a certain
position in the password, which corresponds with the number of steps (n). Having this in
mind we can transform Equation (2) into:
P(“c1 c2 ...c00l ) = P(c1 ) P(c2 |c1 )1 P(c3 |c2 )2 ...P(cl |cl −1 )l −1 . (5)
From the above equations, we can see that the probability P basically represents the
probability of occurrence of a sequence of characters and the order of the characters in
the password. This probability is obtained by analysing the frequency distribution (the
number of occurrences) of these characters in a suitable training dataset.
It is important to note that the probabilities of the first characters P0αi are represented
by an initialization vector. The initialization vector basically holds the probabilities of every
character occurring in the first position in a password.
The final score assigned to the password is a number that is computed by using the
following equation [15]:
S(“c1 c2 ...c00l ) = −10log10 P(”c1 c2 ...cl ”), (6)
so that the less likely it is to produce the password, the stronger it is according to the model.
Needless to say, the frequency distributions of the characters used in keyspace com-
pression via Markovian filtering is language-specific, and the distribution used in this
paper applies only to passwords chosen by English-speaking users (presumably, similar
distributions can be found for other alphabet-based languages).
4. Materials and Methods
In this section we justify our decision on using first-order Markov models, we describe
our method, the development of the models, give a description of the datasets we use, and
present the selection of training/testing datasets.
4.1. Constructing the Model(s)
We used Equations (2) and (4) for building our models and Equation (6) for calcu-
lating the Markov scores for the passwords from the testing dataset. Our constructed
models are Markov models of first order (the model is applied to sub-strings of length two),
which means that the model keeps track only of the previous state of the system-i.e., the
probability distribution of the current character depends only on the previous character in
the password.
In our practical case, the number of states i.e., the number of distinct characters that
we search in the datasets and used in our models is A = 224, coinciding with the set of
ASCII characters from character code 32 to 255. This character set includes all characters
from the extended ASCII table, except for the initial 32 characters which are basically
unprintable control codes and are used to control peripherals such as printers. To the best
of our knowledge, such a large number of possible states of a Markov model hasn’t been
explored and used for password scoring yet [10,12,13,15].Appl. Sci. 2021, 11, 9406 9 of 32
The output of the model is a real number indicating the password strength. Following
the approach in [15], in the case of passwords that are assigned a probability of occurrence
of 0 by the model, the final password strength is assigned 4000, which represents a very
high strength (so we can avoid infinite values). The value 4000 was selected because the
highest values that models otherwise achieved were only over three thousand (maximum
value is never over 4000). Further in the paper, we refer to this situation as the model was
unable to calculate the password strength.
For calculating the password strength we used Equation (5), which represents the
probability of a character (or a character sequence) occurring after a certain number of steps
of the model (i.e., a certain position in the password) and Equation (6), which represents
the final score of the password.
The initialization vectors are also trained on the same database subsets as the respec-
tive models. They represent the probability that a password initiates with each of the
224 characters.
To create the model and calculate the scores for the test passwords, we first need
to train the Markov model over a known distribution. This distribution can simply be a
publicly available set of passwords from a previously attacked dataset. These datasets are
further described in the following subsection.
4.2. Data Collections
We used 12 datasets that contain real user passwords in plaintext that were leaked and
are publicly available for research purposes. These password datasets represent real user
passwords, which were compromised by hackers and subsequently publicly disclosed on
the Internet. We used only the password information in the datasets and we removed all
additional information like user names and/or email addresses included in some datasets.
The “RockYou” dataset [27] contains over 14 million passwords leaked from the social
application site RockYou in December 2009. The “10 million combos” dataset [28] contains
10 million passwords collected and cracked by Mark Burnett for research purposes. The
dataset also contained user names that are connected to the passwords. In order to maintain
the anonymity of these informations, we removed the related user names and focused only
on the released passwords. The “PhpBB” dataset [27] contains about 180.000 passwords
cracked from MD5 hashes by Brandon Enright leaked from Phpbb.com in January 2009. The
“MySpace” dataset [27] includes 37.000 passwords that were obtained via phishing attack in
October 2006. The “faithwriters” dataset contains 8K passwords stolen from the religious
forum Faithwriters. The basic information and the sources of the rest of the datasets are
presented in Table 1. For additional details, readers are referred to original works.
Table 1. Basic information of datasets.
Dataset Size Date Obtained Source
rockyou 14,344,390 12-2009 [27]
10_million_passwords 10,000,000 02-2015 [28]
passwords 2,151,220 12-2011 [29]
uniqpass_preview 1,999,984 12-2011 [29]
phpbb 184,389 01-2009 [27]
scribd 106,358 Unknown Source unknown
tuscl 38,820 Unknown [27]
myspace 37,139 10-2006 [27]
singles_org 12,233 10-2010 [27]
10k_most_common 10,000 06-2011 [30]
hotmail 8930 Unknown [27]
faithwriters 8347 03-2009 [27]Appl. Sci. 2021, 11, 9406 10 of 32
4.3. Data Processing
Since our goal is to create multiple Markov models and test them on the same testing
dataset, we decided not to merge all datasets into one big dataset and then partitioning it
into training and testing. Such an approach can also cause some frequent passwords or
passwords with similar length, or some pattern distributions, to appear both in training
and testing, thus introducing bias. Furthermore, since the datasets differ from each other in
terms of scope, size, password security policies under which passwords were constructed
etc., we were not able to decide which datasets will be used for training and which for
testing, because our results could easily be biased based on the selection of the training
datasets. Therefore, we decided to partition the datasets in the way that is shown in
Figure 1. Before the partitioning took place, we first randomized our datasets. Then, half
of the passwords in each dataset were used as a training dataset for building a Markov
model and the other half was added to our common testing dataset. In the end, we have 12
different models that are trained on 12 different datasets, and a common dataset for testing
the models.
Figure 1. Graphical presentation of the process of dividing datasets and combining them into one
dataset for testing.
After we partitioned our datasets into training and testing datasets and constructed
our models, we run every model on the same testing dataset, which contains over 14 million
passwords. The input of each Markov models is the testing dataset, while the output is a
set of calculated scores appropriately for each of the passwords from the testing dataset.
The process is presented in Figure 2.
Figure 2. Graphical presentation of the process of calculating the passwords’ strength with
different models.Appl. Sci. 2021, 11, 9406 11 of 32
5. Results
In this section, we present the results of our study. First, we analyse the datasets
and the frequency distribution of the characters inside the datasets. Then we analyse the
passwords in the datasets regarding their construction like length, numerical, upper case,
lower case, alphanumerical, the containment of special characters etc. Finally, we present
our main results regarding our analysis of the connection between the models and the
scores of the testing passwords.
5.1. Character Frequency Analysis
The character frequency distribution is the basis for constructing a Markov model for
the purposes of either cracking passwords or computing its Markov score i.e., its strength.
We performed character frequency analysis on our datasets of disclosed real-life passwords
(see Appendix A).
Since the datasets are acquired from different sources, we expect them to differ in
terms of character frequency distribution, which is important for our research, since we are
trying to create different independent models. We present a couple of findings that point to
this assumption. First, in almost all of the datasets, the most frequent characters are numbers,
lower-case letters and upper-case letters, but the 10k_most_common and uniqpass_preview lack
upper-case letters. Likewise, special characters from the basic ASCII table are not present
in all the datasets. Second, the RockYou dataset contains characters from the extended
ASCII table, which other datasets do not, so we expect this dataset to produce significantly
different password scores from the testing dataset.
In order to confirm our assumption about the statistically significant difference be-
tween the datasets in terms of character frequency distribution, we performed a statistical
analysis of the character frequency for all datasets. We used the nonparametric Friedman’s
ANOVA statistical test for multiple repeated measures since the Shapiro-Wilk test for
normality showed that all of the differences between pairs of datasets do not conform to
a normal distribution (p < 0.05 in all cases). The Friedman’s ANOVA test did find that
there are statistically significant differences (χ2(11) = 259, p < 0.001). This confirms our
assumption and gives us the ability to continue with our experiment and analysis since
this meets the condition for diversity; this condition is met when at least one dataset is
different from the others.
5.2. Data Collections Characteristics
Before we present our main results, we present some summary statistics about our
datasets, regarding the characteristics of the passwords they contain. We are interested in
passwords characteristics like the average length, uniqueness, the percentage of passwords
that were only numerical, only lower-case letters, only upper-case letters, mixed-case
letters, alphanumerical, and that contain at least one special character.
Table 2 shows a summary of the distributions of passwords and the average password
length in each dataset. As we can observe, the most common passwords in every dataset
are alphanumeric passwords.
Table 3 shows the percentages of passwords that appear 1–5 or more times in ev-
ery dataset. As we can observe from the table, out of all 12 dataset only three (10_mil-
lion_passwords, passwords, and scribd) do not contain a 100% unique passwords. The high
percentage of uniqueness of the datasets goes in hand with our experiment, since it allows
us to train our models over a wide variety of passwords.Appl. Sci. 2021, 11, 9406 12 of 32
Table 2. Passwords information.
Dataset Digits Only Lowercase Only Uppercase Only Mixedcase Alphanumeric A special Character *
1. rockyou 16.36% 26.06% 1.61% 1.12% 47.51% 6.82%
2. 10 million passwords 20.36% 38.25% 1.09% 2.52% 35.90% 1.10%
3. passwords 23.22% 23.85% 0.75% 1.56% 47.08% 3.02%
4. uniqpass preview 6.70% 28.96% 0.00% 0.00% 48.86% 15.48%
5. phpbb 11.24% 41.25% 0.93% 2.69% 41.19% 2.13%
6. scribd 0.27% 81.71% 0.18% 7.57% 2.94% 7.32%
7. tuscl 8.70% 42.36% 0.94% 2.38% 43.17% 1.72%
8. myspace 0.72% 6.75% 0.29% 0.18% 80.43% 10.66%
9. singles_org 8.37% 55.11% 2.26% 4.37% 29.00% 0.24%
10. 10k most common 5.54% 83.10% 0.00% 0.00% 11.20% 0.16%
11. hotmail 18.52% 41.59% 2.21% 1.05% 29.50% 6.93%
12. faithwriters 6.27% 50.15% 1.32% 3.83% 37.14% 0.53%
* the password contains at least one special character.
Table 3. Passwords frequency information.
Dataset Size Unique Twice 3 times 4 times 5+ times
1. rockyou 14,344,390 100% 0% 0% 0% 0%
2. 10_million_passwords 10,000,000 44.34% 3.86% 1.21% 0.6% 1.89%
3. passwords 2,151,220 99.96% 0.02% 0% 0% 0%
4. uniqpasss_preview 1,999,984 100% 0% 0% 0% 0%
5. phpbb 184,389 100% 0% 0% 0% 0%
6. scribd 106,358 75.68% 12.12% 0.03% 0% 0%
7. tuscl 38,820 100% 0% 0% 0% 0%
8. myspace 37,139 100% 0% 0% 0% 0%
9. singles_org 12,233 100% 0% 0% 0% 0%
10. 10k_most_common 10,000 100% 0% 0% 0% 0%
11. hotmail 8930 100% 0% 0% 0% 0%
12. faithwriters 8347 100% 0% 0% 0% 0%
Table 4 shows the average password length in our datasets. The table shows that the
average password length (weighted by the size of the datasets) is 8.38 characters, which is
in line with findings in [17,31,32].
Table 4. Password length.
Password Length
Dataset Size
Mean Standard Deviation
rockyou 14,344,390 8.75 2.898
10_million_passwords 10,000,000 7.59 2.15
passwords 2,151,220 8.37 1.995
uniqpass_preview 1,999,984 9.92 3.51
phpbb 184,389 7.54 1.75
scribd 106,358 7.51 2.6
tuscl 38,820 7.37 1.75
myspace 37,139 8.23 2.6
singles_org 12,233 6.74 1.19
10k_most_common 10,000 6.30 1.3
hotmail 8930 8.79 2.89
faithwriters 8347 7.71 1.86
Simple average 7.9
Weighted average 8.38Appl. Sci. 2021, 11, 9406 13 of 32
5.3. Main Results
Each model produced 11,924,618 results. Table 5 shows the descriptive statistics for
the results of all 12 models. From it we can quickly notice some distinguishable differences
between the models. The mean values range from 132.99 to 3003.56, medians are between
120.22 and 4000.00, and standard deviations range from 95.21 to 1895.30. All of these
differences are very big and at least one reason for this can be seen in the mode statistic.
The mode of all models is 4000. This is not surprising as the models assign this value to
passwords for which they are unable to calculate the strength. As the passwords that could
not have their strength calculated are considered to be stronger than the rest we assigned
them the highest value. In our case the value 4000 acts similarly to a ceiling value, resulting
in a distribution with a ceiling effect (which, in turn, compromises the normal distribution
of the models).
Table 5. Descriptive statistics for the password strengths produced by the 12 models.
Dataset Mean Median Mode Std. Deviation Maximum
10_million_passwords 146.26 120.22 4000 257.99 4000
10k_most_common 1074.47 126.20 4000 1671.79 4000
faithwriters 1286.00 141.36 4000 1772.61 4000
hotmail 632.37 127.12 4000 1303.92 4000
myspace 487.87 132.53 4000 1111.33 4000
passwords 1656.88 161.35 4000 1895.30 4000
phpbb 174.87 128.49 4000 381.38 4000
rockyou 132.99 120.69 4000 95.21 4000
scribd 3003.56 4000.00 4000 1690.55 4000
singles_org 750.01 127.06 4000 1425.36 4000
tuscl 427.66 127.33 4000 1027.52 4000
uniqpass 657.80 126.40 4000 1332.94 4000
An example of this can be seen in Figure 3. Figure 3 shows the distribution of myspace
model. In the right part of the graph, we can see the large increase in the frequency of the
ceiling value.
Figure 3. Distribution histogram for the myspace model.
All models produce such an effect to a greater or lesser degree. Even though the
mode of all the models is 4000 it might pay to take a closer look at the frequency of this
value in different models. After all the scribd model has a median that is the same as the
ceiling value, meaning more than half the results outputted by this model were 4000. HighAppl. Sci. 2021, 11, 9406 14 of 32
frequencies of such values could also mean a bad training dataset that was not able to
accurately measure the strength of passwords from the testing dataset.
Many ceiling values would inflate the average statistics and the standard deviation.
We can see this is in Figure 4, where the number of ceiling values that each model produces
is shown. Comparison between Table 5 and Figure 4 indicates that the size of the mean is
connected with the number of ceiling values each model produces–the order of models,
sorted by their mean size is the same as the order of models when sorted by the number
of ceiling values. This will probably be the most important defining characteristic of
successful models, because of the way we define a good password checking model. The
best model is the one that is the most severe with the passwords it is checking (i.e., it
produces the smallest values) because when dealing with the security we should always
be prepared for the worst-case scenario. An excessively stringent model promotes the
use of safer passwords, while an overly mild model gives good marks to less desirable
passwords and creates false confidence in those passwords. Models with more ceiling
values will on average and when compared, value by value, to another model be more
prone to show higher password strengths and will therefore be determined to be less
desirable for evaluation of password strengths.
Figure 4. Frequency of ceiling values for each model.
When comparing models by their frequency of ceiling values (Figure 4), we can notice
large differences between them. The most successful model at avoiding ceiling values and
therefore the most successful at calculating the strength for any password turned out to be
the model created from the biggest password dataset—rockyou. It was unable to calculate
only 5417 passwords (0.045%), while on the other hand scribd failed to calculate the strength
of almost 8.9 million passwords (74.2%).
Figure 5 shows how many models were unable to calculate individual passwords. For
approximately half a million of passwords used in the testing dataset, every single model
was able to successfully calculate their strength. Those are most likely the very weakest
of passwords, constructed from very common characters. Of the approximate 12 million
passwords used in the testing dataset, almost 2.55 million passwords failed to be calculated
by one model, 4 million by two models, etc. (see Figure 5). The strength of the most
complex passwords was impossible to calculate for up to nine models. This means that
for every single password at the very least three models were able to compute its strength.
As we have seen in the previous graph every single model had difficulties calculating the
strength of some passwords. However, we have now seen that every password could
be processed by at least a few models. This gives us the first indication that the use of
multiple models is required in order to be able to do strength calculations for a wide range
of passwords.Appl. Sci. 2021, 11, 9406 15 of 32
Figure 5. The number of times models were unable to calculate each passwords strength.
Friedman’s ANOVA test is a non-parametric statistical test used for one-way repeated
measures analysis of variance by ranks. The Friedman test was selected, because as
is clear that the model outputs are not normally distributed. Considering the sample
size, the significance level was set at 0.001. Test results show statistically significant
differences between the distributions of Markov models trained on different datasets,
with χ2(11) = 14,629,394.673 and p < 0.0001. Consequently, we reject the null hypothesis,
stating that the distribution of scores in all models are the same and accept the alternative
hypothesis confirming that at least two of the models’ distributions differ.
For post hoc testing the Sign test was used, to compare every possible pair of models.
When looking at the difference between all 66 model pairs none had a normal distribution
and the majority of them were also nowhere close to symmetrically distributed. Because
other statistical tests assume that one of the two distributions is a normal distribution, the
Sign test, which makes no assumptions about the distribution, was used.
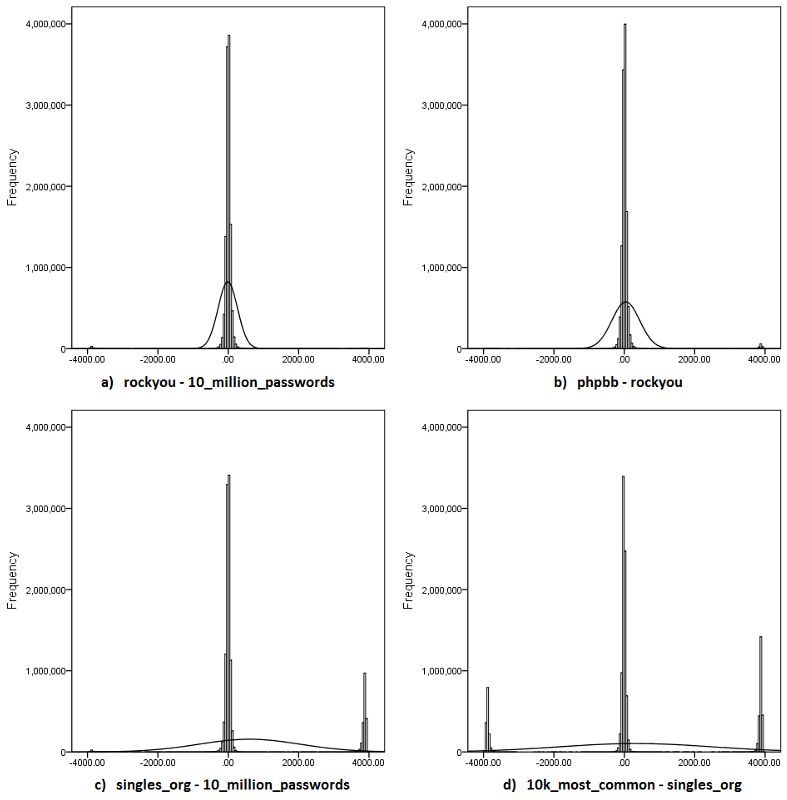
For post hoc testing the Wilcoxon Sign test was used, to compare every possible pair
of models. The Sign test was selected because the data meet all the required assumptions
(explained below). Figure 6 contains a selection of four differences between models with
normality curves. Graph a in Figure 6, for example, shows the distribution of 10_mil-
lion_passwords model results subtracted from the results of the rockyou model. Here the
distribution is fairly symmetrical, but as we map the differences of more diverse models
the distributions become more and more skewed. When looking at the difference between
all 66 model pairs none had a normal distribution and the majority of them were also
nowhere close to symmetrically distributed (Figure 6a,b graphs are the closest). Because
other statistical tests assume that one of the two distributions is a normal distribution, the
Sign test, which makes no assumptions about the distribution, was used.Appl. Sci. 2021, 11, 9406 16 of 32
Figure 6. Four examples for the distribution of differences between two models.
Pairwise comparisons were performed with a Bonferroni correction for multiple
comparisons. Statistical significance was therefore accepted at the p < 0.000015 level. The
results for all 66 pairs can be seen in Table A1. Based on the results we reject the null
hypothesis (the median of the differences between two models is 0) for all 66 pairs and
accept the alternative, stating that the median of the differences between two models is not
equal to 0. This was, because the sample size and nature of data, somewhat expected. For
this reason, we also included effect size [33]. Effect size is a measure of magnitude or size of
an effect (the observed phenomenon). Effect size is calculated with the following formula:
√
r = Z/ N, (7)
where r is the effect size, Z is the z-value produced in the sign test, and N is the number of
observations. Bigger r value means a more substantial difference between the results of the
two models. Using Cohen criteria, we interpret the size of the effect. Effect size between
0.1 and 0.3 is considered to be small, but definitely not trivial or something to be ignored.
Bigger values that are smaller than 0.5 are said to have a medium effect, while r values over
0.5 represent a large effect. To simplify and make the effect size more understandable we
also calculate the common language effect size (CL), also called probability of superiority.
CL gives the probability that a random score from one model will be higher than its
matching pair in the second model. CL is calculated by dividing the positive differences by
the number of comparisons. The number of comparisons excludes ties (pairs where both
models produce the same value). Effect size, its effect classification and CL can all be found
in Table A1.
Each row in the table represents a pair of models (Model 1 and Model 2). Next two
columns are the Z and the p-value results of the sign test. Following are the metrics for the
effect size. Let us for example take the first pair in Table A1. For the pair 10K_most_common
and 10_million_passwords the effect size was calculated to be 0.1092. This result is higher
than 0.1 and is therefore not insignificant, however, it is not especially high, so we mark
the effect as small. CL is calculated by subtracting the model 2 results from model 1. TheAppl. Sci. 2021, 11, 9406 17 of 32
end percentage, therefore, tells us the probability of model 1 producing a higher strength
evaluation than model 2 for a random password. Looking back at the previous example,
the CL is 57.73%. This means 10K_most_common produced higher strength estimations
in 57.73% of the cases, while 10_million_passwords only had the higher value in 42.27% of
the results (excluding the ties). This brings us back to the definition of a more successful
model. Generally, the model consistently producing smaller password strength estimations
would be better. From the example, we can see that model 10_million_passwords more rarely
generates the higher strength value of the two and for that reason, we would consider this
model to be the better one. Because of the way the models are sorted into model 1 and 2
columns, the ones in the second column are always considered better. As a result, to find
the best models we can simply just count the number of times a single model is written in
the second column (higher the count, better the model). Following this rule, we find that
10_million_passwords is the best model, followed by rockyou, phpbb, tuscl, uniqpass, hotmail,
singles_org, 10k_most_common, myspace, faithwriters, passwords, and the worst of the tested
models scribd. We summarise this and order the models in Table 6.
Table 6. Ordering the models
Order Number Dataset Size Freq. of Ceiling Values %*
1 10_million 10,000,000 51,339 0.43
2 rockyou 14,344,390 5,417 0.05
3 phpbb 184,389 115,528 0.97
4 tuscl 38,820 909,631 7.63
5 uniqpasss_preview 1,999,984 1,635,319 13.71
6 hotmail 8930 1,553,497 13.03
7 singles_org 12,233 1,922,760 16.12
8 10k_most_common 10,000 2,934,668 24.61
9 myspace 37,139 1,083,773 9.09
10 faithwriters 8347 3,564,910 29.90
11 passwords 2,151,220 4,715,074 39.54
12 scribe 106,358 8,848,941 74.21
* percents from the testing dataset.
Ordering the models from the best to the worst is not very difficult, however, it should
be noted that the differences between models are not even remotely the same. For this rea-
son, we join models with similar results into groups. As stated before 10_million_passwords
produces the best results, but rockyou does not lag far behind. The effect size shows that
they do in fact produce very similar results. Additionally, as was shown in Figure 4 rockyou
is the most likely to calculate the strength of any passwords. These two models we would
therefore classify as very good. Not so good but still very decent are the models phpbb, tuscl,
uniqpass_preview, hotmail, and singles_org. All of these are very similar to each other, as can
be seen from effect sizes. While their dissimilarity to the two best models is not big enough
to be of small effect, they are quite close. The same cannot be said for 10K_most_common
and myspace, which have a meaningful difference to the two best models. Consequently,
these two models are considered not good, although they are still much better than the
last group. Models faithwriters, passwords, and scribd are significantly different from any
preceding model. This is especially true for the scribd model, which is the only one that has
medium and large differences from other models (including faithwriters and passwords).
Table 7 is a summary of the big Table A1 (see Appendix B) that includes all the results
mentioned and can be found in the appendix. Of the 66 comparisons between the models,
in 35 cases the difference was determined to be too small to be of any importance. The
remaining differences are large enough to not be ignored. Of those, 20 were classified as
small, 9 as medium and 2 as large differences. The table also shows the difference in CL
between classes.Appl. Sci. 2021, 11, 9406 18 of 32
Table 7. Summary of Pairwise Comparison.
Effect # Mean r Value Mean CL
Trivial 35 0.044 53.14%
Small 20 0.154 61.01%
Medium 9 0.426 82.12%
Large 2 0.523 87.01%
6. Discussion
Now that we have all the data, we can look for the possible reasons, why some
password datasets might be better for constructing a good Markov model.
The first dataset property that could cause differences is its size. Intuitively one might
assume, bigger learning set of passwords would produce a better end result. Considering
the two biggest password datasets (rockyou and 10_million_passwords) managed to construct
the two best models this might look very plausible. However, the rockyou model, even
though it was constructed from more than 40% bigger dataset, is still not better than the
10_million_passwords model. Furthermore, the third best model (phpbb), which was only
marginally worse than the two best, was constructed from a dataset more than fifty times
smaller than the 10_million_passwords and was only fifth in the overall size, while the third
largest dataset (passwords) created the second worst model. This leads us to believe that
while the size is important, the quality of the dataset is also important. The increase in
dataset size also seems to have a diminishing return on the final quality of the model. This
would mean that the biggest datasets do not necessarily make a better model, while on the
other hand, smaller datasets have a stronger possibility to build a weaker model. In our
case, this is seen from the fact that none of the models built from the four smallest datasets
is amongst the five best models. The only considerably larger datasets that performed
worse have other major problems.
When looking at the password composition of models some additional reasons for the
success or failure of models can be found. The easiest password property to look at is the
mean length (Table 2). Password length does not appear to have any effect on the model’s
success. Models constructed from datasets with higher average password length can be
found among the best and worst. For example, the 10_million_passwords model, which
was shown to be the best, has the fifth shortest average password length, while rockyou
the second best model was constructed from a dataset with the second highest average
password length.
The composition of the passwords themselves is somewhat more difficult to compare,
but with the help of the frequency distribution of characters in datasets (see Section 5.1)
and the table on password information (Table 2) some distinct differences between datasets
and the resulting models become clear.
A quick overview of character frequencies shows that numerical characters are very
common in the majority of datasets, while upper-case letters are fairly uncommon. This
could be an added reason why datasets with proportionally smaller amount of numerical
characters perform reasonably badly (10K_most_common, faithwriters, scribd and partially
singles_org) and why datasets with no upper-case letters can do reasonably well (i.e.,
uniqpass_preview).
Uniqpass_preview is the third biggest dataset by the number of characters (passwords
dataset has more passwords but they are shorter). It has decent amounts of lower-case
letters, numbers and compared to other datasets it has proportionally more special char-
acters (more than 15% of all passwords contain a special character). Even though it has
zero upper-case letters the constructed model was the fifth best. This means that the model
cannot calculate the strength of any password with any number of upper-case letters. As
a consequence, the model cannot calculate the strength of a fair amount of passwords
(7th place overall). More ceiling values would normally mean a bad result, but a healthy
number of lower-case, numeric and special characters gives this model the ability to rigidlyYou can also read