Taal Volcano 2020 Eruption Impact on Air Quality. Part I: Satellite Retrievals and Ground-based, Vertically-resolved Measurements
←
→
Page content transcription
If your browser does not render page correctly, please read the page content below
Taal Volcano 2020 Eruption Impact on Air Quality. Part I:
Satellite Retrievals and Ground-based, Vertically-resolved
Measurements
By Gabrielle Frances Leung1, Miguel Ricardo Hilario1, Grace Betito1, Paola Angela Bañaga1,
Xzann Gary Vincent Topacio1, Zenn Marie Cainglet1,3, Shane Marie Visaga2,3, Imee Delos
Reyes1, Lyndon Mark Olaguera2,3, Julie Mae Dado2, Faye Cruz2, Joel Maquiling3, Maria
Obiminda Cambaliza1,3, James Bernard Simpas1,3, Gemma Teresa Narisma2,3 , Robert Holz4,
Ralph Kuehn4, Edwin Eloranta4, and Jeffrey Reid5
1
Air Quality Dynamics Laboratory, Manila Observatory, Philippines
2
Regional Climate Systems Laboratory, Manila Observatory, Philippines
3
Department of Physics, Ateneo de Manila University, Philippines
4
Space Sciences Engineering Center, University of Wisconsin-Madison, Madiscon, Wisconsin, USA
5
U.S. Naval Research Laboratory, Monterey, California, USA
Summary (as of 13 January 2020):
1. Emissions from Taal Volcano rapidly spread northward, hitting major population centers
within an hour of the initial eruption.
2. High-altitude winds were largely responsible for transporting volcanic emissions
northward. HSRL measurements from Manila Observatory show that most of the
pollution was transported above 12 km.
3. Comparison of integrated aerosol optical depth over the Manila Observatory before,
during, and after the ashfall shows current conditions are back to typical range.
4. Satellite retrievals show reduced emissions and plume dispersion across Luzon early
morning, 13 January 2020.
At around 3:00 p.m. (0700Z) 12 January 2020, Taal Volcano in Batangas erupted, releasing
large amounts of particles and gases into our atmosphere. In the following hours, the volcano
continued to spew ash as the initial plume was transported northward by prevailing winds, as
shown in Figure 1. Even from space, the transport of the emissions could clearly be seen
moving quickly, reaching Metro Manila between 4:00 and 5:00 p.m. (0800-0900Z) shown in
Figure 2, and spreading past Batanes by 11:00 p.m. (1500Z).
1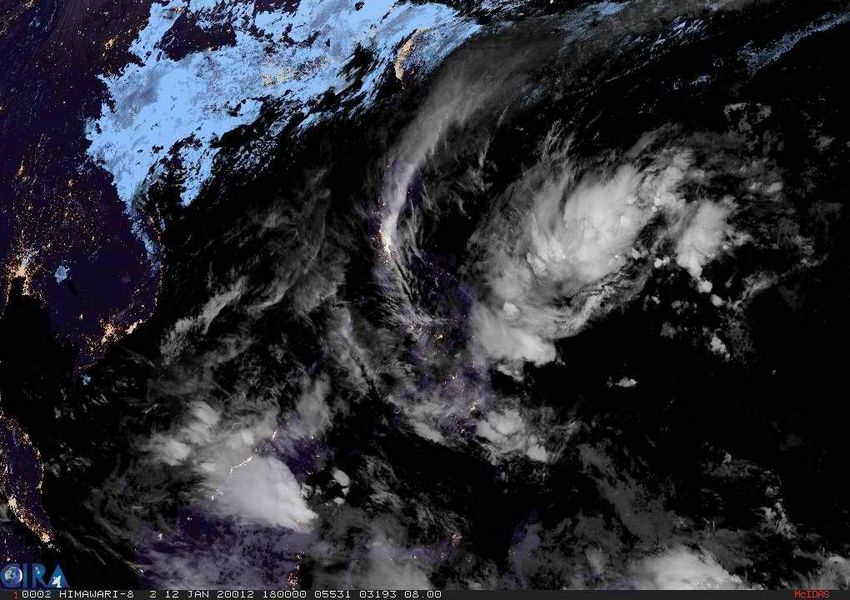
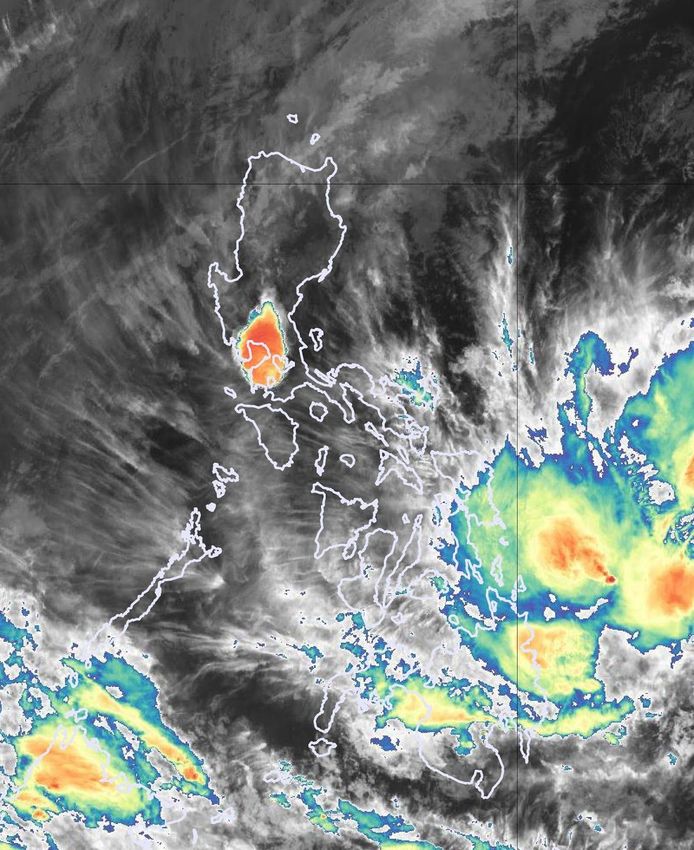
Figure 1. Volcanic emissions from Taal seen from space. 11 μm brightness temperature at 5:00 p.m.
on 12 January 2020 (0900Z 12 January 2020). Brightness temperature is a measure of radiative energy
which indicates the presence of clouds, and is typically used to infer cloud top height [1].
Loop from 1:00 p.m. 12 January 2020 to 1:00 a.m. 13 January 2020, local time (0500Z-1700Z 12 January
2020 in Coordinated Universal Time) can be found here:
http://geoworldview.ssec.wisc.edu/?v=101.23096742483006,4.829026957156378,140.93572476622842,
24.711303788504196&t=2020-01-12-T17%3A00%3A00Z&ics=true&ici=5&icd=20&as=2020-01-12-T05%
3A00%3A00Z&ae=2020-01-12-T17%3A00%3A00Z&ab=on
Source: Space Science and Engineering Center CAMP2Ex Worldview
(http://geoworldview.ssec.wisc.edu/).
It is well-known that volcanic eruptions threaten nearby areas through lava or lahar, but
less-known are the impacts of such eruptions on our air quality. Volcanic ash and dust are
emitted in the eruptions and dispersed throughout our atmosphere. These are types of natural
aerosols, which are solid particulates or liquid droplets suspended in the air. Some aerosols are
fine enough to be inhaled and have negative effects on human health. Hazardous gases such
as sulfur dioxide (SO2) and greenhouse gases (GHG) are also released [2].
The Taal ashfall particles are noticeably quite different than the Pinatubo ashfall in terms of size,
shape, texture. They are larger, more uncrystallized (amorphous), and more rough when
pulverized. The presence and abundance of water in the Taal region has allowed magma to
cool and solidify much faster than in a terrestrial eruption, much like Pinatubo's. Nonetheless,
volcanic ash, of whichever type or source, is a conglomeration of small particles of jagged
glass, rocks, minerals that is hazardous to us when ingested through the respiratory system.
2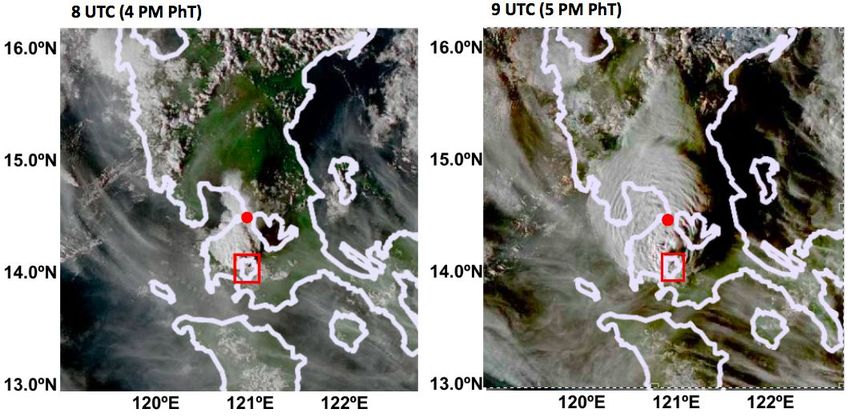
Figure 2. Advanced Himawari Image True Color showing ash plume from Taal Volcano eruption at
Batangas (red box) reaching Manila Observatory (121.08E; 14.64N) located inside the Ateneo de
Manila Campus (red dot) at 4:00 p.m. and further extending north (~15N) at 5:00 pm (Philippine
local time). Source: UW Madison Space Science and Engineering Center CAMP2Ex Worldview
(http://geoworldview.ssec.wisc.edu/)
Most of the pollutants from the Taal eruption on 12 January were transported at high altitudes. A
steam-and-ash plume was detected as high as 16.5 km above ground level by Tokyo Volcanic
Ash Advisory Center [3]. Termed a phreatic eruption, the event was driven by building pressure
from steam, heated by magma [4]. An injection with considerable vertical exit velocity and
particle buoyancy associated with the high temperatures of volcanic emissions transported
associated particles and gases towards higher altitudes [5]. Although low-altitude winds were
stagnant during the time of eruption, the rapid vertical transport of volcanic emissions allowed
for horizontal transport by high-altitude winds northward into high population areas (Figures 1,
3), reaching as far as the North Luzon coast by 8:00 p.m. that night (1200Z).
3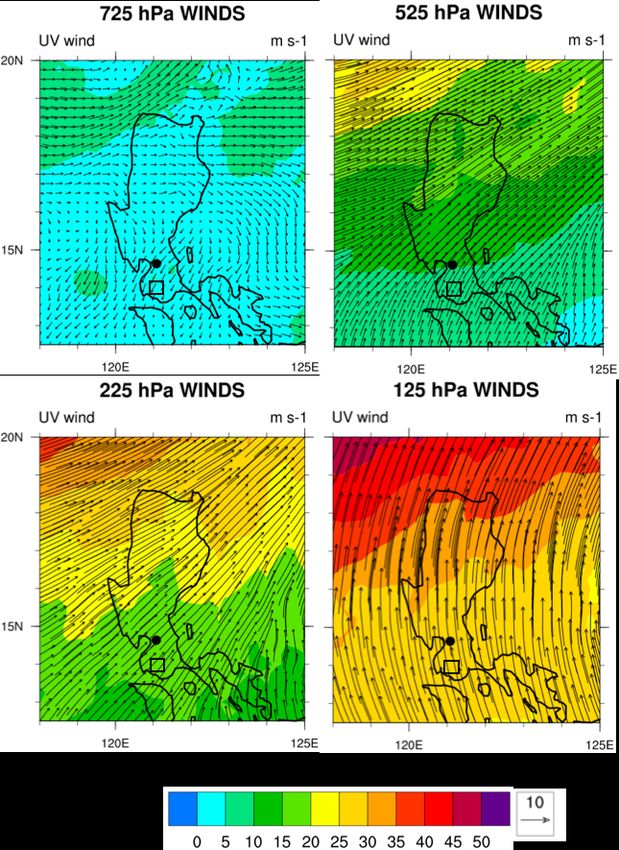
Figure 3. Winds at different levels showing low-altitude northeasterly winds at 725 hPa (2.7 km
altitude) over south Luzon (including Metro Manila), in contrast to stronger high-altitude
southwesterly winds at 525 hPa (5.2 km altitude) and at 225 hPa (11 km altitude), and southerly
winds at 125 hPa (14.8 km altitude) responsible for transporting volcanic emissions northward.
.
Wind speeds and direction at 8:00 p.m. on 12 January 2020 (1200Z). Scale of unit vector is 10 m s-1
Locations of Taal Lake and Manila Observatory are indicated by the box and dot, respectively. Source:
Global Forecast System (GFS) model
4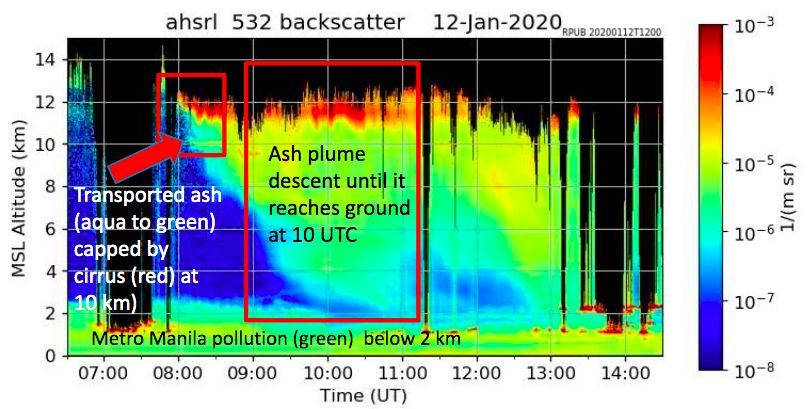
Ashfall has been reported in many locations, including areas in Batangas, Tagaytay, Laguna,
Cavite, Bulacan, and Metro Manila. PHIVOLCS has issued an ashfall advisory for
CALABARZON, Metro Manila, and Central Luzon [6]. The general public is advised to stay
indoors, especially the elderly, children, and people with respiratory problems such as asthma.
The Department of Health (DOH) has warned the public on the dangers of ashfall which include
bronchitis-like illness, coughing, and nose-and-throat irritation [7]. They suggest that N95 grade
face masks should be used when possible, especially by those who are exposed to the ashfall,
and motorists should drive with extreme caution due to low visibility and slippery roads.
Instruments at the Manila Observatory (location relative to Taal shown in Figure 2) support the
reports of ashfall reaching the Metro late last night, and can help to assess current conditions as
well.
The High Spectral Resolution Lidar (HSRL) measures how much light from a laser is reflected
back towards the ground (called the backscatter). This can be used to determine the presence
of clouds and aerosols, with higher backscatter generally meaning a higher concentration of
aerosols (depending on the shape and radius of the aerosols as well). Figure 4 shows low
backscatter in the time period before the eruption (the blue color on the left of the graph, around
2:30 p.m. local time; 0630Z). Rapidly, within an hour after the eruption starting from 4:00 p.m.
(0800Z), larger backscatter values (i.e. higher amounts of aerosols) are observed at high
altitudes around 10- 12 km as the polluted air mass was transported from Taal to Metro Manila.
The top of the ash plume can not be measured by the HSRL which loses signal above 12 km
due to high concentration of the ash. This supports the hypothesis of high-altitude transport as
the main mechanism behind the rapid spread of Taal’s emissions. As the evening went on, the
air mass began to descend until it reached the ground at 6:00 p.m. (1000Z), the same time that
ashfall in Metro Manila was reported. The ash plume is still present after 13:00Z however the
HSRL becomes blocked by water clouds starting near 1300Z (9:00 pm).
5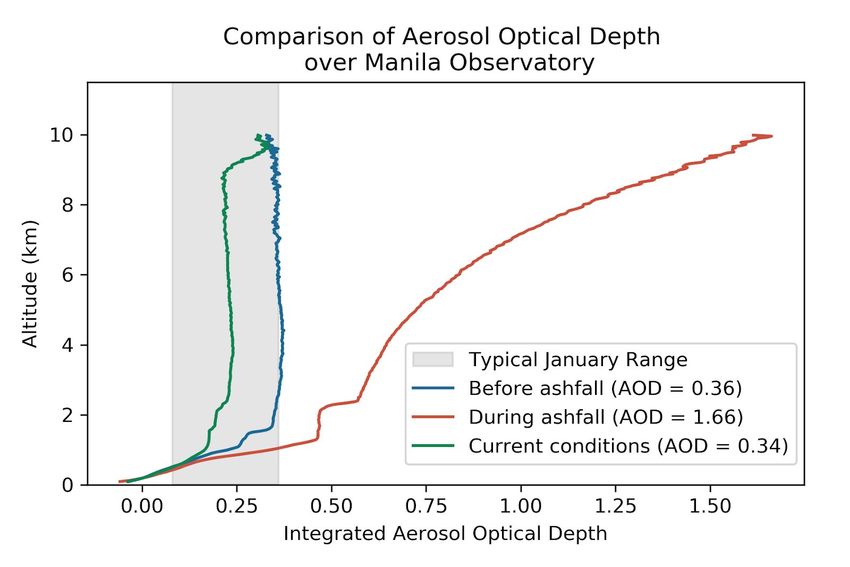
Figure 4. The University of Wisconsin High Spectral Resolution Lidar (HSRL) aerosol backscatter
shows ash transport and ashfall. F igure shows Metro Manila pollution sitting below 2km and the plume
transported to Metro Manila above 10 km (green) capped by cirrus clouds (red) at 4:00 p.m. local time
(0800Z). Ash plume descends to the ground over the course of two hours until 6:00 p.m. (1000Z).
Figure 5. Comparison of integrated aerosol optical depth over the Manila Observatory before,
during, and after the ashfall shows current conditions back to typical range. Four-hour average
integrated aerosol optical depth (AOD) measured using the High Spectral Resolution Lidar (HSRL)
located at the Manila Observatory.
6Aerosol optical depth or AOD is a measure of how much sunlight is prevented from reaching the
ground due to aerosols and a marker of aerosol concentration. A higher AOD means that
conditions are hazier. Figure 5 shows that total AOD from surface to 10km (which can be read
as the AOD value at the top-most altitude) before the ashfall (8:00 a.m. to 12:00 p.m., 12
January 2020; 0000Z-0400Z) was around 0.36, which is somewhat polluted but typical for Metro
Manila. Over a four-hour period during the peak of the ashfall in Quezon City (8:00 p.m. to 12:00
a.m., 12 January 2020; 1200Z-1600Z), AOD reached over four times that value (~1.66),
signifying extremely hazy conditions.
More recent measurements (8:00 a.m. to 12:00 p.m., 13 January 2020; 0000Z-0400Z) show
that AOD values have returned to normal (~0.34) over the Manila Observatory. Based on the
latest satellite images, emissions from the volcano have decreased and prevailing winds are
advecting residual emissions in the northeast direction (Figure 6).
Figure 6. HIMAWARI enhanced visible satellite imagery shows lower emissions and plume
dispersion early morning 6 AM, Philippine local time, January 13 2020. L oop over 24-hour period
immediately following the Taal eruption from 3:00 p.m. 12 January to 3:00 p.m. 13 January 2020 (0700Z
12 January to 0700Z 13 January 2020) can be found here:
http://rammb.cira.colostate.edu/ramsdis/online/loop_timestamp.asp?data_folder=himawari-8%2Fphilippines_true_col
or&width=1020&height=720&ending_image=philippines_true_color_20200113070000.jpg&starting_image=philippine
s_true_color_20200112070000.jpg
Source: RAMSDIS Online (http://rammb.cira.colostate.edu/ramsdis/online/) .
7As Taal Volcano continues to be at Alert Level 4 (hazardous eruption imminent), people in
affected locations are advised to take necessary precautions and stay calm. In the days to
come, the Manila Observatory will continue to monitor atmospheric conditions and air quality
levels in order to better assess the level of danger posed to the general public.
Acknowledgments
We acknowledge the use of AHI data from the Japanese Meteorological Agency (JMA), imagery
from the University of Wisconsin Madison Space Science and Engineering Center (SSEC) as
part of the NASA CAMP2Ex (Cloud, Aerosol and Monsoon Processes Philippines Experiment)
and the Cooperative Institute for Research in the Atmosphere (CIRA), and the NASA Worldview
application team as part of the NASA Earth Observing System Data and Information System
(EOSDIS). We also acknowledge that the University of Wisconsin High Spectral Resolution
Lidar (HSRL) which is deployed at the Manila Observatory to support CAMP2Ex .
References
[1] Cloud Top Height Determination From 10.7 um Imagery, [online] Available from:
http://rammb.cira.colostate.edu/wmovl/vrl/tutorials/advimgry/cldtop.htm (Accessed 13 January 2020).
[2] How Volcanoes Influence Climate | UCAR Center for Science Education, [online] Available from:
https://scied.ucar.edu/shortcontent/how-volcanoes-influence-climate (Accessed 13 January 2020).
[3] Taal volcano (Luzon, Philippines) activity update: Significant eruption, first in 43 years, Alert Level
raised to 4, [online] Available from:
https://www.volcanodiscovery.com/taal/news/95834/Taal-volcano-Luzon-Philippines-activity-update-Signif
icant-eruption-first-in-43-years-Alert-Level-ra.html (Accessed 13 January 2020).
[4] Garcia, M.A. What is a phraetic eruption?, GMA News [online]. Available from:
https://www.gmanetwork.com/news/scitech/science/721987/what-is-a-phreatic-eruption/story/ (Accessed
13 January 2020).
[5] Eckhardt, S., Prata, A. J., Seibert, P., Stebel, K. and Stohl, A.: Estimation of the vertical prole of sulfur
dioxide injection into the atmosphere by a volcanic eruption using satellite column measurements and
inverse transport modeling, Atmos. Chem. Phys., 17, 2008.
[6] DOST-PHIVOLCS: Volcano Bulletin, [online] Available from:
https://www.phivolcs.dost.gov.ph/index.php/volcano-hazard/volcano-bulletins3 (Accessed 13 January
2020).
[7] Viray, P. L.: DOH cautions public on health effects of Taal ashfall, philstar.com [online] Available from:
https://www.philstar.com/headlines/2020/01/12/1984267/doh-cautions-public-health-effects-taal-ashfall
(Accessed 13 January 2020).
8You can also read