The consolidated European synthesis of CH4 and N2O emissions for the European Union and United Kingdom
←
→
Page content transcription
If your browser does not render page correctly, please read the page content below
Earth Syst. Sci. Data, 13, 2307–2362, 2021
https://doi.org/10.5194/essd-13-2307-2021
© Author(s) 2021. This work is distributed under
the Creative Commons Attribution 4.0 License.

        The consolidated European synthesis of CH4 and N2 O
       emissions for the European Union and United Kingdom:
                             1990–2017
        Ana Maria Roxana Petrescu1 , Chunjing Qiu2 , Philippe Ciais2 , Rona L. Thompson3 , Philippe Peylin2 ,
             Matthew J. McGrath2 , Efisio Solazzo4 , Greet Janssens-Maenhout4 , Francesco N. Tubiello5 ,
        Peter Bergamaschi4 , Dominik Brunner6 , Glen P. Peters7 , Lena Höglund-Isaksson8 , Pierre Regnier9 ,
        Ronny Lauerwald9,23 , David Bastviken10 , Aki Tsuruta11 , Wilfried Winiwarter8,12 , Prabir K. Patra13 ,
         Matthias Kuhnert14 , Gabriel D. Oreggioni4 , Monica Crippa4 , Marielle Saunois2 , Lucia Perugini15 ,
         Tiina Markkanen11 , Tuula Aalto11 , Christine D. Groot Zwaaftink3 , Hanqin Tian16 , Yuanzhi Yao16 ,
                Chris Wilson17,18 , Giulia Conchedda5 , Dirk Günther19 , Adrian Leip4 , Pete Smith14 ,
               Jean-Matthieu Haussaire6 , Antti Leppänen20 , Alistair J. Manning21 , Joe McNorton22 ,
                              Patrick Brockmann2 , and Albertus Johannes Dolman1
           1 Department        of Earth Sciences, Vrije Universiteit Amsterdam, 1081HV, Amsterdam, the Netherlands
                2 Laboratoire         des Sciences du Climat et de l’Environnement, 91190 Gif-sur-Yvette, France
                                      3 Norwegian Institute for Air Research (NILU), Kjeller, Norway
                                 4 European Commission, Joint Research Centre, 21027 Ispra (Va), Italy
               5 Food and Agriculture Organization of the United Nations, Statistics Division, 00153 Rome, Italy
           6 Empa, Swiss Federal Laboratories for Materials Science and Technology, 8600 Dübendorf, Switzerland
                                   7 CICERO Center for International Climate Research, Oslo, Norway
                      8 International Institute for Applied Systems Analysis (IIASA), 2361 Laxenburg, Austria
       9 Biogeochemistry and Modeling of the Earth System, Université Libre de Bruxelles, 1050 Bruxelles, Belgium
                    10 Department of Thematic Studies – Environmental Change, Linköping University, Sweden
                               11 Finnish Meteorological Institute, P.O. Box 503, 00101 Helsinki, Finland
              12 Institute of Environmental Engineering, University of Zielona Góra, Zielona Góra, 65-417, Poland
                            13 Research Institute for Global Change, JAMSTEC, Yokohama 2360001, Japan
                    14 Institute of Biological and Environmental Sciences, University of Aberdeen (UNIABDN),

                                              23 St Machar Drive, Aberdeen, AB24 3UU, UK
                           15 Centro Euro-Mediterraneo sui Cambiamenti Climatici (CMCC), Viterbo, Italy
                16 International Centre for Climate and Global Change, School of Forestry and Wildlife Sciences,

                                                Auburn University, Auburn, AL 36849, USA
                          17 Institute for Climate and Atmospheric Science, University of Leeds, Leeds, UK
                                18 National Centre for Earth Observation, University of Leeds, Leeds, UK
                                           19 Umweltbundesamt (UBA), 14193 Berlin, Germany
         20 University of Helsinki, Institute for Atmospheric and Earth System Research/Physics, Faculty of Science,

                                                          00560 Helsinki, Finland
                                            21 Hadley Centre, Met Office, Exeter, EX1 3PB, UK
                  22 European Centre for Medium-Range Weather Forecasts (ECMWF), Reading, RG2 9AX, UK
                  23 Université Paris-Saclay, INRAE, AgroParisTech, UMR ECOSYS, Thiverval-Grignon, France

                                 Correspondence: Ana Maria Roxana Petrescu (a.m.r.petrescu@vu.nl)
                               Received: 7 December 2020 – Discussion started: 17 December 2020
                          Revised: 12 March 2021 – Accepted: 12 March 2021 – Published: 28 May 2021
      Abstract. Reliable quantification of the sources and sinks of greenhouse gases, together with trends and uncer-
      tainties, is essential to monitoring the progress in mitigating anthropogenic emissions under the Paris Agreement.

Published by Copernicus Publications.
2308           A. M. R. Petrescu et al.: European synthesis of CH4 and N2 O emissions for the EU27 and UK: 1990–2017

       This study provides a consolidated synthesis of CH4 and N2 O emissions with consistently derived state-of-the-art
       bottom-up (BU) and top-down (TD) data sources for the European Union and UK (EU27 + UK). We integrate
       recent emission inventory data, ecosystem process-based model results and inverse modeling estimates over
       the period 1990–2017. BU and TD products are compared with European national greenhouse gas inventories
       (NGHGIs) reported to the UN climate convention UNFCCC secretariat in 2019. For uncertainties, we used for
       NGHGIs the standard deviation obtained by varying parameters of inventory calculations, reported by the mem-
       ber states (MSs) following the recommendations of the IPCC Guidelines. For atmospheric inversion models (TD)
       or other inventory datasets (BU), we defined uncertainties from the spread between different model estimates or
       model-specific uncertainties when reported. In comparing NGHGIs with other approaches, a key source of bias
       is the activities included, e.g., anthropogenic versus anthropogenic plus natural fluxes. In inversions, the separa-
       tion between anthropogenic and natural emissions is sensitive to the geospatial prior distribution of emissions.
       Over the 2011–2015 period, which is the common denominator of data availability between all sources, the an-
       thropogenic BU approaches are directly comparable, reporting mean emissions of 20.8 Tg CH4 yr−1 (EDGAR
       v5.0) and 19.0 Tg CH4 yr−1 (GAINS), consistent with the NGHGI estimates of 18.9 ± 1.7 Tg CH4 yr−1 . The es-
       timates of TD total inversions give higher emission estimates, as they also include natural emissions. Over the
       same period regional TD inversions with higher-resolution atmospheric transport models give a mean emis-
       sion of 28.8 Tg CH4 yr−1 . Coarser-resolution global TD inversions are consistent with regional TD inversions,
       for global inversions with GOSAT satellite data (23.3 Tg CH4 yr−1 ) and surface network (24.4 Tg CH4 yr−1 ).
       The magnitude of natural peatland emissions from the JSBACH–HIMMELI model, natural rivers and lakes
       emissions, and geological sources together account for the gap between NGHGIs and inversions and account
       for 5.2 Tg CH4 yr−1 . For N2 O emissions, over the 2011–2015 period, both BU approaches (EDGAR v5.0 and
       GAINS) give a mean value of anthropogenic emissions of 0.8 and 0.9 Tg N2 O yr−1 , respectively, agreeing with
       the NGHGI data (0.9 ± 0.6 Tg N2 O yr−1 ). Over the same period, the average of the three total TD global and
       regional inversions was 1.3 ± 0.4 and 1.3 ± 0.1 Tg N2 O yr−1 , respectively. The TD and BU comparison method
       defined in this study can be operationalized for future yearly updates for the calculation of CH4 and N2 O budgets
       both at the EU+UK scale and at the national scale. The referenced datasets related to figures are visualized at
       https://doi.org/10.5281/zenodo.4590875 (Petrescu et al., 2020b).

1   Introduction                                                        National greenhouse gas inventories (NGHGIs) are pre-
                                                                     pared and reported on an annual basis by Annex I countries2
The global atmospheric concentration of methane (CH4 )               based on IPCC Guidelines using national activity data and
has increased by 160 % and that of nitrous oxide (N2 O)              different levels of sophistication (tiers) for well-defined sec-
by 22 % since the pre-industrial period (WMO, 2019), and             tors. These inventories contain annual time series of each
they are well documented as observed by long-term ice-               country’s greenhouse gas (GHG) emissions from the 1990
core records (Etheridge et al., 1998; CSIRO). According              base year3 until 2 years before the year of reporting and
to the NOAA atmospheric data (https://www.esrl.noaa.gov/             were originally set to track progress towards their reduc-
gmd/ccgg/trends_ch4/, last access: June 2020) the CH4 con-           tion targets under the Kyoto Protocol (UNFCCC, 1997).
centration in the atmosphere continues to increase and, after a      Non-Annex I countries provide some information in bien-
small dip in 2017, has an average growth of 10 ppb yr−1 , rep-       nial update reports (BURs) as well as national communica-
resenting the highest rate observed since the 1980s1 (Nisbet
et al., 2016, 2019). This increase was attributed to anthro-            2 Annex I Parties include the industrialized countries that were
pogenic emissions from agriculture (livestock enteric fer-           members of the OECD (Organization for Economic Co-operation
mentation and rice cultivation) and fossil-fuel-related activi-      and Development) in 1992 plus countries with economies in transi-
ties, combined with a contribution from natural tropical wet-        tion (the EIT Parties), including the Russian Federation, the Baltic
lands (Saunois et al., 2020; Thompson et al., 2018; Nisbet           states, and several central and eastern European states (UNFCCC,
et al., 2019). The recent increase in atmospheric N2 O is more       https://unfccc.int/parties-observers, last access: February 2020).
                                                                         3 For most Annex I Parties, the historical base year is 1990.
linked to agriculture in particular due to the application of
nitrogen fertilizers and livestock manure on agricultural land       However, parties included in Annex I with an economy in transi-
(FAO, 2020, 2015; IPCC, 2019b; Tian et al., 2020).                   tion during the early 1990s (EIT Parties) were allowed to choose
                                                                     1 year up to a few years before 1990 as reference because of a
                                                                     non-representative collapse during the breakup of the Soviet Union
   1 The rapid development of the gas industry in the 1980s in the   (e.g., Bulgaria, 1988; Hungary, 1985–1987; Poland, 1988; Roma-
former USSR.                                                         nia, 1989; and Slovenia, 1986).

Earth Syst. Sci. Data, 13, 2307–2362, 2021                                            https://doi.org/10.5194/essd-13-2307-2021
A. M. R. Petrescu et al.: European synthesis of CH4 and N2 O emissions for the EU27 and UK: 1990–2017                             2309

tions (NCs), but neither BURs nor NCs report annual time           So far, only a few countries (e.g., Switzerland, the UK, New
series or use harmonized formats. The IPCC tiers represent         Zealand and Australia) have used atmospheric observations
the level of sophistication used to estimate emissions, with       (TD) to complement their national inventory data (Bergam-
Tier 1 based on global or regional default values, Tier 2 based    aschi et al., 2018a).
on country-specific parameters, and Tier 3 based on more              A key priority in the current policy process is to facili-
detailed process-level modeling. Uncertainties in NGHGIs           tate the global stocktake exercise of the Paris Agreement, the
are calculated based on ranges in observed (or estimated)          first one coming in 2023, and to assess collective progress to-
emission factors and variability of activity data, using the er-   wards achieving the near- and long-term objectives, consider-
ror propagation method (95 % confidence interval) or Monte         ing mitigation, adaptation and means of implementation. The
Carlo methods, based on clear guidelines (IPCC, 2006).             global stocktake is expected to create political momentum
   NGHGIs follow principles of transparency, accuracy, con-        for enhancing commitments in nationally determined contri-
sistency, completeness and comparability (TACCC) under             butions (NDCs) under the Paris Agreement. Key components
the guidance of the UNFCCC (UNFCCC, 2014). Method-                 of the global stocktake are the NGHGIs submitted by coun-
ological procedures are taken from the 2006 IPCC Guide-            tries under the enhanced transparency framework of the Paris
lines (IPCC, 2006). The IPCC 2019 Refinement (IPCC,                Agreement. Under the framework, for the first time, develop-
2019a), which may be used to complement the 2006 IPCC              ing countries will be required to submit their inventories and
Guidelines, has updated sectors with additional sources and        also commit to provide regular reports to UNFCCC, along-
provides guidance on the possible and voluntary use of at-         side developed countries, which will continue to submit also
mospheric data for independent verification of GHG inven-          on an annual basis. Some developing countries will face chal-
tories. Complementary to NGHGIs, research groups and in-           lenges to provide and then update inventories.
ternational institutions produce estimates of national GHG            The work presented here represents dozens of distinct
emissions, with two families of approaches: atmospheric            datasets and models, in addition to the individual coun-
inversions (top-down, TD) and GHG inventories based on             try submissions to the UNFCCC for all European countries
the same principle as NGHGIs but using different methods           (NGHGIs), which while following the general guidance laid
and input data (bottom-up, BU). These complementary ap-            out in IPCC (2006) still differ in specific approaches, models
proaches are necessary. First, TD approaches act as an inde-       and parameters, in addition to differences underlying activ-
pendent check on BU approaches and facilitate a deeper un-         ity datasets. A comprehensive investigation of detailed differ-
derstanding of the scientific processes driving different GHG      ences between all datasets is beyond the scope of this paper,
budgets. Second, NGHGIs only cover a subset of countries,          though attempts have been previously made for specific sub-
and it is therefore necessary to construct BU estimates in-        sectors (e.g., agriculture, Petrescu et al., 2020) and in ded-
dependently for all countries. The BU estimates are often          icated gas-specific follow-ups to this paper. As this is the
used as input data for TD estimates and to track emissions         most comprehensive comparison of NGHGIs and research
over time, either globally or on the country level, such as in     datasets (including both TD and BU approaches) for the Eu-
the UNEP Emissions Gap Report (UNEP, 2019). There is no            ropean continent to date, we focus here on the following rich
guideline to estimate uncertainties in TD or BU approaches.        set of questions that such a comparison raises without neces-
The uncertainties are usually assessed from the spread of          sarily offering detailed solutions. How can we compare the
different estimates within the same approach, though some          detailed sectoral NGHGI to the observation-based estimates?
groups or institutions report uncertainties for their estimates    Which new information are the observation-based estimates
using a variety of methods – for instance, by varying parame-      likely to bring (mean fluxes, trend, ensemble variability)?
ters or input data. However, this gets complicated when deal-      What can we expect from such a complex study and how
ing with complex process-based models.                             do we proceed going forward?
   NGHGI official numbers are not always straightforward              We compare official anthropogenic NGHGI emissions
to compare with other independent estimates. Independent           with research datasets and wherever needed harmonize re-
estimates often have different system boundaries and a dif-        search data on total emissions to ensure consistent com-
ferent focus. BU estimates often have a lot of overlap in          parisons of anthropogenic emissions. We analyze differ-
terms of methods and other input data, and through harmo-          ences and inconsistencies between emissions and make rec-
nization the differences between BU estimates and NGHGIs           ommendations towards future actions to evaluate NGHGI
can be bridged. On the other hand, TD estimates are much           data. While NGHGIs include uncertainty estimates, individ-
more independent and provide the best independent check on         ual spatially disaggregated research datasets of emissions of-
NGHGIs. While NGHGIs go through a review process, the              ten lack quantification of uncertainty. Here, we use the me-
UNFCCC procedures do not incorporate mandatory indepen-            dian4 and minimum/maximum (min/max) range of different
dent, large-scale observation-derived verification but allow
the use of atmospheric data for external checks within the            4 The reason for using the median instead of mean for the ensem-
data quality control, quality assurance and verification pro-      bles is because there is a large spread between global inversions, and
cess (2006 IPCC Guidelines, chap. 6: QA/QC procedures).            we do not want to be biased by outliers/extremes.

https://doi.org/10.5194/essd-13-2307-2021                                           Earth Syst. Sci. Data, 13, 2307–2362, 2021
2310               A. M. R. Petrescu et al.: European synthesis of CH4 and N2 O emissions for the EU27 and UK: 1990–2017

Table 1. Sectors used in this study and data sources providing estimates for these sectors.

    Anthropogenic (BU)a CH4 and               Naturalb (BU) CH4                           Naturalc (BU) N2 O                           TD (CH4 and N2 O)
    N2 O
                                                                                                                                       No sectoral split – total emis-
     1. Energy (NGHGIs,                                                                                                                sions:
        GAINS, EDGAR v5.0)                                                                                                             FLEXPART
                                                                                                                                       (FLExKF-TM5-
                                                                                                                                       4DVAR)_EMPA;
     2. Industrial processes and                                                                                                       TM5-4DVAR;
        products in use (IPPU)                                                                                                         FLEXINVERT_NILU;
        (NGHGIs, GAINS,                                                                                                                CTE-CH4 ;
        EDGAR v5.0)                                                                                                                    InTEM-NAME;
                                                                                                                                       InGOS inversions;
                                                                                                                                       GCP-CH4 2019 anthropogenic
                                                                                                                                       partition from inversions;
     3. Agricultured (NGHGIs,
                                                                                                                                       GCP-CH4 2019 natural parti-
        CAPRI, GAINS,
                                                                                                                                       tion from inversions;
        EDGAR v5.0, FAOSTAT,
                                                                                                                                       GN2 OB 2019.
        ECOSSE, DayCent)

     4. LULUCF total emissions
        (NGHGIs Figs. 1, 2, 4,
        5, and B2a for CH4 and
        Figs. 6, 7 , 9, and B2b for
        N2 O)

     5. Waste (NGHGIs, GAINS,
        EDGAR v5.0)

                                              Peatlands, inland waters (lakes             Inland water (lakes, rivers and
                                              and reservoirs) and geological              reservoirs) fluxes (non-wetland
                                              fluxes (JSBACH–HIMMELI,                     inland waters_ULB)
                                              non-wetland waters_ULB;
                                              Hmiel et al., 2020;
                                              Etiope et al., 2019)
a For consistency with the NGHGIs, here we refer to the five reporting sectors as defined by the UNFCCC and the Paris Agreement decision (18/CMP.1), the IPCC Guidelines
(IPCC, 2006) and their 2019 Refinement (IPCC, 2019a), with the only exception that the latest IPCC refinement groups together the agriculture and LULUCF sectors in one sector
(agriculture, forestry and other land use – AFOLU). b The term “natural” here refers to unmanaged natural CH4 emissions (wetlands, geological, inland waters) not reported under
the UNFCCC LULUCF sector. c Anthropogenic (managed) agricultural soils can also have a level of natural emissions. d Natural soils (unmanaged) can have both natural and
anthropogenic emissions.

research products of the same type to get a first estimate of                              They are compared with NGHGI official submissions up to
uncertainty.                                                                               2017 and supplemented by the UNFCCC-NRT inventory to
                                                                                           capture 2018 estimates (near real time, EEA 2019). Refer-
2     CH4 and N2 O data sources and estimation                                             ences are given in Table 2 and the detailed description of all
      approaches                                                                           products in Appendices A1–A3.
                                                                                              For both CH4 and N2 O BU approaches, we used in-
We analyze CH4 and N2 O emissions in the EU27 + UK from                                    ventories of anthropogenic emissions covering all sectors
inversions (TD) and anthropogenic emissions from various                                   (EDGAR v5.0 and GAINS) and inventories limited to agri-
BU approaches that cover specific sectors. These data (Ta-                                 culture (CAPRI and FAOSTAT). For CH4 we used one bio-
ble 2) span the period from 1990 and 2017, with the same                                   geochemical model of natural peatland emissions (JSBACH–
data available for shorter time periods. The data are from                                 HIMMELI), as well as literature data for geological emis-
peer-reviewed literature and from unpublished research re-                                 sions on land (excluding marine seepage) (Etiope et al.,
sults from the VERIFY project (Table 1 and Appendix A).                                    2019; Hmiel et al., 2020) and for lakes and reservoirs (Del

Earth Syst. Sci. Data, 13, 2307–2362, 2021                                                                       https://doi.org/10.5194/essd-13-2307-2021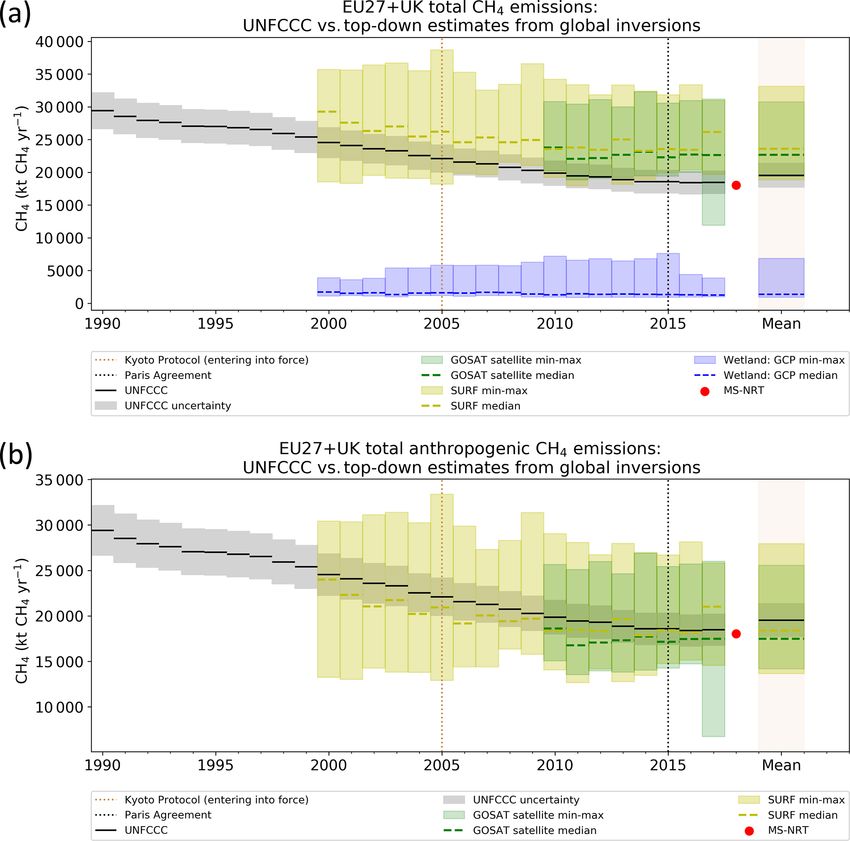
A. M. R. Petrescu et al.: European synthesis of CH4 and N2 O emissions for the EU27 and UK: 1990–2017                                                2311

Table 2. Data sources for CH4 and N2 O emissions used in this study.

  Method      Name                 CH4                        N2 O                        Contact/lab     References
  CH4 and N2 O bottom-up anthropogenic
  UNFCCC      UNFCCC CRFs          CH4 emissions              N2 O emissions              MS              UNFCCC CRFs
  NGHGI                            1990–2017                  1990–2017                   inventory       https://unfccc.int/process-and-meetings/
  (2019)                                                                                  agencies        transparency-and-reporting/
                                                                                                          reporting-and-review-under-the-convention/
                                                                                                          greenhouse-gas-inventories-annex-i-parties/
                                                                                                          national-inventory-submissions-2019
                                                                                                          (last access: January 2021)
  UNFCCC      UNFCCC               t − 1 proxy estimate for   t − 1 proxy estimate for    EEA             EEA report, Approximated EU GHG
              MS-NRT               2018                       2018                                        inventory: proxy GHG estimates for 2018
                                                                                                          (https://www.eea.europa.eu/publications/
                                                                                                          approximated-eu-ghg-inventory-proxy,
                                                                                                          last access: November 2020).
  BU          EDGAR v5.0           CH4 sectoral emissions     N2 O sectoral emissions     EC-JRC          Crippa et al. (2019)
                                   1990–2015                  1990–2015                                   Crippa et al. (2020)
                                                                                                          Janssens-Maenhout et al. (2019)
                                                                                                          Solazzo et al. (2020)
  BU          CAPRI                CH4 agricultural emis-     N2 O agricultural emis-     EC-JRC          Britz and Witzke (2014)
                                   sions 1990–2013            sions 1990–2013                             Weiss and Leip (2012)
  BU          GAINS                CH4 sectoral emissions     N2 O sectoral emissions     IIASA           Höglund-Isaksson (2012)
                                   1990–2015                  1990–2015                                   Höglund-Isaksson (2017)
                                                              (every 5 years)                             Höglund-Isaksson et al. (2020)
                                                                                                          Gomez-Sanabria et al. (2018)
                                                                                                          Winiwarter et al. (2018)
  BU          FAOSTAT              CH4 agriculture and        N2 O agricultural emis-     FAO             Tubiello et al. (2013)
                                   land use emissions         sions 1990–2017                             FAO (2015, 2020)
                                   1990–2017                                                              Tubiello (2019)
  BU          ECOSSE                                          Direct N2 O emissions       UNIABDN         Bradbury et al. (1993)
                                                              from agricultural soils                     Coleman and Jenkinson (1996)
                                                              2000–2015                                   Jenkinson and Rayner (1977)
                                                                                                          Jenkinson et al. (1987)
                                                                                                          Smith et al. (1996, 2010a, b)
  BU          DayCent                                         N2 O emissions from         EC-JRC          Orgiazzi et al. (2018)
                                                              direct agricultural soils                   Lugato et al. (2018, 2017)
                                                              average 2011–2015                           Quemada et al. (2020)
  CH4 and N2 O bottom-up natural
  BU          JSBACH–              CH4 emissions from                                     FMI             Raivonen et al. (2017)
              HIMMELI              peatlands                                                              Susiluoto et al. (2018)
                                   2005–2017
  BU          Non-wetland in-      One average value for      N2 O average value for      ULB             Maavara et al. (2017, 2019)
              land waters          CH4 fluxes from lakes      emissions from lakes,                       Lauerwald et al. (2019)
                                   and reservoirs with        rivers, reservoirs                          Deemer et al. (2016)
                                   uncertainty                Average of 2010–2014                        Del Sontro et al. (2018)
                                   2005–2011                                                              Mccauley et al. (1989)
  BU          Geological emis-     Total pre-industrial-era                               Hmiel et al.    Hmiel et al. (2020)
              sions, including     geological CH4                                         (2020)          https://www.nature.com/articles/
              marine and           emissions                                              Etiope et al.   s41586-020-1991-8
              land geological                                                             (2019)          (last access: September 2020)
                                                                                                          Etiope et al. (2019)

https://doi.org/10.5194/essd-13-2307-2021                                                         Earth Syst. Sci. Data, 13, 2307–2362, 2021
2312            A. M. R. Petrescu et al.: European synthesis of CH4 and N2 O emissions for the EU27 and UK: 1990–2017

Table 2. Continued.

 Method       Name                CH4                           N2 O                    Contact/lab    References
 CH4 and N2 O top-down inversions
 Regional inversions over Europe (high transport model resolution)
 TD           FLEXPART            Total CH4 emissions                                   EMPA           Brunner et al. (2012)
              (FLExKF-TM5-        from inversions with                                                 Brunner et al. (2017)
              4DVAR)_EMPA         uncertainty                                                          Background concentrations from
                                  2005–2017                                                            TM5-4DVAR, Bergamaschi et al. (2018a)
 TD           TM5-4DVAR           CH4 emissions from in-                                EC-JRC         Bergamaschi et al. (2018a)
                                  versions, split into total,
                                  anthropogenic and nat-
                                  ural 2005–2017
 TD           FLEXINVERT_         CH4 total emissions           N2 O total emissions    NILU           Thompson and Stohl (2014)
              NILU                from inversions               2005–2017
                                  2005–2017
 TD           CTE-CH4             Total CH4 emissions                                   FMI            Brühl and Crutzen (1993)
                                  from inversions for Eu-                                              Howeling et al. (2014)
                                  rope with uncertainty                                                Giglio et al. (2013)
                                  2005–2017                                                            Ito and Inatomi (2012)
                                                                                                       Janssens-Maenhout et al. (2013)
                                                                                                       Krol et al. (2005)
                                                                                                       Peters et al. (2005)
                                                                                                       Saunois et al. (2020)
                                                                                                       Stocker et al. (2014)
                                                                                                       Tsuruta et al. (2017)
 TD           InTEM-NAME          CH4 emissions only                                    Met Office     Jones et al. (2007)
                                  plotted for the UK                                    UK             Cullen (1993)
                                                                                                       Arnold et al. (2018)
 TD           InGOS               Total CH4 emissions                                   EC-JRC         Bergamaschi et al. (2018a)
              inversions          from inversions                                       and InGOS      TM5-4DVAR: Meirink et al. (2008), Bergam-
                                  2006–2012                                             project        aschi et al. (2010, 2015)
                                                                                        partners       TM5-CTE: Tsuruta et al. (2017)
                                                                                                       LMDZ-4DVAR: Hourdin and Armengaud
                                                                                                       (1999), Hourdin et al. (2006)
                                                                                                       TM3-STILT: Trusilova et al. (2010), Gerbig
                                                                                                       et al. (2003), Lin et al. (2003), Heimann and
                                                                                                       Koerner (2003)
                                                                                                       NAME: Manning et al. (2011), Bergamaschi
                                                                                                       et al. (2015)
                                                                                                       CHIMERE: Berchet et al. (2015a, b), Menut
                                                                                                       et al. (2013), Bousquet et al. (2011)
                                                                                                       COMET: Eisma et al. (1995), Vermeulen et al.
                                                                                                       (1999), Vermeulen et al. (2006)
 Global inversions from the Global Carbon Project CH4 and N2 O budgets (Saunois et al., 2020; Tian et al., 2020)
 TD           GCP-CH4 2019        22 models for CH4                                     LSCE and       Saunois et al. (2020) and model-specific refer-
              anthropogenic       inversions, both SURF                                 GCP-CH4        ences in Appendix B, Table B4
              partition from      and GOSAT                                             contribu-
              inversions          2000–2017                                             tors
 TD           GCP-CH4 2019        22 models with                                        LSCE           Saunois et al. (2020) and model-specific refer-
              natural partition   optimized wetland                                                    ences in Appendix B, Table B3
              from inversions     CH4 emissions
                                  2000–2017
 TD                                                             Inverse N2 O emis-      GN2 OB         Thompson et al. (2019)
                                                                sions:                  2019 and       Tian et al. (2020)
                                                                PYVAR (CAMS-N2 O)       contributors
                                                                TOMCAT
                                                                MIROC4-ACTM
                                                                1998–2016

Earth Syst. Sci. Data, 13, 2307–2362, 2021                                                       https://doi.org/10.5194/essd-13-2307-2021
A. M. R. Petrescu et al.: European synthesis of CH4 and N2 O emissions for the EU27 and UK: 1990–2017                           2313

Sontro et al., 2018). Emissions from gas hydrates and ter-         2.1 CH4 and N2 O anthropogenic emissions from
mites are not included as they are close to zero in the                NGHGIs
EU27 + UK (Saunois et al., 2020). Biomass burning emis-
sions of CH4 from the land use, land use change and forestry       UNFCCC NGHGI (2019) emissions are country estimates
(LULUCF) sector account for 3 % of the total emissions in          covering the period 1990–2017. They were kept separate to
the EU27 + UK. These estimates are described in Sect. 2.2.         be compared with other BU and TD data. We supplemented
From TD approaches, we used both regional and global in-           the NGHGI estimates with the member state (MS) near-real-
versions, with the latter having a coarser spatial resolution.     time inventory (MS-NRT; EEA, 2019) to capture one addi-
These estimates are described in Sect. 2.3.                        tional year with preliminary estimates5 . MS-NRT represents
   For N2 O emissions, we used the same global BU inven-           the approximated GHG inventory (also referred to as “proxy
tories as for CH4 and natural emissions from inland waters         estimates”) with an early estimate of the GHG emissions for
(rivers, lakes and reservoirs) (Maavara et al., 2019; Lauer-       the preceding year, as required by Regulation (EU) 525/2013
wald et al., 2019). In this study, about 66 % of the N2 O emit-    of the European Parliament and of the Council.
ted by Europe’s natural rivers is considered anthropogenic            Anthropogenic CH4 emissions from the four UNFCCC
indirect emissions, caused by leaching and runoff of N fertil-     sectors (Table 1, excluding LULUCF) were grouped to-
izers from the agriculture sector. We did not account for nat-     gether. As anthropogenic NGHGI CH4 emissions from the
ural N2 O emissions from unmanaged soils (Tian et al., 2019,       LULUCF sector are very small for the EU27 + UK (2.6 %
estimated pre-industrial soil emissions in Europe at a third of    in 2017 including biomass burning), we exclude them in
the level of the most recent decade – emissions that in pre-       Fig. 4 but include them in the total UNFCCC estimates
industrial times may have been influenced by human man-            from Figs. 1–3, 5 and 6. Only a few countries6 under the
agement activities or based on natural processes that have         NGHGIs volunteered to report wetland emissions, follow-
been abolished since). For N2 O inversions, we used one re-        ing the recommendations of the 2014 IPCC wetlands supple-
gional inversion (FLEXINVERT_NILU) and three global in-            ment (IPCC, 2014), and these emissions were not included
versions (Friedlingstein et al., 2019; Tian et al., 2020). Agri-   in the NGHGI total, following the IPCC (2006) Guidelines
cultural sector emissions of N2 O were presented in detail by      as the reference for NGHGIs and in the absence of a de-
Petrescu et al. (2020). In this current study these emissions      tailed description of what they cover. According to NGHGI
come from the CAPRI model and FAOSTAT, with the lat-               data between 2008 and 2017, the wetland emissions in the
ter additionally covering non-CO2 emissions from biomass           EU27 + UK reported under LULUCF (CRF Table 4(II) ac-
fires in LULUCF. Fossil-fuel-related and industrial emissions      cessible for each EU27 + UK country7 ) include only man-
were obtained from GAINS (see Appendix A1). Table A2 in            aged wetlands which represent one-fourth of the total wet-
Appendix A presents the methodological differences of the          land area in the EU27 + UK (Giacomo Grassi, personal com-
current study with respect to Petrescu et al. (2020).              munication, 2019) and sum up to 0.1 Tg of CH4 (Petrescu
   The units used in this paper are metric tonnes (t)              et al., 2020a).
(1 kt = 109 g; 1 Mt = 1012 g) of CH4 and N2 O.                        Anthropogenic N2 O emissions are predominantly related
The referenced data used for the figures’ repli-                   to agriculture (for the EU27 + UK, 69 % in 2017) but are also
cability purposes are available for download at                    found in the other sectors (Tian et al., 2020). In addition, N2 O
https://doi.org/10.5281/zenodo.4590875 (Petrescu et al.,           has natural emissions, which are defined as the pre-industrial
2020). Upon request, we can provide the codes necessary            background, that is, before the use of synthetic N fertilizers
to plot precisely the style and/or layout of the figures.          and intensive agriculture, and derive from natural processes
We focus herein on the EU27 + UK. In the VERIFY                    in soils but also in lakes, rivers and reservoirs (Maavara et al.,
project, we have constructed in addition a web tool which          2019; Lauerwald et al., 2019; Tian et al., 2020).
allows for the selection and display of all plots shown
in this paper (as well as the companion paper on CO2 ,
Petrescu et al., 2021) not only for the regions but for
                                                                      5 t − 1 refers to an early estimate of the GHG emissions for the
a total of 79 countries and groups of countries in Eu-
rope. The data, located on the VERIFY project website              preceding year, as required by Regulation (EU) 525/2013 of the Eu-
(http://webportals.ipsl.jussieu.fr/VERIFY/FactSheets/, last        ropean Parliament and of the Council.
                                                                      6 Denmark, Finland, Germany, Ireland, Latvia, Sweden, France,
access: February 2021) are free but accessible with a
                                                                   Estonia and Spain – in total these nine countries report in
username and password distributed by the project. Figure 1
                                                                   2017 11.2 kt of CH4 from managed wetlands (UNFCCC 2019,
includes also data from countries outside the EU but located       CRF Table4(II)D: https://unfccc.int/documents/194946, last access:
within geographical Europe (Switzerland, Norway, Belarus,          September 2020).
Ukraine and the Republic of Moldova).                                 7 https://unfccc.int/process-and-meetings/transparency-and-
                                                                   reporting/reporting-and-review-under-the-convention/greenhouse-
                                                                   gas-inventories-annex-i-parties/national-inventory-submissions-
                                                                   2019 (last access: January 2021)

https://doi.org/10.5194/essd-13-2307-2021                                          Earth Syst. Sci. Data, 13, 2307–2362, 2021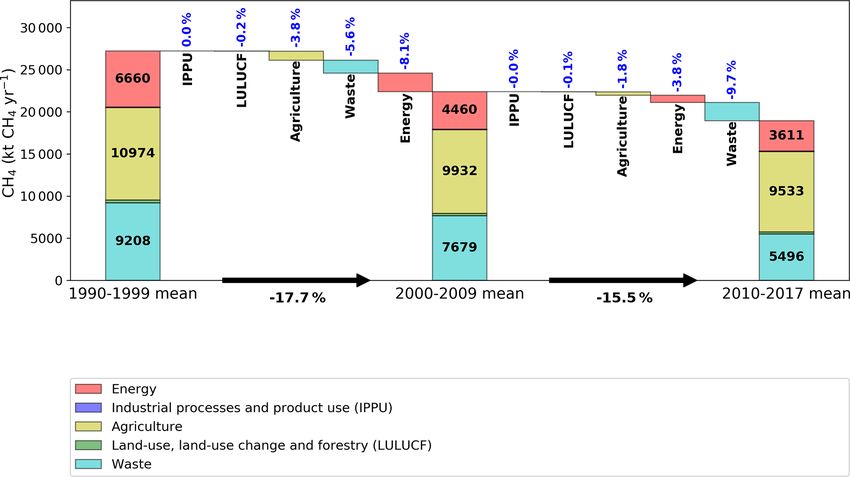
2314          A. M. R. Petrescu et al.: European synthesis of CH4 and N2 O emissions for the EU27 and UK: 1990–2017

2.2 CH4 and N2 O anthropogenic and natural emissions             natural emissions from soils, since these emissions are rel-
    from other bottom-up sources                                 atively small for temperate regions, including Europe, and
                                                                 cannot be singled out in landscapes largely dominated by hu-
We used four global CH4 and N2 O BU anthropogenic emis-          man activities. Therefore, the only “natural” fluxes consid-
sions inventories: CAPRI, FAOSTAT, GAINS and EDGAR               ered in this study are emissions from inland waters (lakes,
v5.0 (Tables 2 and 3). These estimates are not completely in-    rivers and reservoirs, Maavara et al., 2019; Lauerwald et al.,
dependent from NGHGIs (see Fig. 4 in Petrescu et al., 2020a)     2019, Appendix A3) even if more than half of the emis-
as they integrate their own sectorial modeling with the UN-      sions (56 % globally, Tian et al., 2020, and 66 % for Europe
FCCC data (e.g., common activity data and IPCC emission          this study) are due to eutrophication following N fertilizer
factors) when no other source of information is available.       leaching to inland waters. Emissions from natural soils in
   Anthropogenic emissions from these datasets follow and        this study are considered anthropogenic because, according
can be matched to Table 1 sectors. The CH4 biomass and           country-specific national inventory reports (NIRs), all land in
biofuel burning emissions are included in NGHGIs under the       the EU27 + UK is considered to be managed, except 5 % of
UNFCCC LULUCF sector, although they are identified as            France’s EU territory.
a separate category by the Global Carbon Project CH4 bud-
get synthesis (Saunois et al., 2020). For both CH4 and N2 O,     2.3 CH4 and N2 O emission data from top-down
CAPRI (Britz and Witzke, 2014; Weiss and Leip, 2012) and             inversions
FAOSTAT (FAO, 2020) report only agricultural emissions.
None of the BU inventories reported uncertainties, except for    Inversions combine atmospheric observations, transport and
the 2015 values of EDGAR v5.0 (Solazzo et al., 2021) and         chemistry models, and estimates of GHG sources all with
for an earlier FAOSTAT dataset only up to 2010 (Tubiello         their uncertainties to estimate emissions. Emission estimates
et al., 2013, and Appendix B).                                   from inversions depend on the dataset of atmospheric mea-
   The CH4 natural emissions belong to “peatlands” and           surements and the choice of the atmospheric model, as well
“other natural emissions”, with the latter including geo-        as on other settings (e.g., prior emissions and their uncer-
logical sources and inland waters (lakes and reservoirs),        tainties). Inversion outputs were taken from original publi-
following Saunois et al. (2020). For peatlands, we used          cations without evaluation of their performance through spe-
the JSBACH–HIMMELI framework and the ensemble of                 cific metrics (e.g., fit to independent cross-validation atmo-
13 monthly gridded estimates of peatland emissions based on      spheric measurements (Bergamaschi et al., 2013, 2018; Patra
different land surface models as calculated for Saunois et al.   et al., 2016). Some of the inversions solve explicitly for sec-
(2020), all described in Appendix A2. In EU27 + UK, geo-         tors; others solve for all fluxes in each grid cell and separate
logical emissions were calculated by scaling up the regional     sectors using prior grid-cell fractions (see details in Saunois
emissions from Etiope et al. (2019) (37.4 Tg CH4 yr−1 ) to       et al., 2020, for global inversions).
the global ratio of emissions from Hmiel et al. (2020)              For CH4 , we use 9 regional TD inversions and 22 global
(see Appendix A2, geological fluxes), obtaining an esti-         TD inversions listed in Table 2. These inversions are not
mate of 1.3 Tg CH4 yr−1 (marine and land geological). Ma-        independent from each other: some are variants from the
rine seepage emissions were excluded. This rescaled geolog-      same modeling group, many use the same transport model
ical source represents 24 % of the total EU27 + UK natural       and most of them use the same atmospheric data. Differ-
CH4 emissions. Inland waters (lakes and reservoirs, based        ent prior data are generally used in models, which produce a
on Lauerwald et al., 2019, and Del Sontro et al., 2018)          greater range of posterior emission estimates (Appendix B3,
(Appendix A2) are the largest natural component (48 %),          Table B4). The subset of InGOS inversions (Bergamaschi
with the rest (28 %) being attributed to peatlands. Overall,     et al., 2018a) belongs to a project where all models used
in the EU27 + UK the natural emissions thus accounted for        the same atmospheric data over Europe covering the period
5.2 Tg CH4 yr−1 .                                                2006–2012. The global inversions from Saunois et al. (2020)
   The N2 O anthropogenic emissions from BU datasets be-         were all updated to 2017.
long predominantly to two main categories, as presented             The regional inversions generally use both higher-
in Table 2: (1) direct emissions from the agricultural sec-      resolution a priori data and higher-resolution transport mod-
tor where synthetic fertilizers and manure were applied, as      els, and, e.g., TM5-JRC runs simultaneously over the global
well as from manure management; and (2) indirect emis-           domain at coarse resolution and over the European domain
sions on non-agricultural land and water receiving anthro-       at higher resolution, with atmospheric CH4 concentration
pogenic N through atmospheric N deposition, leaching and         boundary conditions taken from global fields. For CH4 , 11
runoff (also from agricultural land). Furthermore, emissions     global inversions use GOSAT for the period 2010–2017, 8
from industrial processes are declining over time but orig-      global inversions use surface stations (SURF) since 2000, 2
inate from fossil fuel combustion, air pollution abatement       global inversions use SURF since 2010 and 1 global inver-
devices, specific chemical reactions, wastewater treatment       sion uses SURF since 2003 (see Appendix 4 Table in Saunois
and land use change. In this study, we do not consider the       et al., 2020, and Table 2 below). All regional inversions use

Earth Syst. Sci. Data, 13, 2307–2362, 2021                                       https://doi.org/10.5194/essd-13-2307-2021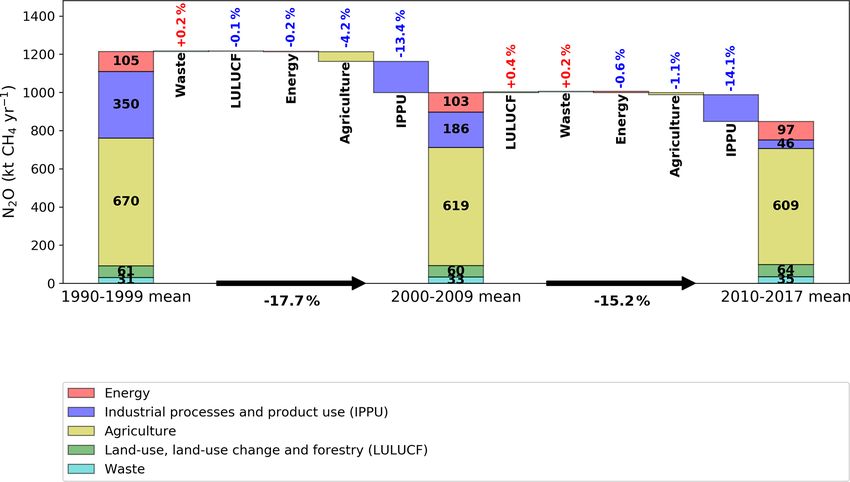
A. M. R. Petrescu et al.: European synthesis of CH4 and N2 O emissions for the EU27 and UK: 1990–2017                       2315

observations from SURF stations as a base of their emission        year 1990 and mean of the 2011–2015 period. This period
calculation.                                                       was the common denominator for which data were available,
   For N2 O, we use one regional inversion (FLEXIN-                including 2 years of the Kyoto Protocol first reporting period
VERT_NILU for 2005–2017 period) and three global inver-            (2011/12) and reaching the year of the Paris Agreement was
sions for the period 1998–2016 from Thompson et al. (2019),        adopted. We aim with the selection of this period to bring to-
listed in Table 2. These inversions are not completely inde-       gether all information over a 5-year period for which values
pendent from each other since most of them use the same            are known in 2018. In fact, this can be seen as a reference
input information (Appendix B, Table B4). The regional in-         for what we can achieve in 2023, the year of the first global
version uses a higher-resolution transport model for Europe,       stocktake, where for most UN Parties the reported invento-
with atmospheric N2 O concentration boundary conditions            ries will be known until 2021. Given that the global stocktake
taken from global fields. As all inversions derived total rather   is only repeated every 5 years, a 5-year average is clearly of
than anthropogenic emissions; emissions from inland wa-            interest.
ters (lakes, rivers and reservoirs) estimated by Maavara et al.       The total NGHGI estimates include emissions from all
(2019) and Lauerwald et al. (2019) were subtracted from the        sectors, and we plot and compare them with fluxes from
total emissions. Note that the estimates of Maavara et al.         global datasets, BU models and inversions. We note that
(2019) and Lauerwald et al. (2019) include anthropogenic           for all five regions, the NGHGI-reported CH4 emissions de-
emissions from N fertilizer leaching accounting for 66 %           creased by 21 % in southern Europe, by up to 54 % in eastern
of the inland water emissions in the EU27 + UK. In 2016,           Europe and by 35 % for the European Union with respect to
emissions from rivers represent 2.2 % of the total UNFCCC          the 1990 value. This is encouraging in the context of meeting
NGHGI (2019) N2 O emissions. The natural N2 O emissions            EU commitments under the PA (at least 50 % and towards
are small but should be better quantified in the future to allow   55 % compared with 1990 levels stated by the amended pro-
for a more accurate comparison between BU (anthropogenic           posal for a regulation of the European Parliament and of
sources only) and TD estimates.                                    the council on establishing the framework for achieving cli-
   The largest share of N2 O emissions comes from the agri-        mate neutrality and amending Regulation (EU) 2018/1999
cultural soils (direct and indirect emissions from the ap-         (European Climate Law) (https://ec.europa.eu/clima/sites/
plications of fertilizers, whether synthetic or manure) con-       clima/files/eu-climate-action/docs/prop_reg_ecl_en.pdf, last
tributing in 2017 69 % of the total N2 O emissions (exclud-        access: November 2020) and reaching carbon neutrality by
ing LULUCF) in the EU27 + UK. Table B3 in Appendix B1              2050). It also shows that the emissions from BU (anthro-
presents the allocation of emissions by activity type cover-       pogenic and natural) and TD estimates agree well with re-
ing all agricultural activities and natural emissions, following   ported NGHGI data despite the high uncertainty observed in
the IPCC classification. We notice that each data product has      the TD models not only at the EU27 + UK level but also at
its own particular way of grouping emissions and does not          the regional European level. This uncertainty is represented
necessarily cover all emissions activities. Main inconsisten-      here by the variability in the model ensembles and denotes
cies between models and inventories are observed with ac-          the range of the extremes (min and max) of estimates within
tivity allocation in the two models (ECOSSE and DayCent).          each model ensemble. From Fig. 1 we clearly note that north-
ECOSSE only estimates direct N2 O emissions and does not           ern Europe is dominated by natural (wetlands) emissions
estimate downstream emissions of N2 O, for example indirect        while western, central and southern European emissions are
emissions from nitrate leached into water courses, which also      dominated by anthropogenic sectors (e.g., agriculture).
contributes to an underestimation of the total N2 O emissions.        The EDGAR v5.0 estimate for northern Europe is twice
Field burning emissions are also not included by most of the       as high when compared to NGHGI and GAINS, and this is
data sources.                                                      because of CH4 emissions from the fuel production and dis-
                                                                   tribution (IPCC sector 1B) and waste sectors. Most Scandi-
                                                                   navian countries rely for their power and heat supply on bio-
3     Results and discussion                                       genic fuels, which introduces more uncertainty in the use of
                                                                   activity data and emission factors. The allocation of auto-
3.1     Comparing CH4 emission estimates from different            producers as explained in Sect. 3.2 could be another rea-
        approaches                                                 son for differences. The waste sector emissions for Norway,
3.1.1    Estimates of European and regional total CH4              Sweden, Finland and Estonia are different but still consistent
         fluxes                                                    with the landfill emissions from EDGAR v4.3.2, which are
                                                                   known to be up to twice as high as the nationally reported
We present results of the total CH4 fluxes from the                value (Janssens-Maenhout et al., 2019). For eastern Europe
EU27 + UK and five main regions in Europe: north, west,            we note that BU anthropogenic estimates have the same mag-
central, east (non-EU) and south. The countries included in        nitude as the TD. One possible explanation is linked to the
these regions are listed in Appendix A, Table A1. Figure 1         fact that for TD estimates (i.e., using atmospheric inversions)
shows the total CH4 fluxes from NGHGIs for both the base           the fluxes are strongly constrained by the density of observa-

https://doi.org/10.5194/essd-13-2307-2021                                         Earth Syst. Sci. Data, 13, 2307–2362, 2021
2316 A. M. R. Petrescu et al.: European synthesis of CH4 and N2 O emissions for the EU27 and UK: 1990–2017
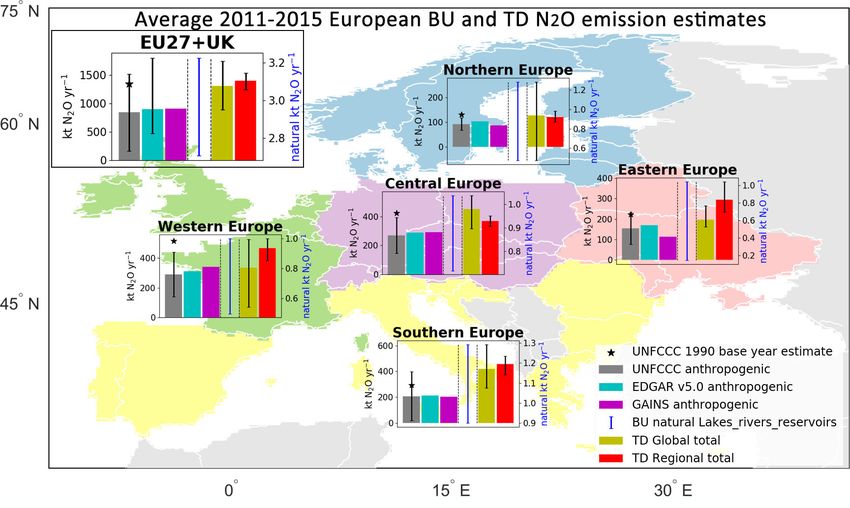
Figure 1. Five-year-average (2011–2015) total CH4 emission estimates (including LULUCF) for the EU27 + UK and five European regions
(north, west, central, south and east non-EU). The eastern European region does not include European Russia, and the UNFCCC uncertainty
for the Republic of Moldova was not available. Northern Europe includes Norway. Central Europe includes Switzerland. The data belong to
the UNFCCC NGHGI (2019) submissions (grey) and base year 1990 (black star), two BU inventories (GAINS and EDGAR v5.0), natural
unmanaged emissions (sum of peatland, geological and inland water emissions), and three TD total estimates (regional European inversions
– excluding InGOS unavailable for 2013–2015 – and GOSAT and SURF estimates from global inverse models). The relative error on the
UNFCCC value represents the UNFCCC NGHGI (2018) reported uncertainty computed with the error propagation method (95 % confidence
interval): 9.3 % for the EU27 + UK, 10 % for eastern Europe non-EU, 7.8 % for northern Europe, 10.9 % for southern Europe, 16.1 % for
western Europe and 11 % for central Europe. The uncertainty for EDGAR v5.0 was calculated for 2015 and represents the 95 % confidence
interval of a lognormal distribution.
tions. Where there are few or no observations, the fluxes in CH4 emissions, followed by emissions from waste, 27 %
the inversion will stay close to the prior estimates, since there (± 23 %). The large share of agriculture in total anthro-
is little or no information to adjust them. pogenic CH4 emissions also holds at the global level (IPCC,
In line with Bergamaschi et al. (2018a) we highlight the 2019a). Between the 1990s and the 2000s, the net −17.7 %
potential significant contribution from natural unmanaged reduction originates largely from energy and waste, with
sources (peatlands, geological and inland water), which for IPPU (metal and chemical industry) and LULUCF having
the EU27 + UK accounted for 5.24 Tg CH4 yr−1 (Fig. 1). negligible change. Between the 2000s and 2010–2017, the
Taking into account these natural unmanaged CH4 emissions −15.5 % reduction is distributed more evenly across sec-
and adding the to the range of the anthropogenic estimates tors, with waste having the largest contribution and industry
(19–21 Tg CH4 yr−1 ), the total BU estimates become broadly showing no change. The two largest sectors composing total
consistent for all European regions with the range of the TD EU27 + UK emission are the agriculture and waste sectors,
estimates (23–28 Tg CH4 yr−1 ). but the energy and waste sectors have shown higher reduc-
tions over the last decade.
The reduction observed in the waste sector is partly due
3.1.2 NGHGI sectoral emissions and decadal changes to the adoption of the first EU methane strategy published in
According to the UNFCCC (2019) NGHGI estimates, in 1996 (COM(96), 1996). EU legislation addressing emissions
2017 the EU27 + UK emitted GHGs totaling 3.9 Gt CO2 eq. in the waste sector proved to be successful and brought about
(including LULUCF); of this total, CH4 emissions ac- the largest reductions. Directive 1999/31/EC on the landfill
counted for ∼ 11 % (0.4 Gt CO2 eq. or 18.1 Mt CH4 yr−1 ) of waste (also referred to as the Landfill Directive) required
(Appendix B2, Fig. B1a) with France, the UK and Germany the members states (MSs) to separate waste, minimizing the
contributing together 36 % of the total CH4 emissions. amount of biodegradable waste disposed untreated in land-
The data in Fig. 2 show anthropogenic CH4 emissions and fills, and to install landfill gas recovery at all new sites. Based
their change from one decade to the next, from UNFCCC on the 1999 directive, the new 2018/1999 EU regulation on
NGHGI (2019), with the contribution from different UN- the governance of the Energy Union requires the European
FCCC sectors. In 2017, NGHGIs report CH4 from agricul- Commission to propose a strategic plan for methane, which
tural activities to be 52 % (± 10 %) of the total EU27 + UK will become an integral part of the EU’s long-term strategy.
Earth Syst. Sci. Data, 13, 2307–2362, 2021 https://doi.org/10.5194/essd-13-2307-2021A. M. R. Petrescu et al.: European synthesis of CH4 and N2 O emissions for the EU27 and UK: 1990–2017 2317
Figure 2. The contribution of changes (%) in CH4 anthropogenic emissions in the five UNFCCC sectors to the overall change in decadal
mean, as reported to UNFCCC NGHGI (2019). The three stacked columns represent the average CH4 emissions from each sector during
three periods (1990–1999, 2000–2009 and 2010–2017), and percentages represent the contribution of each sector to the total reduction
percentages (black arrows) between periods.
In the waste sector, the key proposal included the adoption e. For the energy sector (Fig. 3b), both EDGAR v5.0 and
of EU legislation requiring the installation of methane recov- GAINS match the NGHGI trend well thanks to updated
ery and use systems at new and existing landfills. Other sug- methodology that derives bottom-up emission factors and
gested actions included measures aimed at the minimization, accounts for country-specific information about associated
separate collection and material recovery of organic waste petroleum gas generation and recovery, venting, and flaring
(Olczak and Piebalgs, 2019). (Höglund-Isaksson, 2017). After 2005, GAINS reports con-
sistently lower emissions than UNFCCC due to a phasedown
of hard coal production in the Czech Republic, Germany,
3.1.3 NGHGI estimates compared with bottom-up
Poland and the UK; a decline in oil production in particular
inventories
in the UK; and declining emission factors reflecting reduced
The data in Fig. 3 present the total anthropogenic leakage from gas distribution networks as old town gas net-
CH4 emissions from four BU inventories and UNFCCC works are replaced. The consistently higher estimates (+6 %
NGHGI (2019) excluding those from LULUCF. Accord- compared to the UNFCCC mean) of EDGAR v5.0 might be
ing to NGHGIs, anthropogenic emissions from the total due to the use of default emission factors for oil and gas
EU27 + UK of the four UNFCCC sectors (Table 1, exclud- production based on data from the US (Janssens-Maenhout
ing LULUCF) amounted to 18.2 Tg of CH4 in the year 2017, et al., 2019). Next to that, several other reasons could be the
which is 10.7 % of the total GHG emissions in CO2 eq. cause for the differences (e.g., use of Tier 1 emission fac-
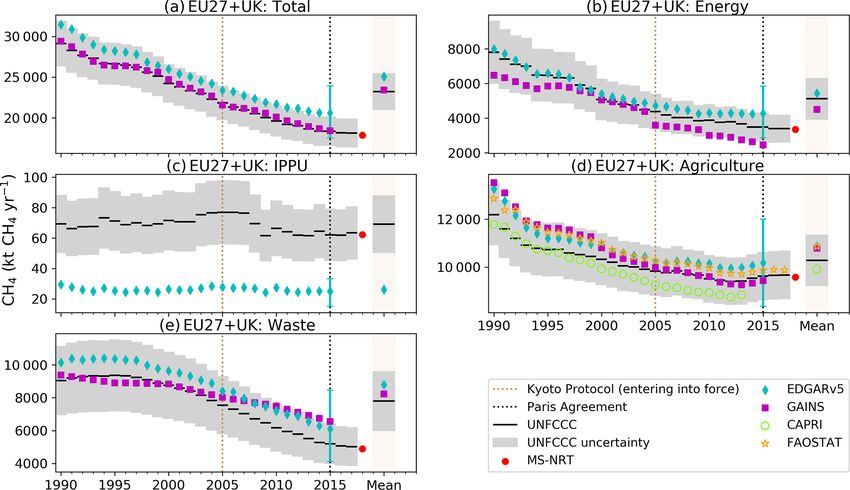
In Fig. 3a, we observe that EDGAR v5.0 and GAINS tors for coal mines, assumptions for material in the pipelines
show consistent trends with NGHGIs (excluding LULUCF), (in the case of gas transport) and the activity data). EDGAR
but GAINS reports consistently lower estimates (10 %) and v5.0, for example, uses the gas pipeline length as a proxy for
EDGAR v5.0 consistently higher estimates (8 %) compared the activity data; however, this may not be appropriate for
to NGHGIs. In contrast to the previous version, EDGAR the case of the official data, which could consider the total
v4.3.2, which was found by Petrescu et al. (2020a) to be amount of gas being transported or both methods according
consistent with NGHGI (2018) data, EDGAR v5.0 reports to the countries. Using pipeline length may overestimate the
higher estimates but within the 9.4 % UNFCCC uncertainty emissions because the pipeline is not always at 100 % ca-
range. The trends in emissions agree better between the two pacity; thus, a larger amount of methane is assumed to be
BU inventories and NGHGIs over 1990–2015, with linear leaked. For coal mining, emissions are a function of the dif-
trends of −1.5 % yr−1 in NGHGIs compared to −1.5 % yr−1 ferent types of processes being modeled.
in GAINS and −1.4 % yr−1 in EDGAR v5.0. The IPPU sector (Fig. 3c), which has only a small share of
Sectoral time series of anthropogenic CH4 emissions (ex- the total emissions, is not reported in GAINS, while EDGAR
cluding LULUCF) and their means are shown in Fig. 3b– v5.0 estimates are less than half of the emissions reported
https://doi.org/10.5194/essd-13-2307-2021 Earth Syst. Sci. Data, 13, 2307–2362, 20212318 A. M. R. Petrescu et al.: European synthesis of CH4 and N2 O emissions for the EU27 and UK: 1990–2017
Figure 3. Total anthropogenic CH4 emissions (excluding LULUCF): (a) of the EU27 + UK and total sectoral emissions as (b) energy,
(c) IPPU, (d) agriculture and (e) waste from UNFCCC NGHGI (2019) submissions and MS-NRT 2018 compared to global bottom-up
inventory models for agriculture (CAPRI, FAOSTAT) and all sectors excluding LULUCF (EDGAR v5.0, GAINS). CAPRI reports one
estimate for Belgium and Luxembourg. The relative error on the UNFCCC value represents the UNFCCC NGHGI (2018) MS-reported
uncertainty computed with the error propagation method (95 % confidence interval): 9.4 % for the total EU27 + UK, 23 % for energy and
waste, 27 % for IPPU and 10 % for agriculture. The uncertainty for EDGAR v5.0 was calculated for 2015, and the min/max values for
all sectors are as follows: EU27 + UK total 15/16, energy 33/37, IPPU 39/34, agriculture 18/18 and waste 32/38; it represents the 95 %
confidence interval of a lognormal distribution. The mean values on the right-hand side reflect the values for the common overlapping period
1990–2015. The last reported year in this study refers to 2017 (UNFCCC and FAOSTAT), 2015 (EDGAR v5.0 and GAINS) and 2013
(CAPRI).
by NGHGI 2019 in this sector. The discrepancy for this ing at the time series mean, EDGAR v5.0, GAINS and FAO-
sector has a negligible impact on discrepancy for the total STAT show a similar value, +5 % higher than the NGHGI.
CH4 emission. However, we identified that the low bias of This shows good consistency between the three BU esti-
EDGAR v5.0 could be explained by fewer activities included mates and UNFCCC likely due to the use of similar activity
in EDGAR v5.0 (e.g., missing solvent, electronics and other data and emission factors (EFs); cf. Fig. 4 in Petrescu et al.
manufacturing goods), accounting for 5.5 % of the total IPPU (2020a).
emissions in 2015 reported to UNFCCC. The reason for the For the waste sector (Fig. 3e) EDGAR v5.0 shows con-
remaining difference could be explained by the allocation of sistent higher estimates compared to the NGHGI data, while
emissions from auto-producers8 in EDGAR v5.0 to the en- GAINS emissions have an increasing trend after 2000 (mean
ergy sector (following the IPCC 1996 guidelines), while in 1990–2015 value 6 % higher than NGHGIs). The two inven-
NGHGIs they are reported under the IPPU sector (following tories, EDGAR v5.0 2020 update for landfills and GAINS,
the 2006 IPCC Guidelines). used an approach based on the decomposition of waste into
As CAPRI and FAOSTAT just report emissions from agri- different biodegradable streams, with the aim of applying the
culture, we only included them in Fig. 3d. The data show methodology described in the 2019 Refinement to the 2006
that the four data sources (EDGAR v5.0, GAINS, CAPRI IPCC Guidelines for National Greenhouse Gas Inventories
and FAOSTAT) show good agreement, with CAPRI at the and the IPCC waste model (IPCC, 2019b) using the first-
lower range of emissions (Petrescu et al., 2020a) and on aver- order-decay (FOD) method. The main differences between
age 3 % lower than UNFCCC and EDGAR v5.0 at the upper the two datasets come from (i) sources for total waste gen-
range. The reason for EDGAR v5.0 having the highest esti- erated per person, (ii) assumption for the fraction composted
mate (contrary to Petrescu et al., 2020a, where NGHGIs were and (iii) the oxidation. The two inventories may have used
the highest and EDGAR v4.3.2 the second highest) is likely different strategies to complete the waste database when in-
due to the activity data updates in EDGAR v5.0 based on consistencies were observed in the EUROSTAT database or
FAOSTAT values, compared to EDGAR v4.3.2. When look- in the waste trends in UNFCCC.
8 Auto-producers of electricity and heat: cogeneration by indus-
tries and companies for housing management (central heating and
other services) (Olivier et al., 2017, PBL report).
Earth Syst. Sci. Data, 13, 2307–2362, 2021 https://doi.org/10.5194/essd-13-2307-2021A. M. R. Petrescu et al.: European synthesis of CH4 and N2 O emissions for the EU27 and UK: 1990–2017 2319
Figure 4. (a) Comparison of the total CH4 emissions from top-down regional inversions with UNFCCC NGHGI (2019) data and inland
water (lakes_reservoirs_ULB, pink), peatland (from JSBACH–HIMMELI, green) and geological emissions (yellow); (b) comparison of
anthropogenic CH4 emissions from top-down regional inversions with UNFCCC NGHGI (2019) data. Anthropogenic emissions from these
inversions are obtained by removing natural emissions shown in Fig. 4a. The MS-NRT LULUCF estimate does not include the following
countries: Austria, Belgium, Estonia, Croatia, Hungary, Luxembourg, Latvia, Malta and Slovenia. UNFCCC NGHGI (2018) reported the
uncertainty computed with the error propagation method (95 % confidence interval) is 9.29 % and represents the UNFCCC NGHGI (2018)
MS-reported uncertainty for all sectors (including LULUCF). The time series mean was computed for the common period 2006–2012.
3.1.4 NGHGI estimates compared to atmospheric For the common period 2006–2012, the four inverse
inversions models give a total CH4 emissions mean of 25.8 (24.0–
27.4) Tg CH4 yr−1 compared to anthropogenic total of
Regional inversions
20.3 ± 1.9 Tg CH4 yr−1 in NGHGIs (Fig. 4a). The large pos-
Figure 4 compares TD regional estimates with NGHGI an- itive difference between TD and NGHGIs suggests a po-
thropogenic data for CH4 and with natural BU emissions. tentially significant contribution from natural sources (peat-
We present TD estimates of the total emissions (Fig. 4a) as lands, geological sources and inland waters), which for the
well as estimates of anthropogenic emissions only (Fig. 4b), same period report a total mean of 5.2 Tg CH4 yr−1 . How-
which are calculated by subtracting the natural emissions ever, it needs to be emphasized that wetland emission es-
from the total inversions. timates have large uncertainties and show large variability
The TD estimates of European CH4 emissions of Fig. 4 in the spatial (seasonal) distribution of CH4 emissions, but
use four European regional models (2005–2017) and an en- for Europe their inter-annual variability is not very strong
semble of five different inverse models (InGOS, Bergam- (mean of 13 years from JSBACH–HIMMELI peatland emis-
aschi et al., 2015) for 2006–2012. sions 1.4 ± 0.1 Tg CH4 yr−1 ). Overall, they do represent an
important source and could dominate the budget assessments
https://doi.org/10.5194/essd-13-2307-2021 Earth Syst. Sci. Data, 13, 2307–2362, 2021You can also read