The Global Financial Centres Index 30 - September 2021 - Financial Centre Futures - Long Finance
←
→
Page content transcription
If your browser does not render page correctly, please read the page content below
The Global
Financial Centres
Index 30
September 2021

   Financial Centre Futures
In March 2007, Z/Yen and the City Of London released the first edition of the GFCI, which continues to
provide evaluations of competitiveness and rankings for the major financial centres around the world.
We are pleased to present the thirtieth edition of the Global Financial Centres Index (GFCI 30).

In July 2016, Z/Yen and the China Development Institute (CDI) in Shenzhen established a strategic
partnership for research into financial centres. We continue our collaboration in producing the GFCI.
The GFCI is updated every March and September and receives considerable attention from the global
financial community. The index serves as a valuable reference for policy and investment decisions.

Z/Yen is the City of London's leading commercial think-tank, founded in 1994 to promote societal
advance through better finance and technology. Z/Yen has built its practice around a core of high-
powered project managers, supported by experienced technical specialists so that clients get
expertise they need, rather than just resources available.

The CDI is a leading national think-tank that develops solutions to public policy challenges through
broad-scope and in-depth research to help advance China’s reform and opening-up to world markets.
The CDI has been working on the promotion and development of China’s financial system since its
establishment in 1989. Based on rigorous research and objective analysis, CDI is committed to
providing innovative and pragmatic reports for governments at different levels in China and
corporations at home and abroad.

The authors of this report, Mike
Wardle and Professor Michael Mainelli,
would like to thank Bikash Kharel,
Carol Feng, Peng Yu, and the rest of
the GFCI team for their contributions
with research, modelling, and ideas.

Cover Photo by Shwetha Shankar on Unsplash

The Global Financial Centres Index 30

Foreword
I wish to begin by expressing my deepest gratitude to Z/Yen Group for hosting the Global Financial
Centres Index (GFCI) 30 launch event with Busan Metropolitan City and the Busan Finance Center.

Since designation as a financial hub by the central government in 2009, Busan has made continuous
efforts to enhance its presence as one of the most significant financial centers in the world. As a result,
Busan is approaching the top 30 in the GFCI since the first half of 2020.

Busan will continue to exert further effort and maximize its potential to become a global logistics
center by establishing a tri-port system which connects air, sea, and rail. In addition, Busan is in the
process of building a new international airport on Gaduk-do Island near Busan New Port by 2030.
Furthermore, Busan has plans to build a new rail system connecting the new airport and port to the
Eurasian Continent.

Since being designated as a blockchain deregulation zone in 2019, Busan has committed to building a
blockchain and FinTech-centered city by accelerating its demonstration projects and business
commercialization in six areas; smart logistics and tourism, public safety, finance, real estate, medical
data. Busan is also focused on effectively responding to climate change by applying green finance to
meet the increasing demand for eco-friendly ships.

As such, Busan is proudly taking a leap towards becoming a global logistics hub and Green Smart City
by establishing the necessary infrastructure for the future. What’s more, Busan will make every effort
to successfully win the bid for the 2030 World Expo.

In closing, I sincerely ask for your kind interest and support on our great journey towards becoming a
globally recognized international financial city.

Thank you.

Park Heong-joon
Mayor
Busan Metropolitan City

                                                     1
The Global Financial Centres Index 30

GFCI 30 Summary & Headlines
Overview
• We researched 126 centres for this edition of the Global Financial Centres Index (GFCI 30). The
  number of financial centres in the main index has increased from 114 to 116 with the addition of
  Kigali and Lagos. There are 10 associate centres awaiting potential inclusion in the main index.
• Among the top 40 centres, only two fell more than 10 rank places, and six rose more than 10
  places.
• Overall the average rating fell 12.9 points (2.05%). While a small change, this is the third
  consecutive fall in the average rating.
• These factors suggest that there remains some lack of confidence in the world economy. The fact
  that overall ratings continue to fall against the levels that we saw in 2019 reflects the continuing
  uncertainty around international trade, the impact of the covid-19 pandemic, and geopolitical and
  local unrest.
• Asia/Pacific centres generally fell in the ratings in GFCI 30, and assessments from people based in
  Asia/Pacific suggest that they judge Chinese centres in particular less favourably than before. This
  might suggest that the economic gains in the region arising from covid-19 may be levelling off.
• North American centres performed well in GFCI 30. This is likely to reflect renewed optimism
  about the US and Canadian economies as they move forward from the pandemic.
• The relatively strong performance of New York and London suggests that the financial services
  sectors in these cities managed to sustain their performance despite radical changes in working
  practices during the last 18 months.

GFCI 30 Results

Leading Centres
• New York leads the ranking, with London second. Both centres fell only slightly in the ratings.
• Hong Kong and Singapore in third and fourth positions fell 25 points in the ratings.
• San Francisco, Los Angeles, and Paris entered the top 10 in GFCI 30, with falls in the ratings and
  rankings for other leading Asian centres.
• Nine of the top 10 centres in the index fell in the ratings.

Western Europe
• London continues to lead in the region, dropping only three points in the ratings. This reflects
  confidence in the longer-term prospects for the centre.
• Other leading Western European centres had mixed results, with Paris, Amsterdam, Madrid,
  Stockholm, Hamburg, and Munich moving up the rankings while Frankfurt, Zurich, Edinburgh,
  Luxembourg, Stuttgart, and Brussels fell back, as centres compete following Brexit.

Asia/Pacific
• The majority of the Asia/Pacific centres in the index fell in the rankings in GFCI 30. The exceptions
  were Hong Kong, Singapore, Seoul, Busan, Wellington, Qingdao, Mumbai, New Delhi, Bangkok,
  GIFT City-Gujarat, and Jakarta.
• This reflects the strong performance of other regions, and may also reflect a levelling off following
  the good economic performance of the region through the pandemic.
• Each of the Asia/Pacific centres in the top 10 in the GFCI dropped 25 points or more in the ratings.

                                                   2
The Global Financial Centres Index 30

North America
• North American centres performed strongly, with eight of the 11 centres in the region either
  maintaining or improving their ranking.
• Seven North American centres now feature in the top 20.
• Most centres saw a drop in their ratings, although these were not as sharp as in some other regions,
  enabling the rank improvements shown for the region.

Eastern Europe & Central Asia
• Moscow, Warsaw and Istanbul lead in the region, which also performed strongly.
• 12 of the 16 centres in the region rose in the GFCI rankings and nine centres improved their rating.
• Many economies in the region are forecast to recover strongly following the shock of 2020.

Middle East & Africa
• Dubai and Abu Dhabi take first and second places in the region, both improving in the ranking
  slightly.
• Casablanca continues to be the leading African centre, while Cape Town, Johannesburg, and Nairobi
  increased their ratings by more than 20 points.
• Kigali and Lagos join the index for the first time.

Latin America & The Caribbean
• Mexico City, Rio de Janeiro, and Sao Paulo were the only centres in the region to improve their
   ranking and ratings.
• Other centres, including the Caribbean islands, fell sharply in the ratings, reflecting the economic
   shock experienced in the region as a result of the covid-19 pandemic.

FinTech
We are able to rate 109 centres on their Fintech offering.
• Fintech ratings were generally lower than in previous editions of the index.
• New York and Shanghai retained first and second positions, with London rising two places to third
   place.
• In the top 40 positions, Western European centres performed well, with most gaining rank position.

GFCI 30
• GFCI 30 was compiled using 146 instrumental factors. These quantitative measures are provided by
  third parties including the World Bank, The Economist Intelligence Unit, the OECD, and the UN.
  Details can be found in Appendix 4.
• The instrumental factors were combined with 77,391 assessments of financial centres provided by
  12,862 respondents to the GFCI online questionnaire. A breakdown of the respondents is shown in
  Appendix 2.
• Further details of the methodology behind GFCI 30 are in Appendix 3.

                                                    3
The Global Financial Centres Index 30

Table 1 | GFCI 30 Top 58 Ranks And Ratings

                                   GFCI 30                       GFCI 29            Change In   Change In
Centre
                            Rank             Rating       Rank             Rating     Rank       Rating
New York                      1               762           1               764         0          ▼2
London                        2               740           2               743         0          ▼3
Hong Kong                     3               716           4               741        ▲1         ▼25
Singapore                     4               715           5               740        ▲1         ▼25
San Francisco                 5               714          12               718        ▲7          ▼4
Shanghai                      6               713           3               742        ▼3         ▼29
Los Angeles                   7               712          13               716        ▲6          ▼4
Beijing                       8               711           6               737        ▼2         ▼26
Tokyo                         9               706           7               736        ▼2         ▼30
Paris                        10               705          25               699       ▲15          ▲6
Chicago                      11               704          15               714        ▲4         ▼10
Boston                       12               703          24               703       ▲12           0
Seoul                        13               702          16               713        ▲3         ▼11
Frankfurt                    14               701           9               727        ▼5         ▼26
Washington DC                15               700          14               715        ▼1         ▼15
Shenzhen                     16               699           8               731        ▼8         ▼32
Amsterdam                    17               698          28               695       ▲11          ▲3
Dubai                        18               694          19               710        ▲1         ▼16
Toronto                      19               693          29               694       ▲10          ▼1
Geneva                       20               692          20               709         0         ▼17
Zurich                       21               690          10               720       ▼11         ▼30
Edinburgh                    22               689          21               708        ▼1         ▼19
Luxembourg                   23               688          17               712        ▼6         ▼24
Madrid                       24               687          33               683        ▲9          ▲4
Sydney                       25               686          18               711        ▼7         ▼25
Stockholm                    26               685          31               688        ▲5          ▼3
Montreal                     27               682          27               696         0         ▼14
Vancouver                    28               681          11               719       ▼17         ▼38
Melbourne                    29               680          23               705        ▼6         ▼25
Hamburg                      30               679          43               664       ▲13         ▲15
Munich                       31               678          49               647       ▲18         ▲31
Guangzhou                    32               677          22               706       ▼10         ▼29
Busan                        33               675          36               677        ▲3          ▼2
Copenhagen                   34               674          34               680         0          ▼6
Wellington                   35               673          46               660       ▲11         ▲13
Abu Dhabi                    36               672          38               675        ▲2          ▼3
Chengdu                      37               670          35               678        ▼2          ▼8
Qingdao                      38               668          42               665        ▲4          ▲3
Stuttgart                    39               667          30               689        ▼9         ▼22
Brussels                     40               666          37               676        ▼3         ▼10
Dublin                       41               665          48               650        ▲7         ▲15
Oslo                         42               663          70               594       ▲28         ▲69
Helsinki                     43               662          56               620       ▲13         ▲42
Vienna                       44               659          54               629       ▲10         ▲30
Milan                        45               656          26               698       ▼19         ▼42
Osaka                        46               655          32               684       ▼14         ▼29
Rome                         47               654          52               636        ▲5         ▲18
Kuala Lumpur                 48               649          47               652        ▼1          ▼3
Tel Aviv                     49               645          41               666        ▼8         ▼21
Moscow                       50               638          57               615        ▲7         ▲23
Calgary                      51               637          71               593       ▲20         ▲44
Lisbon                       52               636          50               641        ▼2          ▼5
Casablanca                   53               628          53               632         0          ▼4
Mumbai                       54               627          65               599       ▲11         ▲28
New Delhi                    55               625          80               584       ▲25         ▲41
Warsaw                       56               624          61               607        ▲5         ▲17
Jersey                       57               622          39               673       ▼18         ▼51
Bangkok                      58               621          59               610        ▲1         ▲11

                                                      4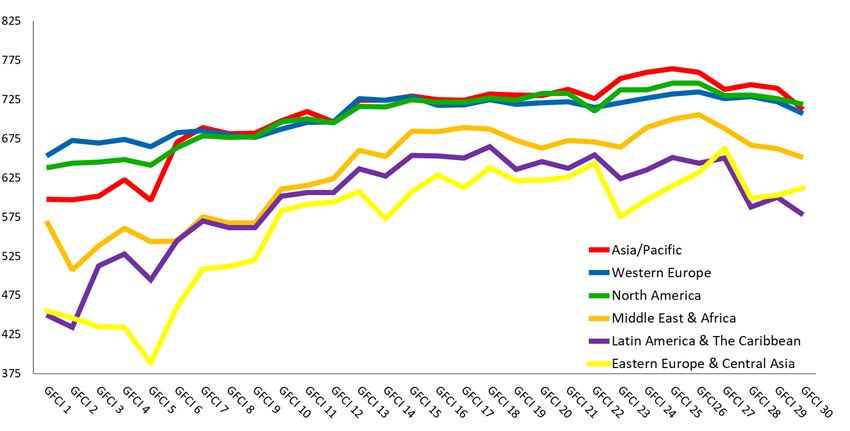
The Global Financial Centres Index 30

Table 1 (continued) | GFCI 30 Remaining Ranks And Ratings
                                     GFCI 30                       GFCI 29            Change In   Change In
Centre
                            Rank               Rating       Rank             Rating     Rank       Rating
Mexico City                  59                 617          69               595       ▲10         ▲22
Berlin                       60                 616          45               662       ▼15         ▼46
Istanbul                     61                 615          74               590       ▲13         ▲25
Cape Town                    62                 614          82               582       ▲20         ▲32
Prague                       63                 611          76               588       ▲13         ▲23
Johannesburg                 64                 609          90               572       ▲26         ▲37
Glasgow                      65                 608          81               583       ▲16         ▲25
Jakarta                      66                 607          93               567       ▲27         ▲40
Taipei                       67                 604          40               668       ▼27         ▼64
Doha                         68                 600          55               628       ▼13         ▼28
Rio de Janeiro               69                 595          77               587        ▲8         ▲8
San Diego                    70                 588          44               663       ▼26         ▼75
Bahrain                      71                 578          68               596        ▼3         ▼18
Liechtenstein                72                 577          51               638       ▼21         ▼61
Mauritius                    73                 575          89               573       ▲16         ▲2
Tallinn                      74                 570          87               575       ▲13         ▼5
Nur-Sultan                   75                 569          78              586        ▲3          ▼17
GIFT City-Gujarat            76                 568          92              568        ▲16          0
Cyprus                       77                 566          98              561        ▲21         ▲5
Monaco                       78                 565          60              609        ▼18         ▼44
Bratislava                   79                 564          66              598        ▼13         ▼34
Cayman Islands               80                 563          72              592        ▼8          ▼29
Santiago                     81                 561          67              597        ▼14         ▼36
Guernsey                     82                 560          75              589        ▼7          ▼29
Almaty                       83                 559         101              553        ▲18         ▲6
Sofia                        84                 558          95              565        ▲11         ▼7
Malta                        85                 557          63              603        ▼22         ▼46
Sao Paulo                    86                 556         104              542        ▲18         ▲14
British Virgin Islands       87                 555          58              614        ▼29         ▼59
Athens                       88                 554         103              545        ▲15         ▲9
Budapest                     89                 553          85              577        ▼4          ▼24
Barbados                     90                 552          64              600        ▼26         ▼48
Vilnius                      91                 551          62              606        ▼29         ▼55
Bermuda                      92                 550          84              580        ▼8          ▼30
Isle of Man                  93                 549          86              576        ▼7          ▼27
Kigali                       94                 548         New              New        New         New
Manila                       95                 547          79              585        ▼16         ▼38
Riga                         96                 546         109              493        ▲13         ▲53
Buenos Aires                 97                 545          91              571        ▼6          ▼26
Nairobi                      98                 541         106              520        ▲8          ▲21
Bahamas                      99                 540          73              591        ▼26         ▼51
Trinidad and Tobago         100                 539          97              563        ▼3          ▼24
Riyadh                      101                 538         105              541        ▲4          ▼3
Lagos                       102                 536         New              New        New         New
Bogota                      103                 535         100              554        ▼3          ▼19
Panama                      104                 532          94              566        ▼10         ▼34
Baku                        105                 531         107              515        ▲2          ▲16
Reykjavik                   106                 528         102              549        ▼4          ▼21
Gibraltar                   107                 524          99              559        ▼8          ▼35
Kuwait City                 108                 523          83              581        ▼25         ▼58
Tehran                      109                 511          96              564        ▼13         ▼53
St Petersburg               110                 502          88              574        ▼22         ▼72
Hangzhou                    111                 489         108              501        ▼3          ▼12
Tianjin                     112                 480         110              492        ▼2          ▼12
Dalian                      113                 470         111              491        ▼2          ▼21
Nanjing                     114                 462         113              484        ▼1          ▼22
Xi'an                       115                 451         112              485        ▼3          ▼34
Wuhan                       116                 400         114              469        ▼2          ▼69

                                                        5
The Global Financial Centres Index 30

Associate Centres

We track centres that have yet to achieve the number of assessments required to be listed in the main
GFCI index. 10 centres fall into this ‘associate centres’ category, with Ho Chi Minh City very close to
receiving the 150 assessments required to be listed in the index.

Table 2 | GFCI 30 Associate Centres

                                          Number Of Assessments In The
Centre                                                                          Mean Of Assessments
                                                Last 24 Months
Ho Chi Minh City                                         148                              552
Atlanta                                                  136                              587
Chisinau                                                 131                              583
Lugano                                                   129                              643
Turks and Caicos                                         122                              555
Andorra                                                   92                              559
Minneapolis / St Paul                                     75                              560
Karachi                                                   73                              566
Kaunas                                                    64                              555
Gothenburg                                                25                              592

Regional Performance

The mean rating of the top five Asia/Pacific centres has fallen below the same measure for North
America in GFCI 30, but remains ahead of Western Europe. While the average ratings for the leading
regions fell slightly in GFCI 30, the average for the leading Eastern European & Central Asian centres
improved from GFCI 29.

Chart 1 | Average Ratings Of The Top Five Centres In Each Region

                                                   6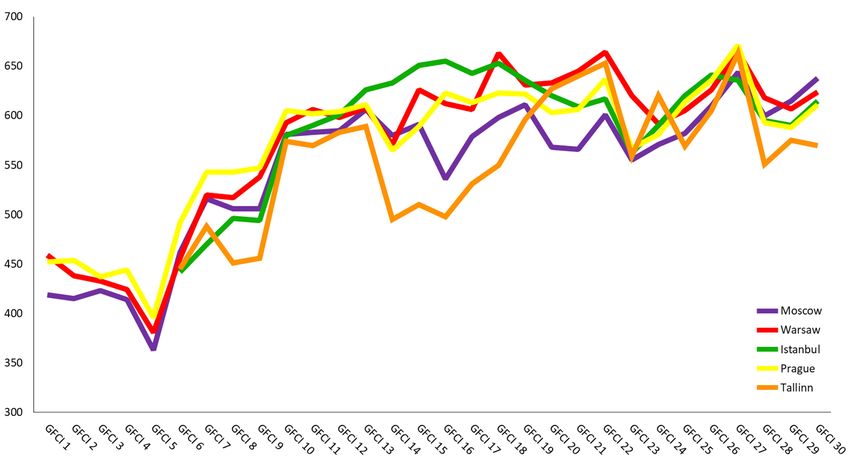
The Global Financial Centres Index 30

The Top Five Centres

New York retained its first place in the index, with London in second place, although both centres fell
slightly in the ratings. Hong Kong and Singapore rank third and fourth, with San Francisco taking fifth
place, overtaking Shanghai.

Chart 2 | The Top Five Centres - GFCI Ratings Over Time

  “Singapore's best resource is the
   talent pool that it has attracted
    over the years since its Asean
 scholarships launched. Education
 is almost free for the citizens with
      more than six world-class
 universities and polytechnics, and
       the Institute Of Technical
              Education.”
SENIOR ADVISER, INDUSTRY FINANCE, SINGAPORE

                                                    7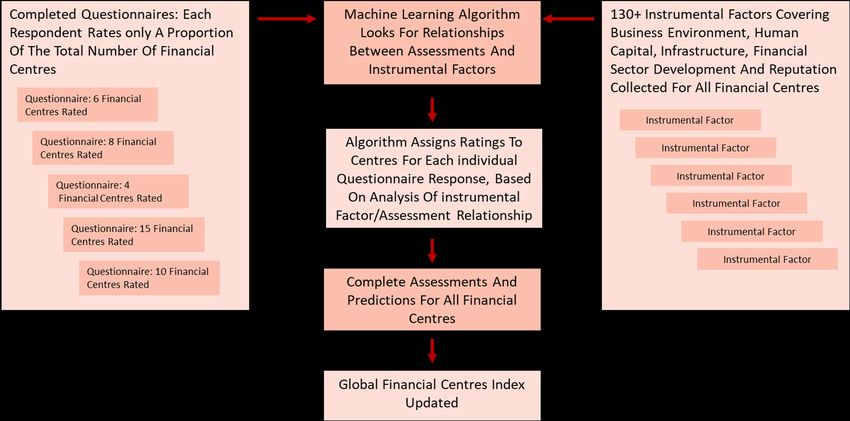
The Global Financial Centres Index 30

Future Prospects

The GFCI questionnaire asks respondents which centres they consider will become more significant
over the next two to three years. Nine of the 15 centres are in the Asia/Pacific region.

Table 3 | The 15 Centres Likely To Become More Significant

Centre                                                       Mentions in last 24 months

GIFT City-Gujarat                                                        393
Seoul                                                                    330
Singapore                                                                212
Shanghai                                                                 192
Stuttgart                                                                173
Beijing                                                                  122
Hong Kong                                                                105
Qingdao                                                                   92
New York                                                                  85
Guangzhou                                                                 77
London                                                                    77
Dubai                                                                     76
Kigali                                                                    74
Shenzhen                                                                  68
Frankfurt                                                                 65

    “Flexible working hours and expanded scope of accessing
   skilled people from various remote locations will become a
   norm going forward. However, the regulatory challenges in
   terms of employment law, vacation pay, security breaches,
     data protection, end of service will throw up their own
     challenges when considering skilled people from other
   jurisdictions or permitting existing staff to work from their
                         home country.”
 HEAD OF LEGAL, ASSET MANAGEMENT FIRM, DUBAI

                                                 8
The Global Financial Centres Index 30
Areas Of Competitiveness
The instrumental factors used in the GFCI model are grouped into five broad areas of competitiveness:
Business Environment, Human Capital, Infrastructure, Financial Sector Development, and Reputation.
These areas and the instrumental factor groups which comprise each area are shown in Chart 3.
Chart 3 | GFCI Areas Of Competitiveness
“Jersey already has some of the highest standards, AML
legal framework, strong regulator and regulation,
independent judiciary, and rule of law out of any IFC out
there. It attracts better quality capital flows as a result of its
standing with the likes OECD, Council of Europe etc. In any
IFC, a stable political, economic and social environment are
the prerequisites for its success.”
GROUP DIRECTOR, PROFESSIONAL SERVICES FIRM, JERSEY
9The Global Financial Centres Index 30
To assess how financial centres perform in each of these areas, the GFCI factor assessment model is
run separately for each of the five areas of competitiveness. New York takes the lead position in all five
areas, with London second in all areas except Human Capital, where Singapore takes second place. San
Francisco, Chicago, Singapore, Hong Kong, Paris, and Shanghai feature in the top five centres in one or
more areas.
Table 4 | GFCI 30 Top 15 Centres By Area Of Competitiveness
Financial Sector Reputational &
Rank Business Environment Human Capital Infrastructure
Development General
1 New York New York New York New York New York
2 London Singapore London London London
3 San Francisco London Singapore San Francisco Singapore
4 Chicago Hong Kong Hong Kong Shanghai Hong Kong
5 Singapore San Francisco Paris Hong Kong Chicago
6 Boston Chicago Frankfurt Singapore San Francisco
7 Hong Kong Paris Shanghai Chicago Edinburgh
8 Washington DC Dubai Los Angeles Beijing Seoul
9 Amsterdam Luxembourg Beijing Boston Toronto
10 Edinburgh Los Angeles Tokyo Los Angeles Washington DC
11 Copenhagen Boston Seoul Seoul Stockholm
12 Frankfurt Geneva San Francisco Washington DC Zurich
13 Tokyo Tokyo Amsterdam Luxembourg Tokyo
14 Shanghai Stuttgart Oslo Paris Paris
15 Geneva Washington DC Edinburgh Frankfurt Shanghai
“Reputation is important in recruiting and retaining top tier
talent. We still live in a global economy and good talent has
options of where to work. It also plays out with clients, or at
least the ones we deal with, who want to know that the
jurisdiction they are dealing in/with has a good reputation
not only as a location but also in terms of the regulatory
environment and rule of law.”
PORTFOLIO MANAGER, FAMILY OFFICE, VANCOUVER
10The Global Financial Centres Index 30
Industry Sectors
We investigate the differing assessments for relevant industry sectors by building the index
separately using only the responses provided by people working in those industries. This creates
separate sub-indices for Banking, Investment Management, Insurance, Professional Services,
Government & Regulatory, Finance, FinTech, and Trading sectors.
New York has consolidated its leading position, continuing to rank first in every category except
insurance, where Singapore has taken the top position. The leading centres all perform well across a
range of industries.
Table 5 | GFCI 30 Industry Sector Sub-Indices — Top Fifteen
Investment Professional Government
Rank Banking Insurance Finance FinTech Trading
Management Services & Regulatory
1 New York New York Singapore New York New York New York New York New York
2 Hong Kong London Hong Kong London London Shanghai Singapore London
3 Singapore Singapore Shanghai Singapore Singapore Beijing London Hong Kong
4 Shanghai Beijing New York Hong Kong Zurich Tokyo Shanghai Shanghai
5 London Shanghai Beijing Shanghai Hong Kong Hong Kong Wellington Singapore
6 Beijing Hong Kong London Luxembourg Geneva London Shenzhen Beijing
7 Shenzhen Taipei Shenzhen Shenzhen Shanghai Shenzhen Hong Kong Chicago
GIFT City-
8 Guangzhou Shenzhen Luxembourg Zurich Luxembourg Singapore Los Angeles
Gujarat
9 San Francisco Luxembourg Frankfurt San Francisco Seoul Luxembourg Beijing Frankfurt
10 Zurich Sydney Zurich Seoul Frankfurt Frankfurt San Francisco Zurich
11 Paris Dubai Paris Geneva Dubai San Francisco Luxembourg San Francisco
Washington
12 Tokyo San Francisco Seoul Frankfurt Los Angeles Los Angeles Seoul
DC
13 Wellington Chicago Sydney Los Angeles San Francisco Guangzhou Boston Tokyo
14 Los Angeles Zurich Dubai Dubai Vancouver Dubai Los Angeles Shenzhen
Washington
15 Chicago Frankfurt Toronto Munich Qingdao Chicago Vancouver
DC
“Abu Dhabi is strategically located between the Asian and
Western time zones. Truly situated right in the heart of the
global economy and trade flows.”
ASSOCIATE DIRECTOR, FINANCIAL CENTRE AGENCY, ABU DHABI
11The Global Financial Centres Index 30
Profile Of Strengths
We can use the sub-indices by areas of competitiveness and industry sector to show the relative
strengths of a financial centre over time, as shown in charts 4 to 7 below for New York and Toronto.
We also show a comparison with GFCI 24 - which provides a reasonable comparison over three years.
Taking New York’s results, the diagrams show that in the areas of competitiveness sub-indices, New
York scores first in all areas, and has improved its rank position over time in Human Capital and
Business Environment. By industry sector, New York’s reputation has improved in relation to those
working in the banking, investment management, and from a government & regulatory background. It
has lost ground among those working in insurance.
Chart 4 | Areas Of Competitiveness Rank - New York
Chart 5 | Industry Sectors Rank - New York
12The Global Financial Centres Index 30
Turning to Toronto, the range of rankings for areas of competitiveness is much wider, with reputation
and business environment scoring better than other areas. Over time, Toronto has improved in
reputation, but worsened in other areas. Looking at industry sectors, Toronto scores highly when
considered by those working in professional services, but is scored lower by those working in other
sectors.
Chart 6 | Areas Of Competitiveness Rank - Toronto
Chart 7 | Industry Sectors Rank - Toronto
13The Global Financial Centres Index 30
Size Of Organisation
We have analysed how the leading centres in the index are viewed by respondents working for
organisations of different sizes. New York leads across respondents from all sizes of organisation other
than those with 50 to 100 staff, with London and Singapore taking second place in all other groups.
Chart 8 | GFCI 30 Average Assessments By Respondents’ Organisation Size (Number Of
Employees)
“The quality of life and the intangible benefits of living and
working in a city with excellent reputation is one of the
attractions for highly skilled workers, especially the young and
highly mobile skilled workers, with young children. They need
schools, hospitals, and entertainment, all in a safe and secure
city that is easy to reach from anywhere around the world.”
MANAGING PARTNER, LEGAL SERVICES FIRM, KIGALI
14The Global Financial Centres Index 30
Factors Affecting Competitiveness
The GFCI questionnaire asks respondents to indicate which factors of competitiveness they consider
the most important at this time. The number of times that each area was mentioned and the key issues
raised by respondents are shown in Table 6.
Table 6 | GFCI 30 Main Areas Of Competitiveness
Number Of
Area Of Competitiveness Main Issues
Mentions
The regulatory environment remains a vital element in the development of a
successful financial centre.
Regulation which is agile, and reduces corruption without stifling innovation
Business Environment 582
and development is strongly supported, as is greater transparency.
Predictability and consistency are important elements of a successful
regulatory regime.
Remote working has improved skill availability, as cross-border working has
been made easier.
The labour market needs to be flexible, allowing free movement and ease of
Human Capital 535
employment for talented staff.
Connectivity between financial centres and universities and research
institutions is seen as increasingly influential.
The shift to virtual working for many staff has highlighted the mportance of
digital infrastructure.
Infrastructure 485 The costs of access to ICT infrastructure are important.
It is essential to build transport networks and working environments which
cater to the social as well as business needs of people
Tax is viewed as a potential place of competitive advantage, although the
proposals for minimum tax rates may shift the game for some centres.
Taxation 540
Reasonable levels of taxation are seen as better for businesses. But the other
costs of business, such as regulatory costs, are also influential.
Reputation gives confidence to investors and is a leading factor when selecting
a financial centre.
Reputation 515
A city’s reputation is useful for attracting human capital to the centre,
particularly when coupled with good branding and marketing.
Remote working has become the norm in many places, making physical
proximity to customers less important.
Financial Sector Development 465 Business has changed permanently following covid-19, with a move to online
meetings, including for relationship building that would traditionally have
been managed face-to-face.
“As life gets more digital, access to clients and suppliers in
the financial centre remains important, but is not key
anymore. This holds particularly true for existing
relationships, but also relationship building will happen in a
more digitized world.”
DIRECTOR, FINTECH INVESTMENT FIRM, LONDON
15The Global Financial Centres Index 30
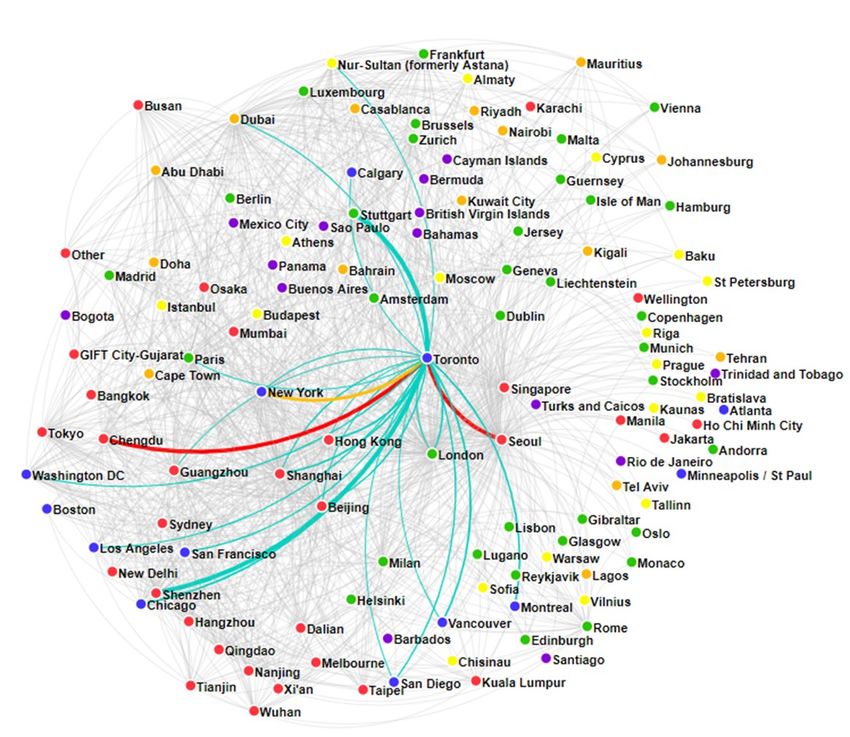
Control Of Corruption And Regulatory Quality
Reputational and Business Environment measures have a significant correlation with financial centre
competitiveness. Chart 9 plots GFCI ratings against the World Bank’s Control Of Corruption indicator
and Chart 10 plots GFCI ratings against the World Bank’s measure of Regulatory Quality. These charts
demonstrate the correlation of these factors with the GFCI 30 ratings (the size of the bubble indicates
the relative GDP of each centre).
Chart 9 | GFCI 30 Rating Against Control Of Corruption (Supplied By The World Bank)
Chart 10 | GFCI 30 Rating Against Regulatory Quality (Supplied By The World Bank)
16The Global Financial Centres Index 30
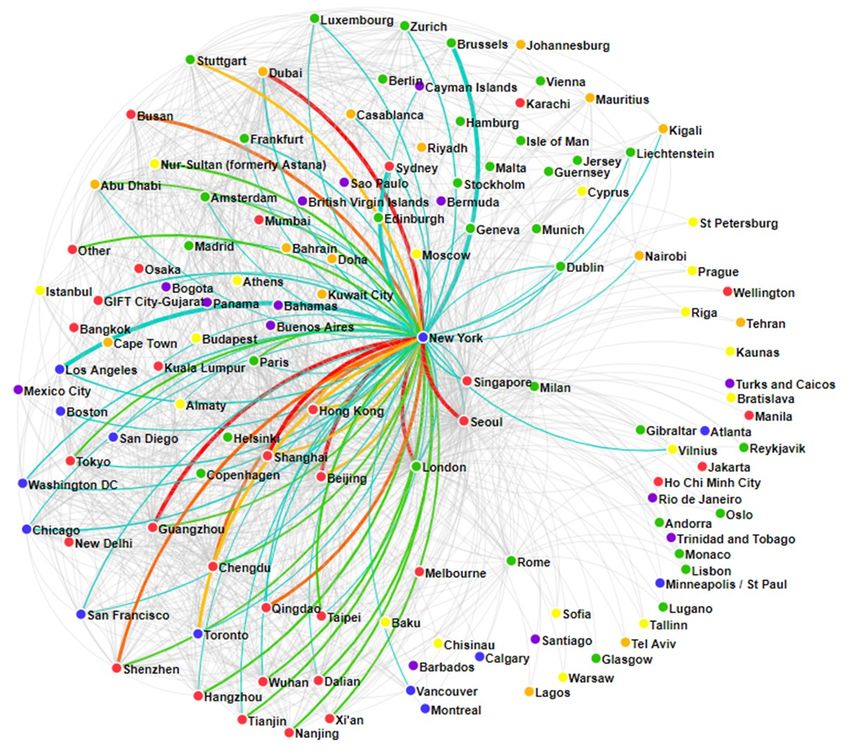
Connectivity
Financial centres thrive when they develop deep connections with other centres. The GFCI
allows us to measure connectivity by investigating the number of assessments given to and
received from other financial centres. Charts 11 and 12 show the different levels of
connectivity enjoyed by New York and Toronto to demonstrate the contrast, with New York
having connections with a wider spread of centres than Toronto. Both are well connected
with other North American centres; but new York is much better connected to the other
leading centres in the GFCI.
Chart 11 | GFCI 30 Connectivity - New York
Chart 12 | GFCI 30 Connectivity - Toronto
17The Global Financial Centres Index 30
Financial Centre Profiles Chart 13 | GFCI 30 Profile Elements
Using clustering and correlation analysis we have
identified three measures (axes) that determine a
financial centre’s profile along different dimensions
of competitiveness.
‘Connectivity’ – the extent to which a centre is well
connected around the world, based on the number
of assessments given by and received by that centre
from professionals based in other centres.
A centre’s connectivity is assessed using a combination of ‘inbound’ assessment locations (the number
of locations from which a particular centre receives assessments) and ‘outbound’ assessment locations
(the number of other centres assessed by respondents from a particular centre). If the weighted
assessments for a centre are provided by over 63% of other centres, this centre is deemed to be
‘Global’. If the ratings are provided by over 45% of other centres, this centre is deemed to be
‘International’.
‘Diversity’– the instrumental factors used in the GFCI model give an indication of a range of factors
that influence the richness and evenness of areas of competitiveness that characterise any particular
financial centre. We consider this span of factors to be measurable in a similar way to that of the
natural environment. We therefore use a combination of biodiversity indices (calculated on the
instrumental factors) to assess a centre’s diversity taking account of the range of factors against which
the centre has been assessed – the ‘richness’ of the centre’s business environment; and the ‘evenness’
of the distribution of that centre’s scores. A high score means that a centre is well diversified; a low
diversity score reflects a less rich business environment.
‘Speciality’ – the depth within a financial centre of the following industry sectors: investment
management, banking, insurance, professional services, and the government and regulatory
sector. A centre’s ‘speciality’ performance is calculated from the difference between the GFCI
rating and the industry sector ratings.
In Table 7, ‘Diversity’ (Breadth) and ‘Speciality’ (Depth) are combined on one axis to create a two
dimensional table of financial centre profiles. The 116 centres in GFCI 30 are assigned a profile on
the basis of a set of rules for the three measures: how well connected a centre is, how broad its
services are, and how specialised it is.
The 16 Global Leaders (in the top left of the table) have both broad and deep financial services
activities and are connected with many other financial centres. This list includes eight of the top 10
global financial centres in GFCI 30.
Significant changes in GFCI 30 include Toronto entering the Global Leaders list in this edition, with
Dubai, Luxembourg, Abu Dhabi, Hangzhou, and Tianjin moving to Global Specialist.
18The Global Financial Centres Index 30
Table 7 | GFCI 30 Financial Centre Profiles
Broad & Deep Relatively Broad Relatively Deep Emerging
Global Leaders Global Diversified Global Specialists Global Contenders
New York San Francisco* Dubai* GIFT City-Gujarat
London Seoul Beijing
Shanghai Dublin Luxembourg*
Zurich Guangzhou
Paris Shenzhen
Hong Kong Moscow
Washington DC Abu Dhabi*
Frankfurt Chengdu
Global Singapore Hangzhou*
Los Angeles Qingdao
Chicago Tianjin*
Amsterdam
Geneva
Brussels
Tokyo
Toronto*
Established
International Diversified International Specialists International Contenders
International
Boston Istanbul Mumbai* Sao Paulo*
Busan Mexico City New Delhi* Mauritius
Milan Tel Aviv* Wuhan* Nur-Sultan*
Berlin* Cape Town* Bahrain*
Oslo* Dalian* Casablanca
Bangkok* Panama Doha
Madrid Bogota Johannesburg*
Munich Cyprus Almaty*
International Warsaw* Riyadh* Guernsey
Sydney Riga* Bermuda
Kuala Lumpur Baku* Liechtenstein*
Vancouver* Taipei Isle of Man*
Melbourne Xi'an* British Virgin Islands*
Rome Nanjing Cayman Islands*
Montreal* Vilnius
Stuttgart Kigali (New)
Budapest Buenos Aires*
Hamburg* Nairobi*
Athens Lagos (New)
Established Players Local Diversified Local Specialists Evolving Centres
Copenhagen Vienna* Kuwait City Rio de Janeiro
Prague* Lisbon* Reykjavik* Malta
Calgary* Helsinki Manila Jersey*
Stockholm Tehran Jakarta
Edinburgh St Petersburg
Osaka Gibraltar
Local Glasgow* Barbados
Wellington* Bahamas*
San Diego Sofia
Santiago Tallinn
Bratislava
Monaco
Trinidad and Tobago*
An asterisk denotes cities that have moved between categories between GFCI 29 and GFCI 30
19The Global Financial Centres Index 30
The GFCI 30 World
106
51 See Detailed
28
27
19 Map Below
5 12
11
1
7
15
70 92 53
99
59
80
87
90
104
100 102
103
69
86
62
81
97
The numbers on the map indicate the GFCI 30 rankings.
Broad and Deep Relatively Broad Relatively Deep Emerging
Global Leaders Global Diversified Global Specialists Global Contenders
Established International International Diversified International Specialists International Contenders
Established Players Local Diversified Local Specialists Evolving Centres
Associate Centre
20The Global Financial Centres Index 30
110
50
75
83 112 13
61 105 8
9
115 38 111 33
77 109
49 37 116 6 46
108 114
71 32 113
68 18 55 16 67
76
101 36 3
54 58
95
48
94 98 4
66
73
64
25
29
35
43
42
74
26
96
34
65 22 91
93 17 30 60
41 2 31 56
40
14
57 63
82 23
39 79
10
21 44 89
72
20
45
78 84
47
24
52 88
107
85
21The Global Financial Centres Index 30
Regional Analysis
In our analysis of the GFCI data, we look at six regions of the world to explore the competitiveness of
their financial centres. Alongside the ranks and ratings of centres, we look at trends in the leading
centres in each region and investigate the average assessments received by regions and centres in
more detail.
We display this analysis in charts which show:
• the mean assessment provided to that region or centre;
• the difference in the mean assessment when home region assessments are removed from the
analysis;
• the difference between the mean and the assessments provided by other regions;
• the proportion of assessments provided by each region.
Charts 14 and 15 show examples of these analyses. Coloured bars to the left of the vertical axis
indicate that respondents from that region gave lower than the average assessments. Bars to the right
indicate respondents from that region gave higher than average assessments. It is important to
recognise that assessments given to a centre by people based in that centre are excluded to remove
‘home’ bias.
The additional vertical axis (in red) shows the mean of assessments when assessments from the
home region are removed. The percentage figure noted by each region indicates the percentage of
the total number of assessments that are from that region.
“City reputation is important - reputation is not solely about
the reputation of the government or authorities, but the
professionals who are regularly in touch with investors play a
major role in the country's perception with foreign investors.”
CO-FOUNDING PARTNER, PROFESSIONAL SERVICES FIRM, MALTA
22The Global Financial Centres Index 30
Chart 14 | Example 1: Assessments Compared With The Mean For Region 6
This line shows that the assessments
given by other regions and excluding
those from region 6 had an average 10
points lower than the overall mean.
Respondents from region 6 rated their
home centres higher than
respondents from other regions.
This percentage shows
This bar shows that that 32 per cent of
assessments from assessments for region
centres in this region 6 came from centres in
Region 1 (32%)
averaged 41 points region 1.
below the mean for Region 2 (24%)
region 6.
Region 3 (7%)
Region 4 (5%)
Region 5 (9%) This bar shows that
assessments from centres in
Region 6 (15%) this region averaged 72
points above the mean for
Multi-Regional (8%) region 6.
-125 -75 -25 623 25 75 125
This figure is the mean of all
assessments in the GFCI for
region 6.
Chart 15 | Example 2: Assessments Compared With The Mean For An Individual Centre
23The Global Financial Centres Index 30
Western Europe
London held onto second place in the index, with its rating dropping only 3 points, following larger
falls in GFCI 29. Paris moved up ranking places to take second place in the region. Assessments
provided by people in other regions were lowest from North America, with other regions generally
scoring Western European centres evenly.
Table 8 | Western European Top 15 Centres In GFCI 30
GFCI 30 GFCI 29 Change In Change In
Centre
Rank Rating Rank Rating Rank Rating
London 2 740 2 743 0 ▼3
Paris 10 705 25 699 ▲15 ▲6
Frankfurt 14 701 9 727 ▼5 ▼26
Amsterdam 17 698 28 695 ▲11 ▲3
Geneva 20 692 20 709 0 ▼17
Zurich 21 690 10 720 ▼11 ▼30
Edinburgh 22 689 21 708 ▼1 ▼19
Luxembourg 23 688 17 712 ▼6 ▼24
Madrid 24 687 33 683 ▲9 ▲4
Stockholm 26 685 31 688 ▲5 ▼3
Hamburg 30 679 43 664 ▲13 ▲15
Munich 31 678 49 647 ▲18 ▲31
Copenhagen 34 674 34 680 0 ▼6
Stuttgart 39 667 30 689 ▼9 ▼22
Brussels 40 666 37 676 ▼3 ▼10
Chart 16 | Top Five Western European Centres Over Time
24The Global Financial Centres Index 30
Chart 17 | Assessments By Region For Western Europe – Difference From The Overall Mean
Chart 18 | Assessments By Region For London - Difference From The Overall Mean
Chart 19 | Assessments By Region For Paris - Difference From The Overall Mean
Chart 20 | Assessments By Region For Frankfurt - Difference From The Overall Mean
25The Global Financial Centres Index 30
Asia/Pacific
Asia/Pacific generally fell in the ratings in GFCI 30. While Hong Kong and Singapore ranked well, many
centres in the region fell in the rankings. Seoul moved up to 13th position, with Busan, Wellington and
Qingdao also rising in the rankings. Those in North America, the Middle East & Africa, and Latin
America & The Caribbean rated Asia/Pacific centres lower than average.
Table 9 | Asia/Pacific Top 15 Centres In GFCI 30
GFCI 30 GFCI 29 Change In Change In
Centre
Rank Rating Rank Rating Rank Rating
Hong Kong 3 716 4 741 ▲1 ▼25
Singapore 4 715 5 740 ▲1 ▼25
Shanghai 6 713 3 742 ▼3 ▼29
Beijing 8 711 6 737 ▼2 ▼26
Tokyo 9 706 7 736 ▼2 ▼30
Seoul 13 702 16 713 ▲3 ▼11
Shenzhen 16 699 8 731 ▼8 ▼32
Sydney 25 686 18 711 ▼7 ▼25
Melbourne 29 680 23 705 ▼6 ▼25
Guangzhou 32 677 22 706 ▼10 ▼29
Busan 33 675 36 677 ▲3 ▼2
Wellington 35 673 46 660 ▲11 ▲13
Chengdu 37 670 35 678 ▼2 ▼8
Qingdao 38 668 42 665 ▲4 ▲3
Osaka 46 655 32 684 ▼14 ▼29
Chart 21 | Top Five Asia/Pacific Centres Over Time
26The Global Financial Centres Index 30
Chart 22 | Assessments By Region For Asia/Pacific – Difference From The Overall Mean
Chart 23 | Assessments By Region For Hong Kong - Difference From The Overall Mean
Chart 24 | Assessments By Region For Singapore - Difference From The Overall Mean
Chart 25 | Assessments By Region For Shanghai - Difference From The Overall Mean
27The Global Financial Centres Index 30
North America
North American centres performed well, with New York leading the index, and San Francisco and Los
Angeles making the top 10. Six centres in total improved their ranking. Assessments of North American
centres from people in the Asia/Pacific region were above the global average, while assessments from
other regions were lower.
Table 10 | North American Centres In GFCI 30
GFCI 30 GFCI 29 Change In Change In
Centre
Rank Rating Rank Rating Rank Rating
New York 1 762 1 764 0 ▼2
San Francisco 5 714 12 718 ▲7 ▼4
Los Angeles 7 712 13 716 ▲6 ▼4
Chicago 11 704 15 714 ▲4 ▼10
Boston 12 703 24 703 ▲12 0
Washington DC 15 700 14 715 ▼1 ▼15
Toronto 19 693 29 694 ▲10 ▼1
Montreal 27 682 27 696 0 ▼14
Vancouver 28 681 11 719 ▼17 ▼38
Calgary 51 637 71 593 ▲20 ▲44
San Diego 70 588 44 663 ▼26 ▼75
Chart 26 | Top Five North American Centres Over Time
28The Global Financial Centres Index 30
Chart 27 | Assessments By Region For North America – Difference From The Overall Mean
Chart 28 | Assessments By Region For New York - Difference From The Overall Mean
Chart 29 | Assessments By Region for San Francisco - Difference From The Overall Mean
Chart 30 | Assessments By Region For Los Angeles - Difference From The Overall Mean
29The Global Financial Centres Index 30
Eastern Europe & Central Asia
This region performed strongly in GFCI 30 after dips in ratings in the last two editions of the index.
Moscow has extended its lead in the region, and eight centres improved more than 10 places in
the rankings. Asia/Pacific assessments along with those from the local region were above the
global average.
Table 11 | Eastern European & Central Asian Centres In GFCI 30
GFCI 30 GFCI 29 Change In Change In
Centre
Rank Rating Rank Rating Rank Rating
Moscow 50 638 57 615 ▲7 ▲23
Warsaw 56 624 61 607 ▲5 ▲17
Istanbul 61 615 74 590 ▲13 ▲25
Prague 63 611 76 588 ▲13 ▲23
Tallinn 74 570 87 575 ▲13 ▼5
Nur-Sultan 75 569 78 586 ▲3 ▼17
Cyprus 77 566 98 561 ▲21 ▲5
Bratislava 79 564 66 598 ▼13 ▼34
Almaty 83 559 101 553 ▲18 ▲6
Sofia 84 558 95 565 ▲11 ▼7
Athens 88 554 103 545 ▲15 ▲9
Budapest 89 553 85 577 ▼4 ▼24
Vilnius 91 551 62 606 ▼29 ▼55
Riga 96 546 109 493 ▲13 ▲53
Baku 105 531 107 515 ▲2 ▲16
St Petersburg 110 502 88 574 ▼22 ▼72
Chart 31 | Top Five Eastern European & Central Asian Centres Over Time
30The Global Financial Centres Index 30
Chart 32 | Assessments By Region For Eastern Europe & Central Asia - Difference From The
Overall Mean
Chart 33 | Assessments By Region For Moscow - Difference From The Overall Mean
Chart 34 | Assessments By Region For Warsaw - Difference From The Overall Mean
Chart 35 | Assessments By Region For Istanbul - Difference From The Overall Mean
31The Global Financial Centres Index 30
The Middle East & Africa
There was a balance of results in this region, with seven centres improving their ranking, while
over half of the regional centres dropped in the ratings. Dubai and Abu Dhabi continue to lead the
table in the region and Casablanca continues to take first place in Africa. South African centres saw
the largest improvements. Kigali and Lagos joined the index for the first time.
Table 12 | Middle Eastern & African Centres In GFCI 30
GFCI 30 GFCI 29 Change In Change In
Centre
Rank Rating Rank Rating Rank Rating
Dubai 18 694 19 710 ▲1 ▼16
Abu Dhabi 36 672 38 675 ▲2 ▼3
Tel Aviv 49 645 41 666 ▼8 ▼21
Casablanca 53 628 53 632 0 ▼4
Cape Town 62 614 82 582 ▲20 ▲32
Johannesburg 64 609 90 572 ▲26 ▲37
Doha 68 600 55 628 ▼13 ▼28
Bahrain 71 578 68 596 ▼3 ▼18
Mauritius 73 575 89 573 ▲16 ▲2
Kigali 94 548 New New New New
Nairobi 98 541 106 520 ▲8 ▲21
Riyadh 101 538 105 541 ▲4 ▼3
Lagos 102 536 New New New New
Kuwait City 108 523 83 581 ▼25 ▼58
Tehran 109 511 96 564 ▼13 ▼53
Chart 36 | Top Five Middle East & African Centres Over Time
32The Global Financial Centres Index 30
Chart 37 | Assessments By Region For The Middle East & Africa — Difference From The Overall
Mean
Chart 38 | Assessments By Region For Dubai - Difference From The Overall Mean
Chart 39 | Assessments By Region For Abu Dhabi - Difference From The Overall Mean
Chart 40 | Assessments By Region For Tel Aviv - Difference From The Overall Mean
33The Global Financial Centres Index 30
Latin America & The Caribbean
After seeing improvements in GFCI 28 and GFCI 29, centres in Latin America & The Caribbean
generally fell back in GFCI 30, with 10 centres falling in the rankings. Mexico City, Rio de Janeiro,
and Sao Paulo were the exceptions, each rising in both ranks and ratings. Assessments of centres in
the region from others in Latin America & The Caribbean were lower than the global average.
Table 13 | Latin American & Caribbean Centres In GFCI 30
GFCI 30 GFCI 29 Change In Change In
Centre
Rank Rating Rank Rating Rank Rating
Mexico City 59 617 69 595 ▲10 ▲22
Rio de Janeiro 69 595 77 587 ▲8 ▲8
Cayman Islands 80 563 72 592 ▼8 ▼29
Santiago 81 561 67 597 ▼14 ▼36
Sao Paulo 86 556 104 542 ▲18 ▲14
British Virgin Islands 87 555 58 614 ▼29 ▼59
Barbados 90 552 64 600 ▼26 ▼48
Bermuda 92 550 84 580 ▼8 ▼30
Buenos Aires 97 545 91 571 ▼6 ▼26
Bahamas 99 540 73 591 ▼26 ▼51
Trinidad and Tobago 100 539 97 563 ▼3 ▼24
Bogota 103 535 100 554 ▼3 ▼19
Panama 104 532 94 566 ▼10 ▼34
Chart 41 | Top Five Latin American & Caribbean Centres Over Time
34The Global Financial Centres Index 30
Chart 42 | Assessments By Region For Latin America & The Caribbean – Difference From The Overall
Mean
Chart 43 | Assessments By Region For Mexico City - Difference From The Overall Mean
Chart 44 | Assessments By Region For Rio de Janeiro - Difference From The Overall Mean
Chart 45 | Assessments By Region For Cayman Islands - Difference From The Overall Mean
35The Global Financial Centres Index 30
Home Centre Prospects
While the GFCI is calculated using only assessments from other centres, we ask respondents about
the prospects of the centre in which they are based; and specifically whether their ‘home’ centre will
become more or less competitive.
In general, people are more optimistic about the future of their own centre than people outside that
centre. In London, there is a split of opinion, with a greater proportion of people than in other
centres very confident about future competitiveness, and similarly a greater proportion thinking that
London will become a little less competitive, continuing to reflect uncertainty about the impact of
future trading relations with the European Union and the rest of the world.
Chart 46 | Home Centre Prospects - Chart 47 | Home Centre Prospects -
New York London
Chart 48 | Home Centre Prospects - Chart 49 | Home Centre Prospects -
Hong Kong Singapore
36The Global Financial Centres Index 30
Stability
Chart 50 contrasts the ‘spread’ or variance of the individual assessments given to each of the top 40
centres with the sensitivity to changes in the instrumental factors.
The chart shows three bands of financial centres. The unpredictable centres in the top right of the
chart have a higher sensitivity to changes in the instrumental factors and a higher variance of
assessments. These centres have the highest potential future movement. The stable centres in the
bottom left have a lower sensitivity to changes in the instrumental factors and a lower variance of
assessments.
We have only plotted the top 40 centres (for clarity) but it is worth noting that most of the centres
lower in the index would be in the dynamic and unpredictable areas of the chart if plotted.
Chart 50 | Stability Of The Top 40 Centres In GFCI 30
37The Global Financial Centres Index 30
In addition, we look at the stability of rankings in the index over time. Chart 51 shows the standard
deviation of index rankings against the variance in assessments over the last 24 months. Some of the
centres in the dynamic or unpredictable table area in the most recent analysis in Chart 50 move into
the stable area when their rankings and assessments are considered over time, for example, London,
Luxembourg, Zurich, and Frankfurt.
Chart 51 | Standard Deviation In Index Rankings And Assessments Over Time
“Taxation goes hand in hand with the quality of public
services and must not be looked at in isolation. High tax
countries with a strong social system and excellent quality
public services create a healthier environment for enterprise
than a low tax country with poor public services and no
social system.”
BUSINESS RISK MANAGER, PRIVATE BANK, GENEVA
38The Global Financial Centres Index 30
Reputation
We look at reputation in the GFCI model by examining the difference between the weighted average
assessment given to a financial centre and the overall rating in the index.
The first measure reflects the average score a centre receives from financial professionals across the
world, adjusted for time, with more recent assessments given more weight (see Appendix 3 for
details).
The second measure is the GFCI rating itself, which represents the assessments adjusted to take
account of the instrumental factors. If a centre has a higher average assessment than its GFCI rating,
this indicates that respondents’ perceptions of a centre are more favourable than the quantitative
measures alone suggest.
Table 14 shows the top 15 centres with the greatest positive difference between the average
assessment and the GFCI rating. Six of the top 15 centres in terms of reputational advantage are in
the Asia/Pacific region (nine in GFCI 29). Alongside New York and London, a number of Western
European centres feature in the list. This may be due to strong marketing, or awareness of a centre’s
existing or emerging strengths.
‘Reputational advantage’ can become a weakness. These centres need to support their successful
marketing with genuine improvements in their underlying competitiveness. GIFT City-Gujarat and
Qingdao stand out as needing to address this issue.
Table 14 | GFCI 30 Top 15 Centres Assessments And Ratings — Reputational Advantage
Weighted Average GFCI 30 Reputational
Centre GFCI 30 Rating
Assessment Advantage
GIFT City-Gujarat 899 568 331
Qingdao 858 668 190
Kigali 661 548 113
Shenzhen 800 699 101
Nur-Sultan 668 569 99
Singapore 812 715 97
Guangzhou 753 677 76
Stuttgart 739 667 72
Zurich 759 690 69
Luxembourg 755 688 67
Shanghai 779 713 66
London 805 740 65
Berlin 680 616 64
St Petersburg 563 502 61
New York 818 762 56
39The Global Financial Centres Index 30
Table 15 shows the 15 centres with the greatest reputational disadvantage. This indicates that
respondents’ perceptions of a centre are less favourable than the quantitative measures alone would
suggest. The centres featured might benefit from a stronger marketing effort as well as tackling some
core issues relating to the centre.
Table 15 | GFCI 30 Bottom 15 Centres Assessments And Ratings — Reputational Disadvantage
Weighted Average GFCI 30 Reputational
Centre GFCI 30 Rating
Assessment Advantage
Moscow 585 638 -53
Istanbul 561 615 -54
Mexico City 561 617 -56
Warsaw 562 624 -62
Vienna 596 659 -63
Helsinki 596 662 -66
Johannesburg 542 609 -67
Oslo 593 663 -70
Rio de Janeiro 519 595 -76
Mumbai 540 627 -87
Jakarta 519 607 -88
Hamburg 582 679 -97
Wellington 565 673 -108
Calgary 515 637 -122
New Delhi 480 625 -145
“ Having a legal system that protects IP and property while
guarding against abuse and corruption is important to foster
innovation and help entrepreneurs build sustainable world-
class businesses. Right-sized, well planned and adaptable
regulation that's pragmatic and not zealous fosters
innovation and the UK Financial Conduct Authority is world
leading in this regard with its sandbox.”
SENIOR BUSINESS DEVELOPMENT MANAGER, STOCK EXCHANGE, LONDON
40The Global Financial Centres Index 30
Cities As Desirable Places To Live And Work
We asked survey respondents to give a view as to where in the world they would like to work if they
needed to live and work in a different city. The table below lists those cities mentioned more than 20
times by respondents.
New York heads the list, with five other US centres in the list. Other leading centres are included in the
list, with nine of the top 10 centres in GFCI 30 making the count. Busan and Seoul feature, as do Abu
Dhabi and Dubai. In Western Europe, London, Amsterdam, and Berlin feature. Among centres ranked
lower in the GFCI, Casablanca and Bangkok are included in this list.
Table 16 | Financial Centres Listed As Attractive Alternative Places To Live And Work
Centre Count
New York 236
Busan 99
Hong Kong 97
London 81
Beijing 67
Abu Dhabi 66
Singapore 64
Seoul 49
Dubai 44
Tokyo 44
Washington DC 42
Bangkok 33
San Francisco 32
Amsterdam 31
Casablanca 31
Boston 30
Los Angeles 28
Shanghai 27
Berlin 25
Chicago 24
41The Global Financial Centres Index 30
The reasons given by respondents for their choice were varied, but certain themes were repeated by
many respondents.
• The depth and breadth of the financial services represented in the city. This is particularly true of
New York, London, Hong Kong, and Singapore. Respondents saw the potential for opportunity in
places with large, well-established markets.
• The perception that financial services was well-regulated in the centre was cited by many
respondents, showing the continuing importance of the regulatory environment.
• The reputation of a centre as a FinTech and innovation hub, which was important to many
respondents.
• Ease of doing business, with Dubai and Abu Dhabi frequently mentioned in this area.
• Salaries and tax rates, with large centres offering opportunities for building a career.
• The potential for further market development, particularly in Casablanca and other African centres.
• Lifestyle reasons, including culture, safety, attractiveness, and freedom.
“London is highly professional, excellent reputation, a major
FinTech innovation centre and has an excellent
FinTech ecosystem.”
CO-FOUNDER, FINTECH FIRM, LONDON
42The Global Financial Centres Index 30
FinTech
Alongside the main GFCI index, we analyse financial centres in terms of their FinTech offering. Table 17
shows the centres that received sufficient assessments to feature in the Fintech index, together with
the change in their rank and ratings since GFCI 29. Chinese and US centres continue to feature
strongly, reflecting their focus on technology development, with most leading Chinese centres ranking
higher for FinTech then in the main index. In the top 40 places, most Western European centres have
gained in the FinTech rankings since GFCI 29.
Table 17 | GFCI 30 FinTech Ranks And Ratings - Top 50 Centres
GFCI 30 GFCI 29
Centre Change In Rank Change In Rating
FinTech Rank FinTech Rating FinTech Rank FinTech Rating
New York 1 723 1 731 0 ▼8
Shanghai 2 695 2 722 0 ▼27
London 3 694 5 712 ▲2 ▼18
San Francisco 4 693 9 691 ▲5 ▲2
Beijing 5 692 3 719 ▼2 ▼27
Los Angeles 6 689 8 692 ▲2 ▼3
Shenzhen 7 686 4 716 ▼3 ▼30
Hong Kong 8 679 6 711 ▼2 ▼32
Washington DC 9 678 12 681 ▲3 ▼3
Singapore 10 677 7 710 ▼3 ▼33
Seoul 11 676 13 679 ▲2 ▼3
Chicago 12 675 19 670 ▲7 ▲5
Guangzhou 13 674 11 684 ▼2 ▼10
Boston 14 673 18 674 ▲4 ▼1
Paris 15 661 17 675 ▲2 ▼14
Tokyo 16 651 16 676 0 ▼25
Frankfurt 17 649 20 669 ▲3 ▼20
Amsterdam 18 648 23 666 ▲5 ▼18
Toronto 19 645 22 667 ▲3 ▼22
Sydney 20 643 15 677 ▼5 ▼34
Edinburgh 21 642 39 635 ▲18 ▲7
Busan 22 641 27 662 ▲5 ▼21
Stockholm 23 639 31 654 ▲8 ▼15
Madrid 24 638 51 609 ▲27 ▲29
Vancouver 25 637 14 678 ▼11 ▼41
Qingdao 26 635 30 659 ▲4 ▼24
Melbourne 27 634 36 646 ▲9 ▼12
Dubai 28 633 24 665 ▼4 ▼32
Kuala Lumpur 29 632 58 586 ▲29 ▲46
Zurich 30 629 21 668 ▼9 ▼39
Brussels 31 628 38 642 ▲7 ▼14
Oslo 32 627 48 619 ▲16 ▲8
Abu Dhabi 33 626 29 660 ▼4 ▼34
Hamburg 34 625 45 624 ▲11 ▲1
Geneva 35 624 26 663 ▼9 ▼39
Rome 36 623 50 615 ▲14 ▲8
Milan 37 622 34 648 ▼3 ▼26
Munich 38 621 49 616 ▲11 ▲5
Copenhagen 39 620 37 643 ▼2 ▼23
Montreal 40 619 33 649 ▼7 ▼30
Moscow 41 618 52 608 ▲11 ▲10
Bangkok 42 615 57 587 ▲15 ▲28
Taipei 43 614 35 647 ▼8 ▼33
Mumbai 44 613 55 594 ▲11 ▲19
Mexico City 45 612 64 579 ▲19 ▲33
Vienna 46 611 66 577 ▲20 ▲34
Calgary 47 610 72 570 ▲25 ▲40
New Delhi 48 609 59 584 ▲11 ▲25
Dublin 49 608 40 633 ▼9 ▼25
Osaka 50 607 41 631 ▼9 ▼24
43The Global Financial Centres Index 30
Table 17 (Continued) | GFCI 30 FinTech Ranks And Ratings - Remaining Centres
GFCI 30 GFCI 29
Centre Change In Rank Change In Rating
FinTech Rank FinTech Rating FinTech Rank FinTech Rating
Istanbul 51 606 65 578 ▲14 ▲28
Helsinki 52 605 46 621 ▼6 ▼16
Jakarta 53 604 91 528 ▲38 ▲76
Warsaw 54 603 New New New New
Luxembourg 55 602 42 630 ▼13 ▼28
Tel Aviv 56 601 10 688 ▼46 ▼87
Cape Town 57 600 61 582 ▲4 ▲18
Lisbon 58 599 44 627 ▼14 ▼28
Berlin 59 598 43 629 ▼16 ▼31
Chengdu 60 597 25 664 ▼35 ▼67
Johannesburg 61 596 87 541 ▲26 ▲55
Stuttgart 62 594 47 620 ▼15 ▼26
Rio de Janeiro 63 593 70 572 ▲7 ▲21
Prague 64 591 69 574 ▲5 ▲17
Sao Paulo 65 589 90 531 ▲25 ▲58
Doha 66 575 56 591 ▼10 ▼16
GIFT City-Gujarat 67 571 62 581 ▼5 ▼10
Athens 68 568 89 533 ▲21 ▲35
Buenos Aires 69 567 71 571 ▲2 ▼4
Santiago 70 566 54 595 ▼16 ▼29
Almaty 71 565 88 535 ▲17 ▲30
San Diego 72 564 28 661 ▼44 ▼97
Tianjin 73 561 100 512 ▲27 ▲49
Tallinn 74 560 68 575 ▼6 ▼15
Manila 75 559 53 599 ▼22 ▼40
Sofia 76 558 85 545 ▲9 ▲13
Hangzhou 77 557 97 516 ▲20 ▲41
Bahrain 78 555 75 562 ▼3 ▼7
Budapest 79 552 77 560 ▼2 ▼8
Riyadh 80 551 92 527 ▲12 ▲24
Casablanca 81 550 80 555 ▼1 ▼5
Monaco 82 548 60 583 ▼22 ▼35
Vilnius 83 547 32 650 ▼51 ▼103
Mauritius 84 546 93 526 ▲9 ▲20
Dalian 85 545 99 514 ▲14 ▲31
Bogota 86 544 74 567 ▼12 ▼23
Riga 87 543 101 509 ▲14 ▲34
Cyprus 88 541 102 504 ▲14 ▲37
Nur-Sultan 89 540 98 515 ▲9 ▲25
Nairobi 90 538 New New New New
Kigali 91 537 New New New New
Liechtenstein 92 536 67 576 ▼25 ▼40
Nanjing 93 534 104 497 ▲11 ▲37
Malta 94 533 76 561 ▼18 ▼28
Lagos 95 532 New New New New
Xi'an 96 531 103 501 ▲7 ▲30
Baku 97 527 94 525 ▼3 ▲2
Tehran 98 524 73 569 ▼25 ▼45
St Petersburg 99 522 83 547 ▼16 ▼25
Panama 100 516 81 554 ▼19 ▼38
Bahamas 101 515 82 550 ▼19 ▼35
Kuwait City 102 514 78 559 ▼24 ▼45
British Virgin Islands 103 513 86 544 ▼17 ▼31
Jersey 104 512 63 580 ▼41 ▼68
Wuhan 105 506 105 471 0 ▲35
Isle of Man 106 504 79 556 ▼27 ▼52
Guernsey 107 502 95 522 ▼12 ▼20
Bermuda 108 477 84 546 ▼24 ▼69
Cayman Islands 109 473 96 520 ▼13 ▼47
44The Global Financial Centres Index 30
We asked survey respondents to identify:
• The four most important elements in generating a competitive environment for FinTech providers
and
• The most important areas of current FinTech activity.
Charts 52 and 53 show the results, with Access To Finance and ICT Infrastructure seen as the leading
elements. Big Data Analytics and Payment Transaction Systems were once again identified as the most
important areas of Fintech activity.
Chart 52| Most Important Elements In Generating A Competitive Environment For FinTech
Providers
Chart 53 | Most Important Areas Of FinTech Activity
45The Global Financial Centres Index 30
Appendix 1: Assessment Details
Table 18 | GFCI 30 Details Of Assessments By Centre
GFCI 30 Assessments GFCI 30 Assessments
Centre St. Centre St.
Rank Rating Number Average Rank Rating Number Average
Dev Dev
New York 1 762 4,948 819 183 Istanbul 61 615 668 560 191
London 2 740 2,892 807 171 Cape Town 62 614 312 580 200
Hong Kong 3 716 3,642 767 193 Prague 63 611 351 586 201
Singapore 4 715 1,898 813 156 Johannesburg 64 609 298 538 212
San Francisco 5 714 758 741 190 Glasgow 65 608 118 618 235
Shanghai 6 713 2,328 781 188 Jakarta 66 607 216 518 212
Los Angeles 7 712 1,410 713 206 Taipei 67 604 638 645 191
Beijing 8 711 2,392 760 208 Doha 68 600 619 607 206
Tokyo 9 706 2,175 705 217 Rio de Janeiro 69 595 304 520 208
Paris 10 705 1,456 713 186 San Diego 70 588 251 611 229
Chicago 11 704 1,005 718 190 Bahrain 71 578 346 555 236
Boston 12 703 882 679 229 Liechtenstein 72 577 223 607 242
Seoul 13 702 559 750 191 Mauritius 73 575 265 573 222
Frankfurt 14 701 990 730 202 Tallinn 74 570 198 544 238
Washington DC 15 700 1,071 742 200 Nur-Sultan 75 569 368 654 216
Shenzhen 16 699 1,263 800 177 GIFT City-
76 568 612 903 224
Amsterdam 17 698 777 705 196 Gujarat
Dubai 18 694 2,321 713 201 Cyprus 77 566 267 524 219
Toronto 19 693 602 711 195 Monaco 78 565 310 602 216
Geneva 20 692 635 727 180 Bratislava 79 564 124 577 210
Zurich 21 690 780 759 181 Cayman Islands 80 563 429 600 244
Edinburgh 22 689 282 682 190
Santiago 81 561 396 583 198
Luxembourg 23 688 684 755 170
Guernsey 82 560 215 583 239
Madrid 24 687 404 650 186
Almaty 83 559 260 537 250
Sydney 25 686 633 722 190
Sofia 84 558 240 531 226
Stockholm 26 685 310 663 194
Malta 85 557 216 593 198
Montreal 27 682 281 634 213
Sao Paulo 86 556 513 552 198
Vancouver 28 681 344 673 203
British Virgin
Melbourne 29 680 238 701 195 87 555 448 582 235
Islands
Hamburg 30 679 305 581 229
Athens 88 554 285 520 231
Munich 31 678 416 662 189
Budapest 89 553 470 544 204
Guangzhou 32 677 1,535 767 204
Barbados 90 552 142 549 230
Busan 33 675 2,307 700 202
Vilnius 91 551 238 586 265
Copenhagen 34 674 282 652 217
Bermuda 92 550 326 547 238
Wellington 35 673 95 559 272
Isle of Man 93 549 237 587 229
Abu Dhabi 36 672 1,084 678 219
Kigali 94 548 203 662 221
Chengdu 37 670 1,716 668 298
Manila 95 547 243 593 213
Qingdao 38 668 1,309 858 152
Riga 96 546 218 524 213
Stuttgart 39 667 342 784 259
Buenos Aires 97 545 328 522 210
Brussels 40 666 434 640 205
Nairobi 98 541 249 527 207
Dublin 41 665 536 664 210
Bahamas 99 540 299 542 216
Oslo 42 663 241 588 242
Helsinki 43 662 194 600 203 Trinidad and
100 539 71 569 211
Tobago
Vienna 44 659 358 593 222
Riyadh 101 538 270 523 235
Milan 45 656 499 692 190
Lagos 102 536 210 502 210
Osaka 46 655 646 643 224
Bogota 103 535 322 526 221
Rome 47 654 654 670 206
Panama 104 532 412 536 228
Kuala Lumpur 48 649 296 616 185
Tel Aviv 49 645 268 607 244 Baku 105 531 226 502 224
Moscow 50 638 907 585 198 Reykjavik 106 528 99 537 270
Calgary 51 637 222 516 251 Gibraltar 107 524 134 549 250
Lisbon 52 636 264 611 182 Kuwait City 108 523 226 551 238
Casablanca 53 628 301 606 258 Tehran 109 511 265 528 227
Mumbai 54 627 402 543 265 St Petersburg 110 502 287 562 209
New Delhi 55 625 302 484 283 Hangzhou 111 489 1,039 477 239
Warsaw 56 624 181 571 192 Tianjin 112 480 898 438 202
Jersey 57 622 269 657 213 Dalian 113 470 945 434 199
Bangkok 58 621 463 594 200 Nanjing 114 462 920 444 196
Mexico City 59 617 737 562 203 Xi'an 115 451 670 427 202
Berlin 60 616 532 679 199 Wuhan 116 400 880 395 224
46You can also read