The merger-driven evolution of massive early-type galaxies
←
→
Page content transcription
If your browser does not render page correctly, please read the page content below
Galaxy evolution and feedback across different environments
                                              Proceedings IAU Symposium No. 359, 2020                     c 2020 International Astronomical Union
                                              T. Storchi-Bergmann, R. Overzier, W. Forman & R. Riffel, eds. DOI: 00.0000/X000000000000000X

                                                             The merger-driven evolution of
                                                              massive early-type galaxies
                                               Carlo Cannarozzo1,2 , Carlo Nipoti1 , Alessandro Sonnenfeld3 , Alexie
                                                 Leauthaud4 , Song Huang5 , Benedikt Diemer6 , Grecco Oyarzn4
                                                   1
                                                    Dipartimento di Fisica e Astronomia, Alma Mater Studiorum Universit di Bologna,
                                                                     Via Piero Gobetti 93/2, I-40129 Bologna, Italy
                                                                           email: carlo.cannarozzo3@unibo.it
                                                          2
                                                            INAF - Osservatorio di Astrofisica e Scienza dello Spazio di Bologna,
arXiv:2006.05427v1 [astro-ph.GA] 9 Jun 2020

                                                                     Via Piero Gobetti 93/3, I-40129 Bologna, Italy
                                                                         3
                                                                           Leiden Observatory, Leiden University,
                                                                   Niels Bohrweg 2, 2333 CA Leiden, The Netherlands
                                                   4
                                                     Department of Astronomy and Astrophysics, University of California, Santa Cruz,
                                                                     1156 High Street, Santa Cruz, CA 95064 USA
                                                              5
                                                                Department of Astrophysical Sciences, Princeton University,
                                                                          4 Ivy Lane, Princeton, NJ 08544, USA
                                                      6
                                                        NHFP Einstein Fellow, Department of Astronomy, University of Maryland,
                                                                              College Park, MD 20742, USA

                                              Abstract. The evolution of the structural and kinematic properties of early-type galaxies
                                              (ETGs), their scaling relations, as well as their stellar metallicity and age contain precious
                                              information on the assembly history of these systems. We present results on the evolution of
                                              the stellar mass-velocity dispersion relation of ETGs, focusing in particular on the effects of
                                              some selection criteria used to define ETGs. We also try to shed light on the role that in-situ
                                              and ex-situ stellar populations have in massive ETGs, providing a possible explanation of the
                                              observed metallicity distributions.
                                              Keywords. Galaxies: elliptical and lenticular, cD; galaxies: evolution; galaxies: formation;
                                              galaxies: kinematics and dynamics.

                                              1. Introduction
                                                 In the currently favoured model of galaxy formation, early-type galaxies (ETGs) are
                                              believed to assemble in two phases (Oser et al. 2010). The first phase (z & 2) is dominated
                                              by the in-situ star formation. Afterwards, as a consequence of mostly dissipationless
                                              minor and major mergers, ETGs accrete stars formed ex situ. This scenario leads to
                                              intriguing questions including how the properties of ETGs evolve across cosmic time,
                                              whether and to what extent mergers modify the scaling relations of these massive galaxies
                                              and shape the distribution of the stellar populations within them.
                                                 In this proceeding we present some aspects of the evolution of massive ETGs based on
                                              two different works. In section 2 we report the results on the M∗ -σe relation of ETGs ob-
                                              tained in Cannarozzo, Sonnenfeld & Nipoti (2020) (hereafter CSN), and study the effect
                                              of adopting two different selection criteria for ETGs. In section 3 we present preliminary
                                              results of a forthcoming paper (Cannarozzo et al. in preparation) aimed at studying the
                                              radial distributions of in-situ and ex-situ stellar components of massive ETGs.
                                                                                              1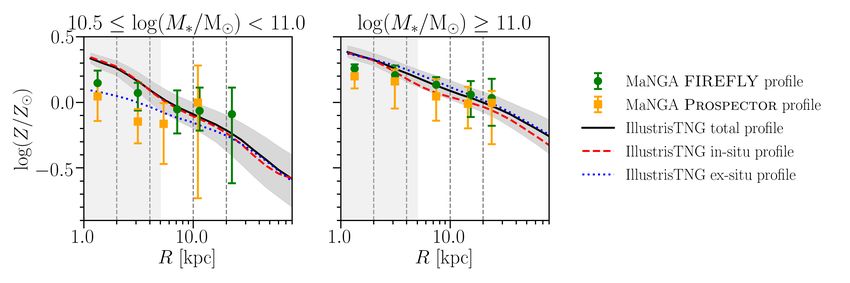
2 Carlo Cannarozzo et al.
2. The evolution of the stellar mass-velocity dispersion relation
The central stellar velocity dispersion σe of present-day ETGs is found to correlate with
their stellar mass M∗ . There are indications that this correlation evolves with redshift
in the sense that, at given M∗ , higher-z ETGs have, on average, higher σe (e.g., Tanaka
et al. 2019). However, the detailed evolution of the M∗ -σe relation is hard to determine,
because of the difficulty of measuring σe in large samples of ETGs at high z.
CSN studied the evolution of the M∗ -σe relation in massive (log(M∗ /M ) > 10.5)
ETGs in the redshift range 0 < z < 2.5, using a Bayesian hierarchical approach. CSN
considered a sample of galaxies composed by two main subsamples. The first subsample,
named fiducial sample, consists of ETGs in the redshift range 0 . z . 1 drawn from
the Sloan Digital Sky Survey (SDSS, Eisenstein et al. 2011) and the Large Early Galaxy
Astrophysics Census (LEGA-C, van der Wel et al. 2016; Straatman et al. 2018), homo-
geneously selected by performing a one-by-one visual inspection to include only objects
with elliptical morphology and by applying a cut in the equivalent width (EW) of the
emission line doublet [OII]λλ3726, 3729, EW([OII]) > −5. The second subsample, named
high-redshift sample, is a more heterogeneous collection of ETGs in the redshift range
0.8 . z . 2.5 from previous works in literature (see CSN and references therein). CSN
found that, for both the fiducial and the extended (fiducial + high-redshift) samples,
the M∗ -σe relation is well described by σe ∝ M∗β (1 + z)ζ with intrinsic scatter ' 0.08
dex in σe at given M∗ and either β ' 0.18 independent of z or redshift-dependent β
with dβ/d log(1 + z) ' 0.26 for the fiducial sample and ' 0.18 for the extended sample;
ζ, which measures the redshift dependence of σe at given M∗ , is ' 0.4 for the fiducial
sample (0 . z . 1) and ' 0.5 for the extended sample (0 . z . 2.5).
One of the properties of ETGs is to be passive and EW([OII]) is only one of the possible
diagnostics for the star formation rate. Another indicator is the position of galaxies within
the U V J colour-colour diagram, in which the loci of passive and star-forming galaxies
are separate (e.g., Cimatti, Fraternali & Nipoti 2019). For instance, Belli et al. (2014b),
from which part of the galaxies of the high-redshift sample are taken, select using a
U V J-based criterion. In principle, this different selection criterion can induce spurious
evolution when the extended sample is considered. Here we analyse the effect of adding
a U V J-based selection to the criteria used for the fiducial sample.
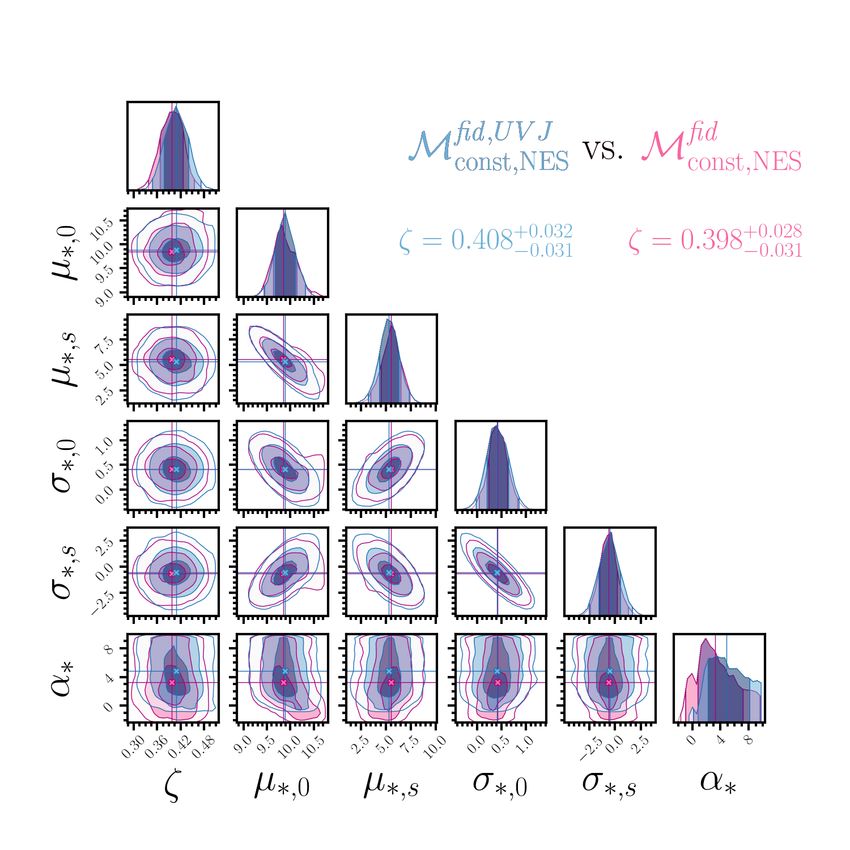
The model with the highest value of Bayesian evidence explored by CSN, named model
Mconst,NES , has six hyper-parameters: ζ, µ∗,0 , µ∗,s , σ∗,0 , σ∗,s and α∗ (see CSN for details).
We repeated the analysis of CSN by considering a modified fiducial sample. In particular,
we changed the selection criterion for the galaxies of the LEGA-C sample: in addition
to the criteria used in CSN, we exclude galaxies that are star-forming on the basis of
their position in the U V J colour-colour diagram. In the top panel of Figure 1, the U V J
diagram for the LEGA-C sample of 178 ETGs used in CSN is shown (the U V J colours
are taken from the UltraVISTA catalogue of Muzzin et al. 2013). In this diagram the
locus of passive galaxies is the area above and to the left of the broken line: about 90%
of the galaxies of the LEGA-C sample of CSN are in this area. Excluding galaxies that
are outside the locus of passive galaxies in the U V J diagram of Figure 1, we end up
with a modified fiducial sample, consisting of 161 instead of 178 LEGA-C galaxies, in
addition to the SDSS galaxies. We applied model Mconst,NES to this modified fiducial
fid,UVJ
sample (hereafter model Mconst,NES ) and compared the results with those obtained by
fid
CSN for the fiducial sample (hereafter model Mconst,NES ). The posterior distributions
fid,UVJ fid
of the hyper-parameters of models Mconst,NES and Mconst,NES , shown in the bottom
panel of Figure 1, are in agreement within 1σ. In particular, for model Mfconst,NESid,U V J
, theThe merger-driven evolution of ETGs 3
normalisation of the M∗ -σe scaling relation evolves with ζ = 0.408+0.032
−0.031 , consistent with
f id
0.398+0.028
−0.031 obtained by model M const,NES . This analysis suggests that, at least as far
as the U V J selection is concerned, the results of the extended sample in CSN are not
biased.
Figure 1. Top panel: U V J colour-colour diagram for the LEGA-C sample of 178 ETGs (red
dots). The broken line separates quiescent (upper-left region) and star-forming galaxies (low-
er-right region) as in Muzzin et al. (2013). Bottom panel: posterior probability distributions of
the hyper-parameters for the M∗ -σe models Mfconst,NES
id
(purple contours) and Mfconst,NES
id,U V J
(blue
contours). In the 1D distributions (top panel of each column) the vertical solid lines and colours
delimit the 68, 95 and 99.7-th quantile based posterior credible interval. In the 2D distributions
(all the other panels) the contours enclose the 68, 95 and 99.7 percent posterior credible regions.
The lines indicate the median values of the hyper-parameters.4 Carlo Cannarozzo et al. 3. In-situ and ex-stu stellar populations in ETGs The evolution of metallicity, chemical abundances as well as the ages and other physical properties of stars in ETGs contain information on the evolutionary processes occurred across cosmic time. In this section we discuss the radial distribution of stellar metallic- ity in massive MaNGA (Bundy et al. 2015) ETGs in terms of in-situ and ex-situ stellar components, relying on simulated galaxies drawn from the magnetohydrodynamic cos- mological simulation IllustrisTNG (Springel et al. 2018; Pillepich et al. 2018a; Nelson et al. 2018; Marinacci et al. 2018; Naiman et al. 2018). We extracted from the MaNGA survey a sample of more than 700 ETGs, with M∗ > 1010.5 M , selected in EW(Hα) > −3 and Srsic index n > 2.5. In order to reduce the effects of systematic biases caused by different assumptions, priors and fitting methods (Conroy 2013), we rely on two estimates of metallicity derived by using the spectral fitting codes FIREFLY (e.g., Comparat et al. 2017) and Prospector (Leja et al. 2017). For a description of the derivation of stellar properties, we refer the reader to Ojarzún et al. (2019). To make a comparison with simulations, we extracted around 2800 MaNGA-like ETGs from the z = 0.1 snapshot of IllustrisTNG100. For each simulated galaxy, we choose randomly a line of sight and we build a 2D map of stellar properties by projecting the positions of stellar particles onto a 300 × 300 pixel area. The 1D profiles are derived from the 2D maps using concentric elliptic annuli with fixed ellipticity for each ETG. A detailed description of this fit procedure is provided in Huang et al. (2018). In Figure 2, the median metallicity profiles for MaNGA and IllustrisTNG ETGs are shown for two stellar mass bins. Although the Prospector metallicity tends to be lower than the FIREFLY estimate (offset mainly due to different stellar models assumed), we find good agreement between the two measurements. Moreover, the observed profiles are well reproduced by the IllustrisTNG profiles, in particular at the high-mass end. In the case of IllustrisTNG galaxies, we can disentangle the in-situ and ex-situ stellar popula- tions (see Rodriguez-Gomez et al. 2016) and measure for each component its metallicity profile. Looking at the behaviour of the in-situ and ex-situ metallicity distributions, we notice that for galaxies with M∗ . 1011 M the inner regions are dominated by the in-situ component: the total and the in-situ metallicity profiles are indistinguishable out to 20 kpc. Instead, in ETGs with M∗ & 1011 M , the ex-situ component is as relevant as (or even more relevant than) the in-situ component at all radii, and has, on aver- Figure 2. Mass-weighted metallicity radial profiles of massive ETGs with lower (left panel) and higher (right panel) stellar mass. The circles and squares represent the median estimates for MaNGA galaxies from FIREFLY and Prospector codes, respectively. The curves represent the median estimates for IllustrisTNG galaxies. The dashed and dotted curves represent the in-situ and the ex-situ stellar components, respectively, while the solid curve represents the total stellar components. The shaded area and the error bars indicate 1σ scatter.
The merger-driven evolution of ETGs                               5
age, higher metallicity. These results, combined with the finding that the stellar surface
density profiles of ETGs with M∗ & 1011 M are similar for in-situ and ex-situ stars
(Chowdhury et al. in preparation), are consistent with the fact that major mergers are
important in the assembly of the most massive galaxies in IllustrisTNG (Tacchella et al.
2019). As already shown in previous works (see Pillepich et al. 2018b), the role of the
ex-situ population tends to be stronger in galaxies with M∗ & 1010.5 M , constituting
more than the 50% of the total stellar mass.

4. Implications
   The evolution of the M∗ -σe relation and the metallicity profiles of massive ETGs can
be interpreted in the context of a merger-induced evolution. The stellar mass of galaxies
varies with cosmic time mainly as a consequence of star formation and accretion of stars.
On the one hand, some internal mechanisms, such as stellar or active galactic nucleus
feedback, can blow out part of the material, depriving the galaxy of the gas reservoir
needed to form new stars and then limiting the growth of the stellar mass. On the other
hand, phenomena like mergers can trigger star formation and bring in stars formed in
other galaxies. In massive systems, like the ETGs considered in these works, the latter
process is expected to be dominant. The results here presented underline the importance
of having large and high-resolution observational surveys and cosmological simulations,
both necessary to improve our understanding of the galaxy evolution. A self-consistent
comparison between observations and simulations is crucial to draw robust conclusions.

References
Belli S., Newman A. B., Ellis R. S., Konidaris N. P., 2014b, ApJ, 788, L29.
Bundy K., et al., 2015, ApJ, 798, 7.
Cannarozzo C., Sonnenfeld, A., Nipoti, C., 2020, submitted to MNRAS, arXiv1910.06987.
Cannarozzo C., Leauthaud A., Huang S., Oyarzn G., Diemer B., Bundy K., Chowdury R., Nipoti
      C., Sonnenfeld A., in preparation.
Chowdhury R., Huang S., Leauthaud A., Ardilla F., Diemer B., Cannarozzo C., in preparation.
Cimatti, A., Fraternali, F., Nipoti, C., 2019, Introduction to Galaxy Formation and Evolution:
      From Primordial Gas to Present-Day Galaxies, Cambridge University Press.
Comparat J., et al., 2017, ArXiv e-prints, arXiv:1711.06575.
Conroy C., 2013, ARA&A, 51, 393.
Eisenstein D. J. et al., 2011, AJ, 142, 72.
Huang, S. et al., 2018, MNRAS, 475, 3348.
Leja J., Johnson B. D., Conroy C., van Dokkum P. G., Byler N., 2017, ApJ, 837, 170.
Marinacci F., et al., 2018, MNRAS, 480, 4.
Muzzin A., et al., 2013, ApJ, 777, 1.
Naiman J., et al., 2018, MNRAS, 477, 1.
Nelson D., et al., 2018, MNRAS, 475, 1.
Ojarzún G., et al., 2019, MNRAS, 475, 1.
Oser L., Ostriker J. P., Naab T., Johansson, P. H., Burkert, A., 2010, ApJ, 725, 2.
Pillepich A., et al., 2018a, MNRAS, 475, 1.
Pillepich A., et al., 2018b, MNRAS, 475, 648.
Rodriguez-Gomez V., et al., 2016, MNRAS, 458, 3.
Springel V., et al., 2018, MNRAS, 475, 1.
Straatman C. M. S., et al., 2018, ApJS, 239, 27.
Tanaka M. et al., 2019, ApJL, 885, 2.
Tacchella S., et al., 2019, MNRAS, 487, 4.
van der Wel A., et al., 2016, ApJS, 223, 29.
You can also read