The new frontier of interactive, digital geologic maps: Google Earth-based multi-level maps of Virginia geology
←
→
Page content transcription
If your browser does not render page correctly, please read the page content below
The Geological Society of America
                                                                     Special Paper 492
                                                                            2012

               The new frontier of interactive, digital geologic maps:
              Google Earth–based multi-level maps of Virginia geology

                                                   Owen P. Shufeldt
                                                 Steven J. Whitmeyer*
Department of Geology & Environmental Science, James Madison University, Memorial Hall MSC 6903, Harrisonburg, Virginia
                                                      22807, USA

                                                   Christopher M. Bailey
         Geology Department, College of William & Mary, McGlothlin-Street Hall 215, Williamsburg, Virginia 23187, USA

                                                                       ABSTRACT

                             Digital geologic maps that use a virtual globe interface, like Google Earth (GE),
                        are a relatively new medium for presenting geologic data and interpretations. This
                        format incorporates significant advantages over traditional paper geologic maps and
                        cross sections, including:
                             • A user-friendly and intuitive interface for novice users, which enhances the util-
                        ity of geologic information for students and the general public;
                             • The ability to view multiple maps simultaneously and seamlessly transition
                        between maps by zooming or panning;
                             • The option of displaying cross sections in situ on geologic maps as vertical inter-
                        pretations of above ground or subsurface geology; and
                             • A facility for integrating map interpretations with individual outcrop and field
                        data, which traditionally has been relegated to field books.
                             This paper outlines a digital maps package, composed of geologic maps of regions
                        of Virginia, as a proof of concept and template for possible future expansion beyond
                        state boundaries or into the realm of soils, geomorphological or hydrological maps.
                        Through collaboration between universities, state agencies, and federal organiza-
                        tions we have assembled a multi-layered, fully interactive map accessible through two
                        portals: the stand-alone Google Earth application, and as a web page using the GE
                        web browser plug-in (GE API). All maps within this package have selectable poly-
                        gons, polylines (“paths”), and points (“placemarks”), many of which contain associ-
                        ated metadata, such as lithologic descriptions, fault information, outcrop orientation
                        data, etc. At the smallest scale, a generalized geologic map of Virginia is displayed
                        with a selectable overlay of regional physiographic provinces. As users pan and zoom,
                        the maps automatically transition from generalized statewide maps to more refined

*Corresponding author: whitmesj@jmu.edu.

Shufeldt, O.P., Whitmeyer, S.J., and Bailey, C.M., 2012, The new frontier of interactive, digital geologic maps: Google Earth–based multi-level maps of Virginia
geology, in Whitmeyer, S.J., Bailey, J.E., De Paor, D.G., and Ornduff, T., eds., Google Earth and Virtual Visualizations in Geoscience Education and Research:
Geological Society of America Special Paper 492, p. 147-163, doi:10.1130/2012.2492(11). For permission to copy, contact editing@geosociety.org. © 2012 The
Geological Society of America. All rights reserved.

                                                                               147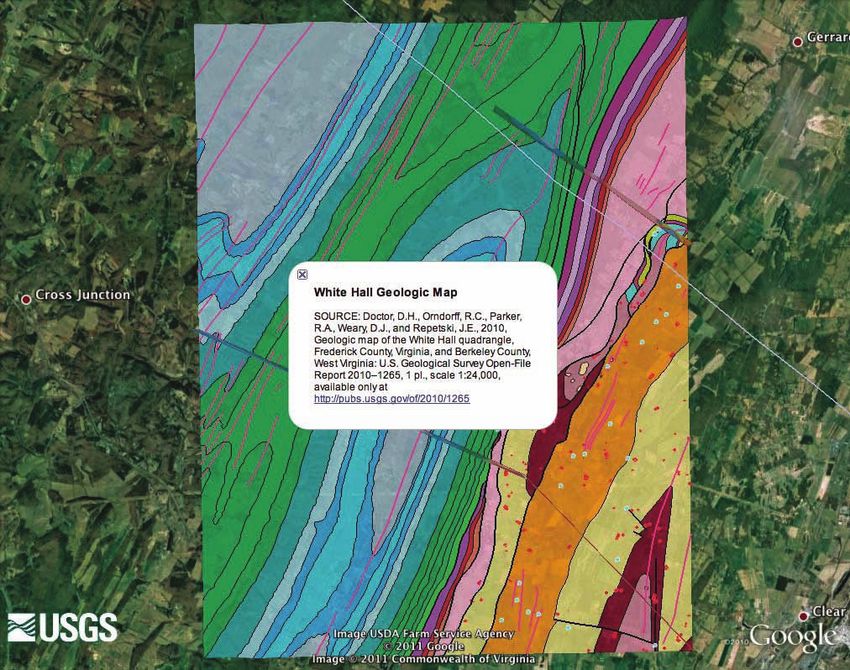
148 Shufeldt et al.
regional maps and 1:24,000 scale quadrangle maps. Many of the map components
(cross-sections, explanations, and orientation symbols) cannot be created directly in
GE but are added to the digital maps using KML scripts derived from an HTML-
based toolkit.
Challenges related to the method of digital map development described herein
include: effective importation of vector data from other GIS databases, style limi-
tations inherent in GE, and time-consuming labor associated with the digitization
of polygons and polylines in GE. There are also conceptual challenges at the user
interface level, including possible misconceptions with the display of vertical cross
sections due to the inability to look below the GE digital elevation model and associ-
ated surface imagery.
INTRODUCTION OVERVIEW OF THE VIRGINIA GEOLOGIC
MAPS PACKAGE
Geoscience educators and professionals are often chal-
lenged by using 2-D static tools to present and teach 3-D spa- The Virginia geologic maps package is a GE-based, inte-
tial concepts like rock orientations and folded structures. Stud- grated set of maps, cross sections, and outcrop-scale data
ies have discussed this difficulty while describing challenges designed as an intuitive interface for a broad spectrum of users,
faced when performing Euclidean or projective spatial tasks including geology professionals, educators, students, and the
(Kastens and Ishikawa, 2006). The advent of virtual globes has general public. To access the maps package, either download the
provided a new medium for addressing these challenges (But- master KML file at:
ler, 2006; Lisle, 2006; Goodchild, 2008) through their facility
in displaying spatial geological data in a virtual 3-D, dynamic http://csmres.jmu.edu/Geollab/Whitmeyer/web/
environment (Hennessy and Feely, 2008; De Paor and Whit- visuals/GoogleEarth/VirginiaGeologicMaps.kml
meyer, 2011). Techniques of displaying geological data on vir-
tual globes include overlaying map images, creating individual or view it as a web page by utilizing the GE API plugin at:
selectable polygons, importing data from a Geographic Infor-
mation System (GIS) (Whitmeyer et al., 2010), and modify- http://csmres.jmu.edu/Geollab/Whitmeyer/web/
ing keyhole markup language scripts (KML) to link maps with visuals/GoogleEarth/Virginia/VirginiaMaps.html
associated Collaborative Design Activity (COLLADA) models
of structural orientation symbols and cross sections (De Paor Fast, seamless transitions between statewide maps, regional
and Whitmeyer, 2011). While many of these topics have been 1:50,000 scale geologic maps, and detailed 7.5 min quadrangle
previously presented and discussed (e.g., articles in Chen and (1:24,000 scale) geologic maps are key features of the maps
Bailey, 2011), the literature lacks a thorough manual for creat- package. The user controls what maps and features are displayed
ing a complete, multi-level, interactive maps package for virtual by zooming and panning in the GE window. Similarly, detailed
globes, specifically Google Earth. outcrop data, such as orientation symbols and photos, are only
This paper discusses the collaborative development of a pro- visible when the user is zoomed in close to the ground surface.
totype maps package for Google Earth (GE) displaying Virginia This design prevents voluminous point data from cluttering the
geology and containing a full range of geological data, includ- user’s field of view when zoomed out to smaller scales.
ing maps at multiple scales that automatically transition as users At the smallest scale, where the field of view encompasses
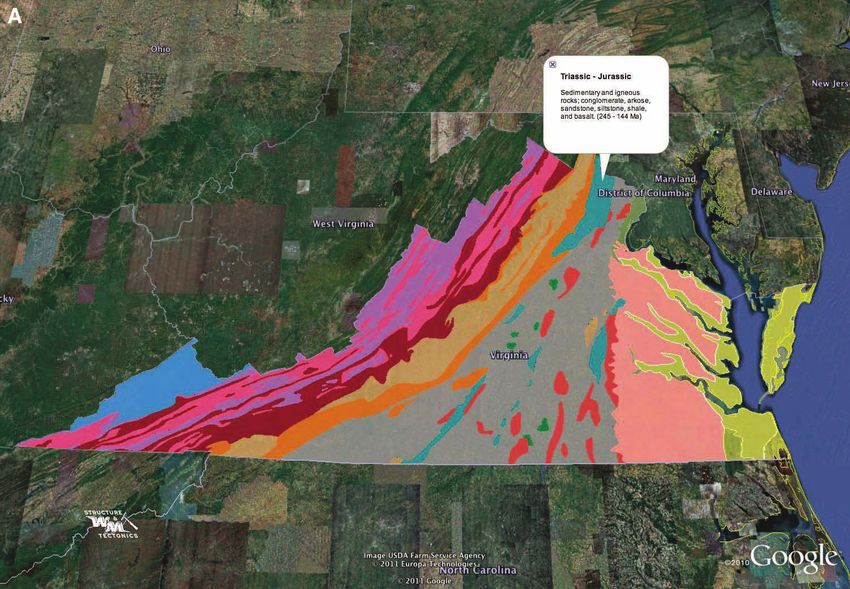
zoom in and out. The maps contain the most important features Virginia (or more of the eastern seaboard) a map of the physio-
of geologic maps: lithologic units and faults with descriptions graphic provinces of Virginia (Fig. 1A) is visible, with the option
(metadata), structural data (orientation symbols of planar fea- to show the extensions of these physiographic provinces to the
tures), cross sections, and outcrop photos and notes. Other com- north (Fig. 1B) and south (Fig. 1C) by toggling check boxes in
ponents include a layer that highlights the 7.5 min quadrangles the GE Layers menu. These maps, and others in this maps pack-
that currently are included in the maps package with hyperlinks to age, were digitized from a variety of sources, the citations for
state geological survey (Virginia Department of Mines, Minerals which can be found in the description pop-up bubbles associated
and Energy) publications and reference material for each quad- with each colored polygon.
rangle. This paper will also briefly discuss the GE web browser As the user zooms closer to the ground surface, the physio-
plug-in (GE API) and the advantages and disadvantages of dis- graphic province maps automatically transition to a generalized
playing this maps package in such a platform. Finally, potential geologic map of Virginia (Fig. 2A; C.M. Bailey’s 1999 “Sim-
uses of digital geologic maps packages for professionals, educa- plified Geologic Map of Virginia,” http://web.wm.edu/geology/
tors, and the general public will be addressed. virginia/provinces/pdf/va_geology.pdf). A west-to-east cross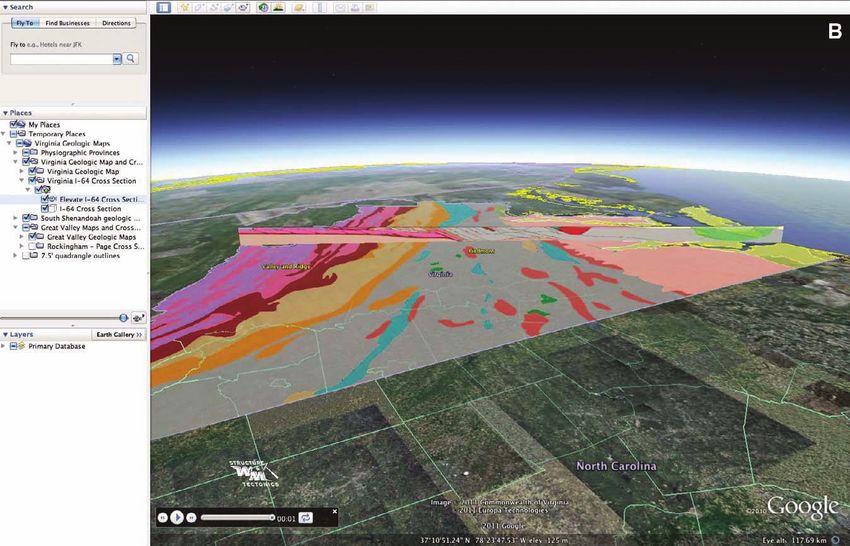
The new frontier of interactive, digital geologic maps                   149
                                                                          3

                             Figure 1. (A) Physiographic province
                             map of Virginia with the provinces
                             labeled. (B) Physiographic province
                             map of the northeastern United States
                             showing a general description of the
                             selected polygon in the pop-up balloon.
                             (C) Physiographic province map of the
                             southeastern United States showing a
                             general description of the selected poly-
                             gon in the pop-up balloon.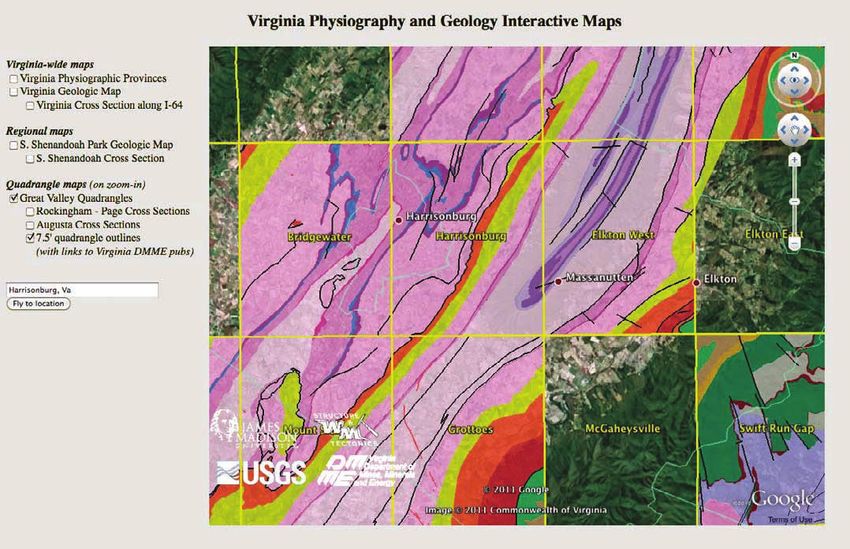
150
                                                                                                                                                                              Shufeldt et al.

Figure 2. (A) Simplified geologic map of Virginia as polygons with information in pop-up balloons (after C.M. Bailey’s 1999 “Simplified Geologic Map of Virginia,” http://web
.wm.edu/geology/virginia/provinces/pdf/va_geology.pdf). (Continued).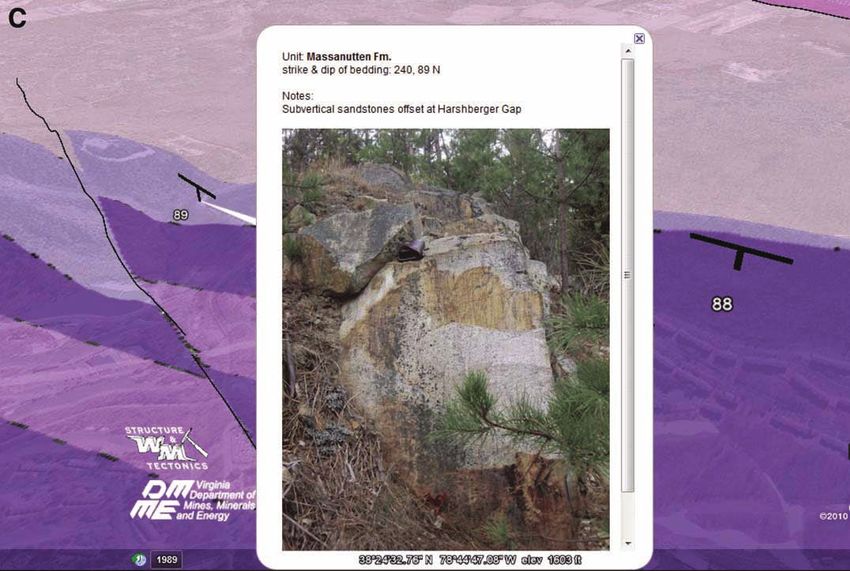
The new frontier of interactive, digital geologic maps

Figure 2. (B) Northwest-southeast cross section interpreting subsurface geology spanning Virginia (after Williams et al., 2005). The cross section is elevated out of the subsurface by
clicking on the “Elevate I-64 Cross Section” Tour highlighted in blue.
                                                                                                                                                                                          151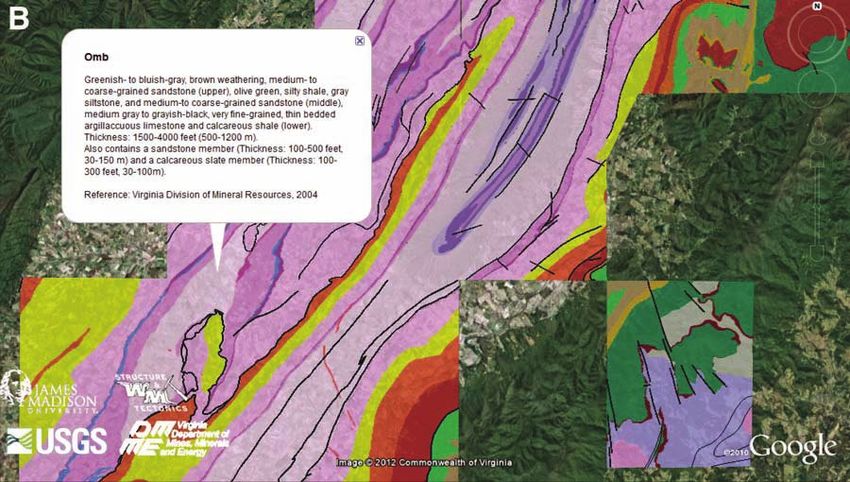
152                                                            Shufeldt et al.

section interpretation of the subsurface geology can be viewed          Shenandoah Valley region, the largest scale (1:24,000) geologic
by tilting the view and running the “Elevate I-64 Cross Section”        maps appear (Fig. 3B). At present, the coverage of intermediate-
tour in the Virginia I-64 Cross Section folder (Fig. 2B). Contin-       to large-scale maps is restricted to northwestern Virginia. Fig-
ued zooming in the central Blue Ridge region displays a 1:50,000        ure 3B shows a typical region of partial coverage in the vicinity
scale map of the Blue Ridge to Valley and Ridge transition in           of Harrisonburg, Virginia. Work to expand map coverage at the
the southern Shenandoah National Park area (Fig. 3A; Bailey,            1:50,000 and 1:24,000 scales is ongoing.
C.M., Gattuso, A.P., and Tadlock, E.D., 2008, Digital Geologic               Below we briefly discuss the geologic setting for Virginia
Map of the southern Shenandoah National Park region, Virginia,          and the Shenandoah Valley / Blue Ridge region, after which we
1:50,000 scale, unpublished). With continued zooming in the             discuss design components of the maps package in detail.

          Figure 3. (A) 1:50,000 scale geologic map of the southern region of Shenandoah National Park and surrounding areas
          (after Bailey, C.M., Gattuso, A.P., and Tadlock, E.D., 2008, Digital Geologic Map of the southern Shenandoah National
          Park region, Virginia, 1:50,000 scale, unpublished). (B) Collection of 1:24,000 scale 7.5 min quadrangle geologic maps
          covering much of the same area as (A) (after Forte et al., 2005; Campbell et al., 2006, and references therein), with gaps
          showing quadrangles that have not yet been included in this map compilation.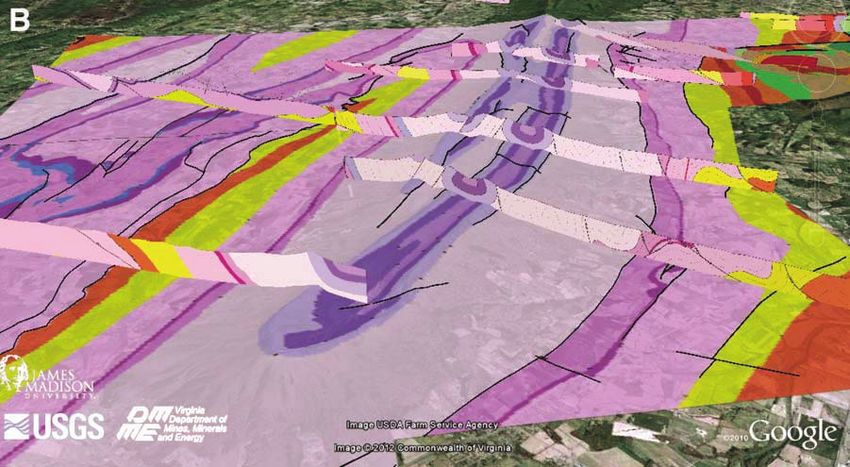
The new frontier of interactive, digital geologic maps                                         153

GEOLOGIC OVERVIEW OF VIRGINIA                                         paths (poly-lines) through tracing over an overlay imported as
                                                                      a raster image (JPEG, PNG, TIFF); or by importing shapefile
     The geology of Virginia is quite diverse, ranging from sedi-     data from ArcGIS and modifying the vector data (polygon col-
ments currently being deposited in marshes and barrier islands        ors, line weights, etc.) to be consistent with the rest of the maps
along the Atlantic coast to Eocene volcanic rocks to metamor-         package. Individual polygons and paths are used for lithologic
phic rocks formed over a billion years ago. At present, Virginia      units and linear features, respectively, to enable users to access
is located well within the North American tectonic plate along        descriptions and metadata via pop-up bubbles by clicking on the
a passive margin setting. Virginia’s geology is the result of two     features. This can also be accomplished by creating image over-
supercontinent cycles during the last billion years: (1) the forma-   lays for each unit as a separate PNG (portable networks graphics)
tion of Rodinia to the opening of the Iapetus ocean, and (2) the      files, but Google Earth renders raster overlays much more slowly
formation of Pangaea to the opening of the Atlantic ocean. Tra-       than vector polygons. Fast and efficient rendering of map images
ditionally, Virginia is divided into five physiographic provinces,     is a constant challenge for any maps package that displays data
each with its own unique topographic character that reflects the       on a quadrangle or larger scale.
underlying materials and geologic structure of the province (Fig.
1A; Fenneman and Johnson, 1946; Bingham, 1991). From west             Image Import Method
to east, the provinces include the Allegheny Plateau, Valley and
Ridge, Blue Ridge, Piedmont, and Coastal Plain (Fig. 1A). The               As discussed above, many digital maps are created in pro-
Allegheny Plateau and Valley and Ridge provinces are part of          grams like Adobe Illustrator, where the final map can be exported
the Appalachian foreland basin and are underlain by Paleozoic         as a JPEG or PNG file. If the map is a quadrangle, with known
sedimentary rocks. Rocks on the Plateau are generally flat-lying,      bounding coordinates, importing these files into GE simply requires
while rocks in the Valley and Ridge were folded and faulted dur-      using the “Add Image Overlay” tool and specifying the coordinates
ing the late Paleozoic Alleghanian Orogeny (Fig. 2; Virginia          for the north, south, east, and west boundaries of the map. Once
Division of Mineral Resources, 1993, 2003). Differential erosion      this is done, polygons can be created using the Add Polygon feature
in the Valley and Ridge has produced the distinctive topography       to manually trace the outline of each lithologic unit. To enhance
of the province. The Blue Ridge province encompasses Virgin-          interactivity, adding unit descriptions into the “Description” field of
ia’s highest peaks and is characterized by relatively high relief.    the polygon allows users to click anywhere within the polygon and
Rocks of the Blue Ridge province include 1.0–1.2 Ga granitoid         obtain a pop-up balloon with the lithologic information.
gneisses and an overlying Neoproterozoic–Early Paleozoic cover
sequence of metamorphosed volcanic and sedimentary rocks              Shapefile Import Method
(Fig. 2; Bailey et al., 2006). A complex suite of Proterozoic to
Paleozoic metamorphic and igneous rocks underlies the Pied-                For maps constructed in ArcGIS, the latest versions of
mont province, forming the hinterland of the Appalachian Oro-         Google Earth Pro allow the user to import unit polygons or line-
gen, sensu lato (Horton et al., 1989). Major ductile fault zones      work from a shapefile (.shp). However, Google Earth Pro cur-
and faults bound Piedmont terranes, and the province is cut by        rently limits the number of unique colors that can be assigned
a series of early Mesozoic rift basins. Early Jurassic magmatism      to shapefile elements, and thus the shapefile sometimes is nec-
produced dikes, sills, and flows in the Culpeper basin, and mafic       essarily imported with a random color scheme, and all polygon
dikes throughout much of the Piedmont (Virginia Division of           colors have to be manually reassigned. Our currently preferred
Mineral Resources, 1993, 2003). The Coastal Plain consists of         method is to export shapefiles or layers as KML files out of Arc-
a gently inclined sequence of Cretaceous to Recent sedimentary        GIS using Arc Toolbox, which does a better job of preserving
rocks and sediments deposited under shallow marine, estuarine,        polygon styles following the shapefile to KML conversion. Line-
and fluvial conditions associated with changing sea levels during      work, however, is still problematic when imported into GE from
the past 100 million years (Fig. 2; Mixon et al., 1989; Virginia      ArcGIS, as individual lines in ArcGIS often become segmented
Division of Mineral Resources, 1993, 2003).                           into separate lines when converted to KML code. Thus, we typi-
                                                                      cally have to manually redigitize all of the linework within GE.
MAP DEVELOPMENT IN GOOGLE EARTH                                       Another issue with lines in GE is that there is no option for creat-
                                                                      ing ornamentations. Therefore, adding ornaments like barbs on
     The integrated geologic maps package described in detail         thrust faults or tick marks on normal faults is a non-trivial task.
below was developed specifically for presentation using Google
Earth, allowing for features to be completely controlled and dis-     Adding Structural Symbols
played using the tools and controls within the program. However,
the geologic maps displayed were, almost without exception,                At the largest map scale (1:24,000), structural data often
originally developed using other graphics platforms, such as Arc-     is necessary to get a thorough understanding of the surface
GIS and Adobe Illustrator. Thus, GE map development typically         and subsurface geology. However, since this GE maps pack-
begins in one of two ways: by manually creating polygons and          age is designed for a wide range of users, our goal is to display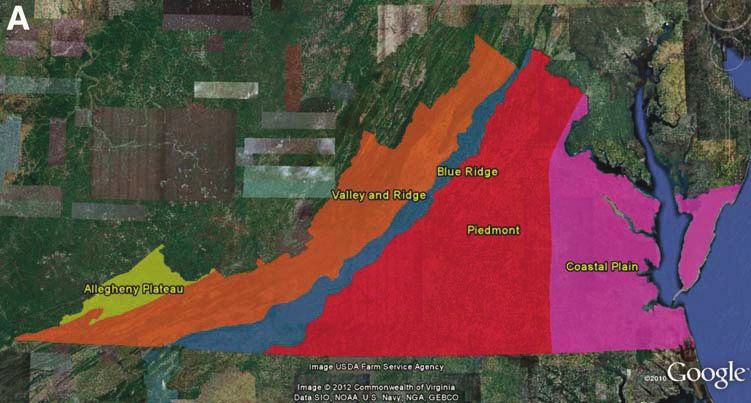
154   Shufeldt et al.

                        Figure 4. (A) Oblique view of Massanu-
                        tten Mountain, Virginia, looking north-
                        west with oriented, 3-D strike and dip
                        symbols hovering above topography.
                        (B) Orientation Symbol Generator web
                        page. (Continued.)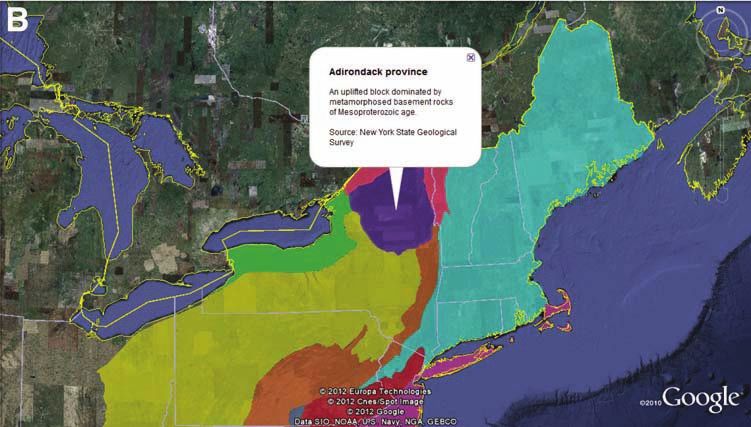
The new frontier of interactive, digital geologic maps                                             155

structural data in a manner that attempts to preclude typical con-         trend), dip (or plunge) angle and direction, and any additional
fusion regarding strike and dip of planar surfaces (Kastens and            notes about the outcrop. This generates code in a pop-up win-
Ishikawa, 2006). As discussed in Whitmeyer et al. (2010), we               dow that is saved as a KML file (Table 1), which, once opened
have found that the most accurate and intuitive way to display             in Google Earth, displays a series of oriented 3-D strike and dip
outcrop orientation symbols is as 3-D models hovering slightly             symbols (Fig. 4A) or lineation arrows. While all structural sym-
above the ground surface (Fig. 4A).                                        bols created with this tool display basic outcrop data (lithologic
     The construction of these models previously required some             unit, structural orientation) when selected, symbols can also
knowledge of SketchUp, COLLADA models, and KML script-                     include pictures of, and notes about, the outcrop at which the
ing (De Paor and Whitmeyer, 2011). Some basic KML script-                  measurement was taken (Fig. 4C). The description and images
ing is included in Tables 1 and 2 and within other papers in this          can be added to the text balloon using basic KML code (see
volume (e.g., De Paor et al., this volume, Chapter 6), but many            Table 1).
geologists will find it easier to use a web-based tool we have
developed that partially automates the creation and positioning            Adding Cross Sections
of orientation symbols. The Orientation Symbol Generator (Fig.
4B) is available at:                                                            In order to display cross sections in GE, COLLADA models
                                                                           of transparent vertical rectangles are necessary, on which PNG
 http://csmres.jmu.edu/Geollab/Whitmeyer/web/visuals/                      images of the geologic interpretation are superimposed. Meth-
                     maptools.html.                                        ods for doing this using SketchUp and the model import feature
                                                                           in GE have been described elsewhere (De Paor and Whitmeyer,
    To use this tool, the user supplies location (latitude and             2011; Hill and Harrison, this volume). To simplify this process
longitude) coordinates, formation name, azimuth of strike (or              and remove the necessity of using SketchUp, a web-based tool

Figure 4. (C) View of 3-D strike and dip model with a text balloon containing metadata and an outcrop photo. See Table 1 for the relevant KML code.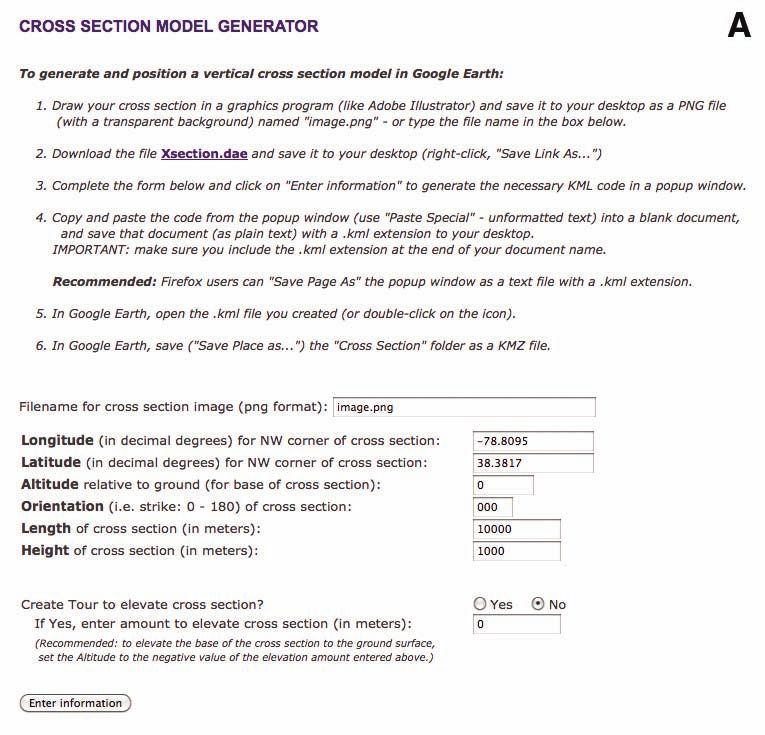
156                                                      Shufeldt et al.

              TABLE 1. KML CODE GENERATED BY STRIKE AND DIP SYMBOL GENERATOR WEB PAGE AT
                        http://csmres.jmu.edu/geollab/whitmeyer/web/visuals/googleearth/tools/sd.html

               Symbol3

                        relativeToGround

                                   -78.74285500000001
                                   38.406964
                                   40

                                   240
                                   0
                                   -89

                                   40
                                   50
                                   50

                                   http://csmres.jmu.edu/Geollab/Whitmeyer/web/visuals/
                                                GoogleEarth/tools/SDsymbol.dae

                 Massanutten Fm.3
                 Massanutten Fm.
      strike & dip of bedding: 240, 89 N

      Notes:
      Subvertical sandstones offset at Harshberger Gap

      View looking west from Massanutten Rd. at Harshberger Gap
      (4" wide compass case for scale)]]>
                 #sn_shaded_dot30

                           -78.74285500000001,38.406964,0

                89
                #sn_no_icon

                           -78.74335500000001,38.407364,0

        Note: Three Placemarks are generated for each orientation symbol. The first one listed displays the 3-D model of the
      symbol positioned with the  and aligned using the  tags. Note that the symbol model is
      stored on an external server and referenced by the   tags. The second Placemark contains outcrop
      information that appears in a pop-up balloon. In this case it includes a photo stored on an external server and
      referenced with the  tag. The third Placemark displays the dip number next to the symbol. This is an
      option that can be selected on the Strike and Dip Symbol Generator web page.
The new frontier of interactive, digital geologic maps 157
has been created to position a cross section in the correct location http://csmres.jmu.edu/Geollab/Whitmeyer/web/visuals/
and orientation in GE. This tool (Fig. 5A) is available at: GoogleEarth/tools/SO.html
http://csmres.jmu.edu/Geollab/Whitmeyer/web/visuals/ or see the KML tutorial at
GoogleEarth/tools/XS.html.
http://code.google.com/apis/kml/documentation/kml
The cross section image must first be constructed in a graph- _tut.html.
ics program like Adobe Illustrator. The image file must have a
transparent background and be saved in the .png file format to the Integrating the Maps
user’s desktop. A reference .dae (digital asset exchange) file con-
taining the COLLADA model for the vertical cross section rect- The most significant concern for creating a multi-layer,
angle must also be downloaded from the website and saved to the integrated system of geologic maps is speed of rendering of the
user’s desktop. Once these files are in place, the user enters lati- images. Any digital maps package becomes less convenient for
tude and longitude data, desired altitude, orientation (azimuthal the general public to use if it takes a significant amount of time
strike of cross section), length, and height (in meters) of the cross for individual maps to load. Early versions of our maps package
section image into the input fields on the web page. This gen- were developed with image overlays for lithologic units, which
erates (in a pop-up window) the KML code for positioning the caused GE to quickly grind to a halt as the number of maps on
cross section model that is saved with a .kml file extension and display increased. Similarly, our early attempts to display the full
opened in GE (Fig. 5B). If desired, all of the elements of the cross aerial extent of every map at all times, regardless of the view-
section can be packaged together as a stand-alone file by saving point of the user, slowed GE considerably. Thus, we settled on
the cross section folder as a KMZ file from within Google Earth. vector polygons and paths for lithologic units and linework, and
As is evident from the Figure 5B, there are some drawbacks we developed a Network Linked system of individual map files
to cross section display in GE. First, GE does not easily or accu- controlled through a downloadable master KML file.
rately display images below the ground surface. One way to get Network Links is the mechanism that allows KML files to
around this problem is to add a feature to elevate or “drag” the load other KML files based on certain criteria. When used with
cross sections up out of the ground to show that they are vertical , , and tags the master KML
subsurface interpretations of the geology shown on the map. This file can control when maps (as individual KML or KMZ files)
can be done by creating a GE Tour, which is an option on the web are displayed based on the viewpoint of the user. Table 2 shows
page shown in Figure 5A (detailed in De Paor et al., this volume, KML code from the VirginiaGeologicMaps.kml master control
Chapter 6) or by using the time slider feature (upper left corner of file, downloadable from:
Fig. 5B) as detailed in De Paor and Whitmeyer (2011). The time
slider feature can also be used to display a series of cross sections http://csmres.jmu.edu/Geollab/Whitmeyer/web/visuals/
above the terrain, which can illustrate along-strike features such as GoogleEarth/VirginiaGeologicMaps.kml
a down-plunge projection (i.e., the syncline shown in Figure 5B).
The tag defines the view area of the Google Earth
Citing Authors and Copyrights window within which a given map will be displayed. The chil-
dren of the tag include which sets
Building an integrated digital maps package necessitates the boundaries of the viewable area, and (Level of detail)
assembling existing geologic maps from many sources. This which sets the zoom altitude at which the map will be displayed.
prompts the question of how to display source information for the The use of these tags greatly enhances the speed of the maps
authors and organizations that created the individual maps. We package by only loading a given map when users are looking
list references at the bottoms of pop-up text balloons for mate- at areas and zoom levels appropriate for viewing specific map
rial cited from publications, but users will not see these refer- features. We also use these tags to display photos and orientation
ences if the balloons aren’t opened. Users can be forced to view symbols only when users are zoomed in close to the ground sur-
a pop-up window when individual maps are first loaded (e.g., face (e.g., Figure 4A). This alleviates the problem of unnecessary
the White Hall quadrangle; Fig. 6) by adding a clutter in the viewing window when zoomed out to a wider field
to the Network Link folder (see third in Table 2). For of view. Note that the individual map KML files are loaded with
basic source acknowledgment we decided to use screen overlays the tags that are coded after the
of logos for the authoring institutions and have the logos appear tags (Table 2).
or disappear depending on whether the specific map is visible
to the user (bottom left corner of Figures 3B, 4C, 5B). Screen The Maps Package Viewed within a Web Browser
overlays cannot be created from within the GE application; they
require external KML coding. Screen Overlays can be created KML and KMZ files can also be viewed in a web page by
using the web page at installing the Google Earth API in your web browser of choice.158 Shufeldt et al.
Figure 5. (A) Cross Section Model Generator web page. (B) A series of cross sections displayed above the geologic maps
of the Massanutten Synclinorium.The new frontier of interactive, digital geologic maps 159
Figure 6. View of the White Hall quadrangle geologic map in Google Earth showing source information displayed in a pop-up balloon when the
quadrangle map is first viewed. From Doctor et al. (2010).
With knowledge of some basic HTML, Javascript, and a free csmres.jmu.edu/Geollab/Whitmeyer/web/visuals/GoogleEarth/
license key from Google (http://code.google.com/apis/maps/ Virginia/VirginiaMaps.html) has toggle buttons to turn on/off
signup.html), a web designer can include a GE window in a web the specific geologic maps and cross sections (Fig. 7). Other less
page and load any desired KML or KMZ files. All of the func- relevant items that are displayed in the Layers and Places win-
tions described previously in this paper will behave exactly the dows of the stand-alone GE application are not visible to users,
same within the GE API. See De Paor et al. (this volume, Chapter which streamlines and simplifies the maps functionality. Initial
6) for a more complete description of similarities and differences informal feedback suggests that novice users prefer the direct,
between the Google Earth application and the GE API. but restricted, GE API interface, while more experienced users
One distinct advantage to using the GE API is the capability of Google Earth prefer to have the full functionality of the stand-
to restrict a user’s ability to wander off task while using custom alone GE application.
KML and KMZ files in GE. With some Javascript coding, a menu
of radio button selections can be displayed on the same web page APPLICATIONS OF THE MAPS PACKAGE
as the GE API, so that users can display only those KML files
that they desire. Similarly, the JavaScript programmer can make We envision the Virginia maps package as a useful compila-
obvious which content is available to users. The current proto- tion of geologic information for geology professionals and nov-
type web page for the Virginia geologic maps package: (http:// ices alike. The intuitive design of the maps interface, coupled with160 Shufeldt et al.
TABLE 2. KML CODE SNIPPETS FROM THE MASTER VIRGINIAGEOLOGICMAPS.KML FILE THAT USERS
DOWNLOAD TO OPEN THE MAPS PACKAGE IN GOOGLE EARTH
Virginia Geologic Maps
1
Physiographic Provinces
42.00
34.00
-73.00
-86.00
0
0
100
2000
0
0
http://csmres.jmu.edu/Geollab/Whitmeyer/web/
visuals/GoogleEarth/Virginia/
PhysiographicProvinces.kml
onRegion
Virginia Geologic Map and Cross-section
1
42.00
34.00
-73.00
-86.00
0
0
1500
10000
0
0
Virginia Geologic Map
http://csmres.jmu.edu/Geollab/Whitmeyer/
web/visuals/GoogleEarth/Virginia/
VirginiaGeologicMap.kml
onRegion
Note: This master code loads each of the maps in turn depending on the users viewpoint within Google Earth. The
tags set the viewing bounds for each map and the tags load
the individual maps from an external server. The tag contains source information for the original map.
(continued)The new frontier of interactive, digital geologic maps 161
TABLE 2. (continued)
Virginia I-64 Cross Section
0
http://csmres.jmu.edu/Geollab/Whitmeyer/
web/visuals/GoogleEarth/Virginia/
I64XS.kmz
onRegion
White Hall Geologic Map
SOURCE: Doctor, D.H., Orndorff, R.C., Parker, R.A., Weary, D.J., and Repetski, J.E., 2010,
Geologic map of the White Hall quadrangle, Frederick County, Virginia, and Berkeley County, West Virginia: U.S. Geological
Survey Open-File Report 2010–1265, 1 pl., scale 1:24,000, available only at http://pubs.usgs.gov/of/2010/1265
39.375
39.25
-78.125
-78.25
192
http://csmres.jmu.edu/Geollab/Whitmeyer/web/visuals/GoogleEarth/Virginia/WhiteHall.kmz
onRegion
…
…
Note: This master code loads each of the maps in turn depending on the users viewpoint within Google Earth. The
tags set the viewing bounds for each map and the tags load the
individual maps from an external server. The tag contains source information for the original map.
Google Earth’s search function, should provide quick and easy cussed in previous sections of this manuscript, and then saved as
access to rock types and other geologic data at multiple levels of KMZ files. GE Tours can include a narrated audio track as well
detail. As examples: (1) industry professionals, such as construc- as text/image balloons that turn on and off as required during the
tion or environmental engineers, could quickly find information tour. See Treves and Bailey (this volume) for details on creating
on subsurface rock type in a construction or wetland site; (2) pro- effective tours in Google Earth. In the geology department at the
fessional geologists or advanced students could examine bedding College of William and Mary tours of the Blue Ridge and Great
orientations of rock outcrops at locations like the southern end Valley regions (Fig. 3A) are used to introduce students to the
of the Massanutten Synclinorium to determine regional structure topography and geology of the areas prior to visiting the region
(Fig. 4A); or (3) teachers could design a GE Tour to virtually visit on a field trip. Tours can highlight salient topographic features
outcrops as a preview for an upcoming school field trip. and illustrate the linkage between the topography and bedrock
The touring capability of Google Earth can be a powerful geology. Additionally, tours serve as a springboard for individual
tool for illustrating geology to students and the general public. student inquiry into a region. Finally, in situations where student
Scripted tours, in which the user starts the tour and the program access to outcrops is limited by landowner restrictions or indi-
automatically flies over a terrain, are intuitively appealing for vidual mobility issues, virtual tours may provide the only way to
students raised with digital devices. GE Tours can be created examine geology in a setting that, in many respects, emulates the
with relative ease, incorporating many of the map elements dis- natural one.162 Shufeldt et al.
Figure 7. The Virginia geologic maps package viewed in a web browser using the Google Earth API. The maps displayed are toggled by the but-
tons to the left of the Google Earth window, so that several of the Great Valley quadrangle maps are displayed along with yellow 7.5ʹ quadrangle
outlines. The region shown is similar to the region in Figure 3B. This web page can be accessed at: http://csmres.jmu.edu/Geollab/Whitmeyer/
web/visuals/GoogleEarth/Virginia/VirginiaMaps.html.
CONCLUSIONS continent-wide package of digital geologic maps that are univer-
sally accessible.
The geologic maps package presented here provides a new,
intuitive, digital interface for the investigation of geologic maps ACKNOWLEDGMENTS
and data. The maps package is currently a prototype that focuses
on Virginia, and specifically the Shenandoah Valley region of This manuscript was improved by comments from Andy
northwestern Virginia. However, it is hoped that this design can Bobyarchick, Jesse Hill, and John Bailey. Early versions of this
be exported to other states and regions to create an integrated maps package were improved though comments and sugges-
continental-scale digital geologic maps package. Applications tions by Declan De Paor, Dan Doctor, Randy Orndorff, and Matt
for this sort of publicly available maps package include quick Heller, among others. This work has been partially supported by
access to geologic information for geology novices as well as USGS EDMAP, Virginia DMME STATEMAP, and NSF grants
professionals, and custom tours for presentations and inquiry- (0837049, 1022782, 1034660). Any opinions, findings, and con-
based investigations by students and the general public. This clusions or recommendations expressed in this paper are those of
prototype multi-level maps package was developed with collabo- the authors and do not necessarily reflect the views of the USGS,
ration between universities (James Madison University, College Virginia DMME, National Science Foundation, or Google Inc.
of William and Mary), state agencies (Virginia Department of
Mines, Minerals and Energy, Department of Geology and Min- REFERENCES CITED
eral Resources) and federal organizations (U.S. Geological Sur-
vey). We envision the expansion of this effort to other states and Bailey, C.M., Southworth, S., and Tollo, R.P., 2006, Tectonic history of the Blue
regions by similar collaborative teams, ultimately resulting in a Ridge north-central Virginia, in Pazzaglia, F.J., ed., Excursions in GeologyThe new frontier of interactive, digital geologic maps 163
and History: Field Trips in the Middle Atlantic States: Geological Society of cation and Research: Geological Society of America Special Paper 492,
America Field Guide 8, p. 113–134, doi:10.1130/2006.fld008(07). doi:10.1130/2012.2492(18).
Bingham, E., 1991, Physiographic diagram of Virginia: Virginia Division of Horton, J.W., Jr., Avery, A.D., Jr., and Rankin, D.W., 1989, Tectonostratigraphic
Mineral Resources Publication 105, scale ~1:685,000. terranes and their Paleozoic boundaries in the central and southern
Butler, D., 2006, Virtual globes: The web-wide world: Nature, v. 439, p. 776– Appalachians, in Dallmeyer, R.D., ed., Terranes in the Circum-Atlantic
778, doi:10.1038/439776a. Paleozoic Orogens: Geological Society of America Special Paper 230,
Campbell, E.V., Hibbitts, H.A., Williams, S.T., Duncan, I.J., Reis, J.S., Floyd, p. 213–245.
J.M., and Wilkes, G.P., 2006, Interstate 81 Corridor Digital Geologic Kastens, K., and Ishikawa, T., 2006, Spatial thinking in the geosciences and
Compilation, Virginia DMME Open-File Report 06-01. cognitive sciences: A cross-disciplinary look at the intersection of the two
Chen, A., and Bailey, J., eds., 2011, Virtual Globes in Science: Computers & fields, in Manduca, C., and Mogk, D., eds., Earth and Mind: How Geolo-
Geosciences, v. 37, no. 1, p. 1–110. gists Think and Learn about the Earth, Volume 413, The Geological Soci-
De Paor, D.G., and Whitmeyer, S.J., 2011, Geological and geophysical model- ety of America Special Paper 413, p. 53–76, doi:10.1130/2006.2413(05).
ing on virtual globes using KML, COLLADA, and Javascript: Computers Lisle, R.J., 2006, Google Earth: A new geological resource: Geology Today,
& Geosciences, v. 37, no. 1, p. 100–110, doi:10.1016/j.cageo.2010.05.003. v. 22, p. 29–32, doi:10.1111/j.1365-2451.2006.00546.x.
De Paor, D.G., Whitmeyer, S.J., Marks, M., and Bailey, J.E., 2012, this volume, Mixon, R.B., Berquist, C.R., Jr., Newell, W.L., Johnson, G.H., Powars, D.S.,
Geoscience applications of client/server scripts, Google Fusion Tables, and Schindler, J.S., and Rader, E.K., 1989, Geologic map and generalized
and dynamic KML, in Whitmeyer, S.J., Bailey, J.E., De Paor, D.G., and cross sections of the Coastal Plain and adjacent parts of the Piedmont, Vir-
Ornduff, T., eds., Google Earth and Virtual Visualizations in Geoscience ginia: U.S. Geological Survey Miscellaneous Investigations, Map I-2033,
Education and Research: Geological Society of America Special Paper 1:250,000 scale.
492, doi:10.1130/2012.2492(06). Treves, R., and Bailey, J.E., 2012, this volume, Best practices on how to design
Doctor, D.H., Orndorff, R.C., Parker, R.A., Weary, D.J., and Repetski, J.E., Google Earth tours for education, in Whitmeyer, S.J., Bailey, J.E., De
2010, Geologic map of the White Hall quadrangle, Frederick County, Vir- Paor, D.G., and Ornduff, T., eds., Google Earth and Virtual Visualizations
ginia, and Berkeley County, West Virginia: U.S. Geological Survey Open- in Geoscience Education and Research: Geological Society of America
File Report 2010-1265, 1 pl., scale 1:24,000. Special Paper 492, doi:10.1130/2012.2492(28).
Fenneman, N.M., and Johnson, D.W., 1946, Physical divisions of the United Virginia Division of Mineral Resources, 1993, Geologic Map of Virginia: Vir-
States: Washington, D.C., U.S. Geological Survey map, scale 1:7,000,000. ginia Division of Mineral Resources, scale 1:500,000.
Forte, A.M., Wooton, K.M., Hasty, B.A., and Bailey, C.M., 2005, Bedrock Virginia Division of Mineral Resources, 2003, Digital representation of the
geology of the Swift Run Gap 7.5ʹ Quadrangle, Blue Ridge Province, 1993 geologic map of Virginia: Virginia Division of Mineral Resources
Virginia, Geological Society of America Abstracts with Programs, v. 37, Publication 174 [CD-ROM; 2003, December 31]. Adapted from Virginia
no. 2, p. 34. Division of Mineral Resources, 1993, Geologic map of Virginia and
Goodchild, M.F., 2008, The use cases of digital earth: International Journal Expanded Explanation: Virginia Division of Mineral Resources, scale
of Digital Earth, v. 1, no. 1, p. 31–42, doi:10.1080/17538940701782528. 1:500,000.
Hennessy, R., and Feely, M., 2008, Visualization of Magmatic Emplacement Whitmeyer, S.J., Nicoletti, J., and De Paor, D.G., 2010, The digital revolution
Sequences and Radioelement Distribution Patterns in a Granite Batholith: in geologic mapping: GSA Today, v. 20, no. 4–5, p. 4–10, doi:10.1130/
An Innovative approach using Google Earth, in De Paor, D., ed., Google GSATG70A.1.
Earth Science: Journal of the Virtual Explorer, Electronic Edition, v. 30, Williams, S.T., Bleick, H., Carter, M.W., and Berquist, C.R., 2005, General-
paper 2. ized Geologic Cross Section of Virginia: unpublished Virginia Division of
Hill, J.S., and Harrison, M.J., 2012, this volume, Terrain modification in Google Mineral Resources data.
Earth using Google SketchUp: An example from the Western Blue Ridge
of Tennessee, in Whitmeyer, S.J., Bailey, J.E., De Paor, D.G., and Orn-
duff, T., eds., Google Earth and Virtual Visualizations in Geoscience Edu- MANUSCRIPT ACCEPTED BY THE SOCIETY 16 APRIL 2012
Printed in the USAYou can also read