The new Suez Canal: economic impact on Mediterranean maritime trade - in cooperation with
←
→
Page content transcription
If your browser does not render page correctly, please read the page content below
in cooperation with

         The new Suez Canal:
         economic impact on
Mediterranean maritime trade

                                    2015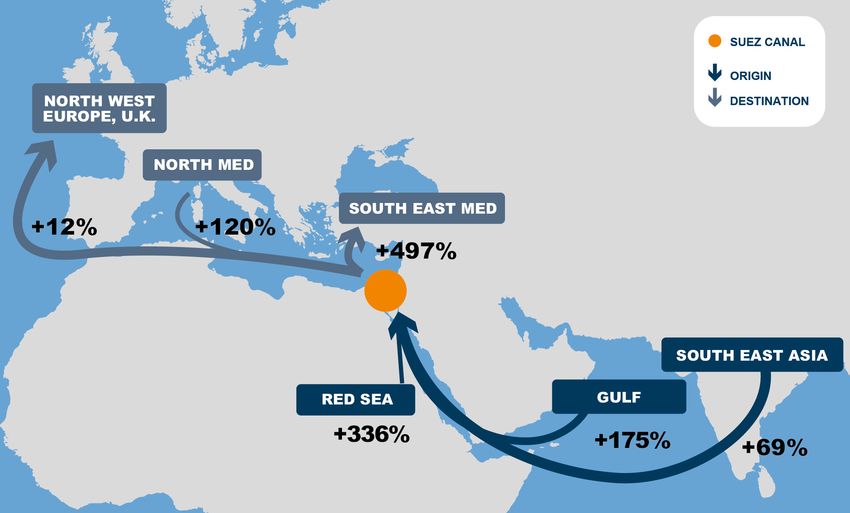
“The New Suez Canal: economic impact on Mediterranean maritime trade”
is a research carried out by SRM in cooperation with CERTeT-Bocconi
within the Permanent Observatory on Maritime Transports and Logistics
www.srm-maritimeconomy.com

Research Director:
Massimo DEANDREIS

Coordinator:
Alessandro PANARO

Authors:
Oliviero BACCELLI (CERTeT)
Anna Arianna BUONFANTI (SRM)
Olimpia FERRARA (SRM)
Roberto ZUCCHETTI (CERTeT)

Data and analyses updated to July 2015.

The analyses contained in this extract do not commit or represent in any way the views and opinions of
the founding and ordinary partners of SRM. The paper is solely for illustrative and informative ends, and
cannot be intended in any way as an opinion, an investment suggestion, or as expressing judgment on
the companies or persons mentioned. Any form of distribution or fruition and the faithful reproduction
of this text, even partial, cannot be carried out without the authorization of SRM. The use of this report
and of the information herein contained is only allowed for the purpose of studying and researching the
industry and shall be carried out quoting the source.
Graphic design and publishing development: Marina RIPOLI

The present document has been drafted with the support of:

2                                                            www.srm-maritimeconomy.com
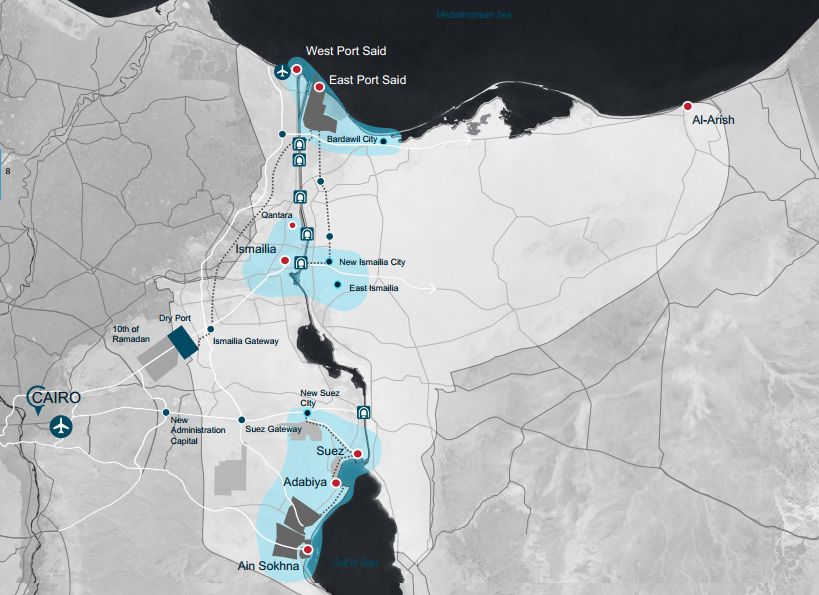
TABLE OF CONTENTS

Executive Summary 4

Introduction 6

The role of Egypt in the world supply chain 7

Canal’s traffic trends and a synthesis of the planning framework
of the new infrastructure 11

The new Suez Canal 18

The expected impact on maritime trade 21

The economic effects 26

The expected impacts on the Italian port 34

Conclusions 37

www.srm-maritimeconomy.com                                         3
EXECUTIVE SUMMARY
    Egypt ranks 19th (out of 157 coutries) in the Unctad’s “Liner Shipping Connectivity Index”
    which measures competitiveness in the maritime system based on the network and the
    quality of the container liner service offered by the ports. Within the Middle East, it is
    amongst the countries with the highest improvement rate: compared to 2004 the index
    value increased by 20 points.

    In addition, between 2007 and 2014 Egypt rose 35 positions in the Logistic Performance
    Index ranking reaching the 62nd position (World Bank indicator measuring logistics com-
    petitiveness of 160 countries in the world).

    These indicators are expected to grow further after the new Suez Canal.

    With the same per capita income, countries with better logistics performance grow more,
    by 1% of GDP and 2% of foreign trade. The expectations of Egypt’s economy are based on
    this positive data.

    In 2014 822 million tonnes of goods passed through the Canal; 416 million of which were
    southbound while 406 million were northbound, (about 8% of the total amount of goods
    handled globally).

    Between 2000 and 2014 the Canal’s traffic trends recorded a 120% increase in the transit
    of goods. The revenue generated by the Suez Canal between July 2014 and March 2015
    amounted to $4.1 billion, up by 2.5% compared to the same period of the previous year.

    Over the same period, north-south container trade volumes (which account for 50% of
    all the volume’s trade) grew by 187% while the south-north ones grew by 219%, and in
    2014 reached a substantial balance (212 million tonnes north-south and 222 million tonnes
    south-north). Petroleum products also grew significantly; from 50 million tonnes in 2000 to
    178 million tonnes in 2014 (+251%)

    If we pay attention to the northbound maritime traffic via Suez, the increasingly crucial
    role of the Gulf as origin of the shipments appears clear. As a matter of fact, in 2014, 34%
    of the shipments (137 million tonnes) originated in this area which was second to Southe-
    ast Asia, where the shipments amounted to 161 million tonnes.

4                                                       www.srm-maritimeconomy.com
The types of vessels which will take greater advantage from the new Canal will be con- tainer ships; thus the role of Port Said, where considerable infrastructural projects are currently ongoing, is fundamental. The area of the new Suez Canal will be able to compete with the major logistics regions in the world and in particular with Northern European cities such as Rotterdam and Ham- burg. The 2015 orderbook provides for an increase, by 2018, of the fleet of container ships amounting to about 7%, with the figure rising to 72% if we consider the megaship ranging from 18.000 to 21.000 TEUs, and 20.7% for the fleet from 13.000 to 18.000 TEUs. The estimates for 2018 predict a number of 83 megaships, mainly concentrated in the far North-East of Europe and far East-Mediterranean routes where the Great Alliances also operate - amongst others - the 2M and the Ocean Three which, on the Asia-Med route, holds a market share of respectively 39% and 27%. The potential impact on the choice of the routes by shipping companies is evident when considering that the opening of the new Canal led to a decrease in the transit time from 18 to 11 hours. In particular, it is estimated that using the Suez route, any shipping com- pany may have an average saving of 5-10% of total operating costs (depending on routes and distances). For example, on the Honk Kong-New York route, the new Canal, with its reduction in transit time, might be a valid alternative to Panama. The reduction of transport costs, combined with the increased capacity of the Canal, mi- ght have important implications both on the hierarchy of the Mediterranean ports and on the volume of traffic bound for the Mediterranean which, in 2015, remained at 19% (up, if compared to 15% in 2005). As for Italian ports, which currently handle 460 tonnes of goods, the new Suez Canal represents a favorable opportunity: more and larger ships in transit require an adequate and urgent infrastructural upgrade which also includes the dredging of the seabed and investment in logistics and innovation. The strengthening of the Mediterranean-Suez-Gulf route is a strategic opportunity both for Egypt and Italy, especially for its Southern regions, which could develop its natural role as a logistics platform in the heart of the Mediterranean, thus supporting as well the Italian economy. www.srm-maritimeconomy.com 5
Introduction
The paper intends to call attention to the major economic repercussions expected in the sectors
of transport, logistics, tourism, and in the businesses directly or indirectly associated with the
intercontinental maritime transport deriving from the enlargement of the Suez Canal and in the
synergic logistics activities planned by the Egyptian Government and expected to be completed
in the next few years.
Over the last decade, trades passing through the Canal recorded significant annual increases,
with the exception of the three years between 2009 and 2011, and increasing by over 300 million
tonnes between 2004 and 2014 when it changed from 520 to 822 million tonnes. The upward
trend and the pressure for a greater predictability of the transit time – an element increasingly
important for container traffic that represents more than 50% of the volume of the market served
by the Canal – pushed the Egyptian Government to realize, in a very short time, an investment of
considerable economic and geopolitical importance.
The focus of the analysis is the impact which the expansion of the Suez Canal may determine on
the traffic in the Mediterranean and it takes into account the specific geographical background
in the area of the Canal and in the Sinai Peninsula and the expansion as part of a specific path of
economic growth driven by public long term strategies. In particular, special attention is directed
at the possible increase in the exchange between Mediterranean countries and those of the Gulf,
in light of the recent evolution of international policies which will lead to the full inclusion of Iran
amongst the countries involved in the commercial exchanges with leading companies in the We-
stern world.
The strategic importance of the project will imply important consequences also in the relationship
between Italy and Egypt, both because exchange between the two countries in 2014 reached €5.2
billion (+10.2% compared to 2013), and because Egypt is the only country in the world of a signi-
ficant size for which Italy is the main export market.
The study is structured so as to address the role of Egypt within the world supply chain and the ef-
fects of its most recent strategic investments in maritime and port economy. The study, in particu-
lar, analyzes the traffic trends and the new infrastructure built along the Suez Canal. The analysis
offers an exhaustive overview of the expanding work in the Suez Canal as well as the enlargement
of the ports on the Egyptian Mediterranean and Red Sea coasts which can be the principal bene-
ficiaries of the work along with those overlooking the Gulf. The last part contains a summary of
the evaluation of the direct and indirect economic effects, with an insight on maritime and port
economy.

6                                                           www.srm-maritimeconomy.com
The role of Egypt in the world supply chain
Egypt has a primary role in the world supply chain thanks to the production and consumption
cycle activated by the presence of 85 million citizens which makes Egypt the principal country in
North Africa and due to the metropolitan area of Cairo where over 15 million inhabitants live and
which makes it the second larger African city after Lagos. As a matter of fact, Egypt’s relevance de-
rives almost entirely from its geographic position, being at the intersection of the main maritime
flows between East and West of the northern hemisphere. Furthermore, it features some of the
major African ports (Alexandria, Damietta and Port Said) and airports (Cairo).
Despite these elements of comparative advantages, throughout history Egypt drew little econo-
mic benefits from logistics and transport on the routes both to and from the African continent
and on the intercontinental routes, failing to fully exploit the Suez Canal, to implement industrial
policies and not addressing the development of this sector. Also the commitment of Egypt in pur-
suing the success of the COMESA-EAC_SADC tripartite Free Trade Area is certainly meant to help
reversing this situation, assuring a better exploitation of its geographical potential (SRM will soon
release a study in which the potential benefit for Egypt from a stronger African trade integration
will be highlighted).
The biannual report “Connecting to compete” from the World Bank examines in detail the stra-
tegic elements of Egyptian transport and logistics through the Logistics and Performance Index
(LPI)1. Such an indicator is the result of a collaboration between the World Bank, the main ope-
rators of logistics and scholars. The report, compiled every two years (World Bank, 2014) has the
specific purpose to help the countries identify the strengths and weaknesses of their port system
so as to program their investment in a more effective way. As a matter of fact, the study of the
World Bank points out that with the same per capita income, countries with better logistics per-
formance grow more, by 1% of GDP and 2% of trade.
While technological progress, the commercial exchange at a global level, and the liberalization
of investments are generating new opportunities, other global supply chains are presenting new
challenges that can only be overcome by those countries that will facilitate rapid, reliable and
economical freight handling. Hence, with the LPI, the World Bank aims at focusing the attention
on a matter of global importance and providing groundwork for dialogue between governments,
private sector operators and civil society to be able to support them in defining shared reforms
promoting the realization of investment in infrastructure, and promoting multilateral cooperation

1
  In the definition of the World Bank, logistics involves a number of essential activities - ranging from transport, storage,
groupage of goods and customs operations, sorting within countries and payment systems - which affect different ope-
rators and both public and private. Therefore, a competitive global logistics network is the backbone of international
trade and having a positive impact on economic activity of the country, its improvement is a fundamental development
objective for policymakers.

www.srm-maritimeconomy.com                                                                                                7
needed to avoid the rising costs of commercial exclusion and escape the vicious circle of the so
called “logistics unfriendliness”.
It is generally acknowledged that an efficient logistics chain may foster the development of trade
and growth. In fact, LPI endorse this theory showing that a better logistics performance positively
affects the expansion of trade, export diversification, the ability to attract foreign direct invest-
ment and economic growth.
The Logistics and Performance Index2 summarizes the results of the countries on six complemen-
tary areas of evaluation.
•   Efficiency of the clearance process.
•   Quality of trade and transport related infrastructure.
•   Ease of arranging competitively priced shipments.
•   Competence and quality of logistics services.
•   Ability to track and trace consignments.
•   Timeliness of shipments in reaching destinations within the scheduled or expected delivery
    time.

Global trade is vehicled amongst different nations by a network of logistic operators whose ef-
fectiveness, largely depends on country-specific factors such as trade procedures, transport in-
frastructure and telecommunications, and domestic markets for support services. In this context,

2
  In particular, the LPI provides a multidimensional assessment of logistics performance of a country by placing it on a
scale ranging from 1 (worst score) to 5 (best score). The evaluation is the result of the survey carried out online on more
than 5,000 individual country assessments provided by about 1,000 international shippers and express carriers in order
to compare the logistics profiles of 155 countries. The selected sample of operators is based on the assumption that
their opinions count as they decide the traffic routes to follow and influence companies in matters of choice of location,
selection of suppliers and identification of the target market.
To the World Bank the priority issues on which to intervene in order to improve performance in the field of transport
and logistics are as follows:
• A liberalization of the markets of logistics services that may encourages local players to increase the quality of supply.
    This is especially true for the sectors of road transport and customs that are essential to the efficient delivery of goods
    by international shippers.
• Time and cost of import and export.
• The reliability and predictability of the supply chain, as in countries where performance is low, importers and expor-
    ters incur higher costs to mitigate the effects of unreliable chains.
• The provision and the quality of infrastructure for trade that is a catalyst for growth. With the term “infrastructure”
    the World Bank defines both infrastructure for freight transport and passenger, and those typical of th information
    and communication technology which are widely used for the treatment of data for trade.
• The efficient border management and coordination of the various agencies involved in customs operations: agencies
    responsible for the enforcement of sanitary and phytosanitary standards and fulfilment of product standards seem in
    fact to be one of the causes of delays in the process of customs clearance of goods in many countries, because they
    often involve the need for additional bureaucratic procedures and inspections.
• The skills related to logistics in the strict sense and knowledge of commercial procedures.
The criteria concern both traditional themes (customs procedures and infrastructure quality) and elements of the most
recent interest (shipments’ tracking and tracing systems, on-time delivery, and expertise in the domestic logistics system)
which are particularly important in an industry where there is a tendency to increasingly reduce warehouses, to adopt
just-in-time management systems and to implement global supply chains.

8                                                                         www.srm-maritimeconomy.com
Germany, the Netherlands, Belgium and Great Britain attain higher positions in the ranking com-
piled by the World Bank in 2014 with scores above 4.00 (4.12, 4.05, 4.04 and 4.01, respectively)
while Egypt occupies only the 62nd position with a score of 2.97, though with a net improvement
compared to the figures of 2007 and 2010 which ranked them 97th and 92nd respectively.
The figure of 2014 is lower than that of 2012, when Egypt occupied the 57th position.
All this shows how extensive the logistics gap is, revealing that Egypt has to bridge in the geo-e-
conomic context of the Middle East in which the United Arab Emirates, Qatar, Turkey and Israel
respectively occupy position numbers 27th, 29th, 30th and 41st of the World Bank ranking thus hi-
ghlighting the results of specific development strategies. Furthermore, other countries like Saudi
Arabia, Bahrain, Cyprus and Oman have invested in targeted policies in this area managing to rank
better than Egypt at 49th, 52nd, 58th and 59th respectively.
The table below shows Egypt’s performance and highlights the areas where an improvement oc-
curred as well as those which are still critical.
In detail, Egypt scores 2.85 in the efficiency of the clearance process; 2.86 for infrastructure; 2.87
for the ease of arranging competitively priced shipments, 2.99 for the competence and quality of
its logistics services; 3.23 for its ability to track and trace consignments; 2.99 for the timeliness of
shipments. Egypt seems to have considerable problems with the timeliness of shipments and with
the organization and prices of international shipments, parameters in which it ranks respectively
99th and 77th in world ranking. Furthermore, although it experienced an encouraging improve-
Egypt ranking in the Logistics Performance Index (LPI)
RANKING SCORE *
Δ Δ
PARAMETER 2007 2010 2012 2014 2007 2010 2012 2014
07-14 07-14
Customs 119 122 69 57 +62 2.37 2.61 2.98 2.85 +0.48
Infrastructure 119 106 45 60 +59 2.08 2.11 2.60 2.86 +0.78
International
111 110 51 77 +34 2.00 2.22 3.07 2.87 +0.87
shipments
Competence
and quality in 96 54 50 58 +38 2.38 2.87 2.95 2.99 +0.51
logistics services
Tracking
72 101 66 43 +29 2.62 2.56 2.86 3.23 +0.61
&Tracing
Timeliness 96 81 64 99 -3 2.85 3.31 3.39 2.99 +0.14
LPI 97 92 57 62 +35 2.37 2.61 2.98 2.97 +0.60
Table 1 - Source: World Bank, Logistics Performance Index report, various years
* Minimum 1 and maximum 5.
www.srm-maritimeconomy.com 9ment in all the parameters compared to 2007 when its average LPI was 2.37, in 2014 it was 2.97. It must be recognized that Egypt is still well away from nations such as the United Arab Emirates (LPI 3.54) Qatar (3.52), Turkey (3.50) and Saudi Arabia (3.15). In any case, Egypt ranks second amongst the nations of Africa, behind South Africa which is the 34th. Over the past decade, the main investment in transport infrastructure carried out in Egypt took place in the port area and helped it rise from the 119th position in the LPI ranking in 2007 to the 60th in 2014. In particular, major investments were realized in Port Said and Damietta in the Mediterranean. Port Said is the principal Egyptian transhipment port located along the Suez Canal. Within the port, which becomes fully operational starting in 2004, there are several terminal operators belonging to world leading companies in the industry of containerized traffic, like APM Terminal, (Maersk group) and COSCO Pacific. The port is divided into two parts, Port Said and Port Said East, the first featuring an 800 thousand TEUs capacity, and the second with 2.7 million TEUs. The infrastructure is spread over an area of 90 hectares with a draft raging from -14 m to -16.5 m and it comprises of 21 quay cranes. Trade rose from 1.62 million TEUs in 2005 to 3.96 in 2013. The development plans of the infrastructure include an expansion of up to 5.4 million TEUs. Damietta’s port was built in 1988, 8km west of the Nile estuary. The container terminal is managed by the Damietta Container & Cargo Handling Co. and is spread over 62.5 hectares and comprises of 4 quays. The draft is -14.5 m and it features 8 quay cranes with an annual capacity of 1.2 million TEUs. Some projects aimed at the realization of a new container terminal, which will expand the handling capacity up to 4 million TEUs, are currently ongoing. Thanks to these investments in these given ports, the principal maritime companies in the contai- ner field decided to include Egypt in their worldwide service network, contributing to significantly improve the Liner Shipping Connectivity Index (LSCI), elaborated by UNCTAD as a tool to monitor the trends in the sector. The index summarizes five elements of competitiveness in the maritime industry: number of ships; their container-carrying capacity in TEUs; maximum vessel size; num- ber of services; and number of companies that deploy container ships in a country’s ports. The table below shows Egypt’s prime position, higher than that of Turkey, Greece, Lebanon, Israel and Jordan. In the Middle East, no other countries recorded a similar improvement, therefore in this particular ranking Egypt follows only United Arab Emirates and Saudi Arabia. The development of the Suez Canal is part of an economic development path which saw the transport, maritime and port sector at the center of a number of enormous infrastructural and or- ganizational investments aimed at recovering efficiency in worldwide trades as witnessed by the improvements in Egypt’s position in the World Bank rankings (up by 35 positions in the Logistics Performance Index between 2007 and 2014) and in the UNCTAD world rankings where Egypt in 10 www.srm-maritimeconomy.com
2015 is 19th with a value of 61.5 compared to the 67.4 of Italy and to 68.8 of Japan, it rose three
positions compared to 2010.

Position of Egypt in the Liner Shipping Connectivity Index by UNCTAD *

Nation                             2010           2011          2012           2013    2014   2015

United Arab Emirates               63.4           62.5           61.1           67.0   66.5   70.4

Saudi Arabia                       50.4           60.0           60.4           59.7   61.2   64.8

Egypt                              47.6           51.2           57.4           57.5   61.8   61.5

Turkey                             36.1           39.4           53.2           52.1   52.4   52.0

Oman                               48.5           49.3           47.3           48.5   49.9   48.4

Greece                             34.3           32.3           45.5           45.4   47.2   46.8

Lebanon                            30.3           35.1           43.2           43.2   42.6   41.8

Israel                             33.2           28.5           31.2           32.4   31.8   33.2

Jordan                             17.8           16.7           22.8           22.7   22.6   26.2

Table 2 - Source: UNCTAD, Liner Shipping Connectivity Index report, various years
* China 2004 = 100.

Canal’s traffic trends and a synthesis of the
planning framework of the new infrastructure
Traffic trends
Since its opening in 1869, the Suez Canal has become the main transport route between Asia and
Europe. By changing the route of Magellan which travelled around the Cape of Good Hope, this
impressive feat of engineering significantly shortened the distances between the two continents,
increasing the safety of traffic and restoring the centrality of the Mediterranean as a crossroads
to the major shipping routes worldwide. If you consider a typical route between South East Asia
and Europe, such as Singapore-Rotterdam, the saving in terms of distance in respect to the route
which circumnavigates Africa is about 3,000 nautical miles, about 9 fewer days of navigation at a
speed of 15 knots. Evidently, shorter distance and time corresponds to lower costs of transport.
The importance of this route is confirmed if we consider the years between 1967 and 1975 when,
as a result of the tensions that followed the nationalization of the Canal by the Egyptian Gover-
nment and of the Six Day War, navigation in the Canal was prohibited causing a contraction in

www.srm-maritimeconomy.com                                                                       11
international trade and, along with other factors, one of the greatest recessions of the post-war
era. Interestingly, the first ship that crossed the Suez Canal on June 5, 1975, after eight years of
closure, was a ship of the Italian shipping company Ignazio Messina, which is headquartered in
Genoa and is a leader in the trade between the Mediterranean, the Red Sea and East Africa.
Between 7% and 8% of all the total cargo traded globally passes through the Canal3. In 2014 this
implied the passage of 822 million tonnes of products, 416 million of which went southward while
406 million went northward4.

Ships and cargo passing through the Suez Canal

Figure 1 - Source: Suez Canal Autority

Between 2000 and 2014 the trend in the sector were very positive (overall +123%) with south-
bound traffic which grew more (+162%) compared to the northbound ones (+94%). This differen-
tiated trend confirmed also itself in the first 6 months of 2015 compared to the same period of
2014 showing +7.7% in southbound traffic and a slight drop in northbound traffic (-1.2%) mostly
due to a reduction in the tonnage of crude oil (-21.7%).
About 53% of all the 2014 traffic was made up of container ships (55% northbound and 51%
southbound), 11% of these ships transported crude oil (17% northbound and 4% southbound),

3
    World Shipping Council, The Suez Canal - A vital shortcut for global commerce, 2014.
4
 The statistics discussed in the following paragraphs are collected by the Authority of the Suez Canal and made available
on the website www.suezcanal.gov.eg

12                                                                      www.srm-maritimeconomy.com
5% of the cargo was made up of grains (0.1% northbound and 9.3% southbound).
The containerized flows influenced the evolution of maritime transport through the Canal, in fact
they globally grew by 202% from 2000 to 2014 (although differently with reference to the routes).
As a matter of fact, north-south containerized trade volumes grew by 187% while the south-north
ones grew by 219%, and in 2014 reached a substantial balance (212 million tonnes north-south
and 222 million tonnes south-north). This result can be explained by looking at the operation of
international trade characterized by the phenomenon of globalization driven by the relocation of
production to countries with low labor costs, mainly in the Asian continent. In addition, over the
last few years, the use of sacks to stow into the container goods that previously used to be stowed
as bulk or general cargo has progressively led to the spread of containerization in a growing num-
ber of productive chains (coffee, cocoa, seeds, fertilizers and feed for fish). This partly explains
the contraction between 2000 and 2014 of some types of trades passing through the Suez Canal;
cement -96%, coal and coke -61%, timber -49%.
Along with containers, oil products are increasing significantly (crude oil, gasoline, diesel, naphtha,
LPG, other petroleum products) rising from 50 million tonnes in 2000 to 178 million tonnes in
2014 (+251%). Of this, 48%, which is the equivalent of 87 million tonnes, is represented by crude
oil. Between 2000 and 2014 the trade of crude oil between the Middle East and Europe grew by
205%, driven especially by traffic coming from the south, which grew by 40.7 million tonnes, up
from 28.2 to 68.9 million tonnes, over the same period.
In particular, considerable development came after 2009 when an historic low was recorded over
the last decade in northbound crude oil trade (15.7 million tonnes). From 2010 there was a radical
re-design of these flows substantially due to the block of extraction activities in Libya, balanced
by the oil from Saudi oil fields and the partial return on the European markets of the oil from Iraq.
It was also stabilized by the expansion of the Canal which made the transit possible for large oil
vessels to avoid a transit to the Cape of Good Hope thus creating new important flows in the Suez
Canal while supporting Egypt’s ambition in the refining sector.
Another extremely significant commodity traded through the Suez Canal is LNG which impres-
sively grew from 2 million tonnes in 2000 to 24 million tonnes in 2014 (+1,145%) This confirms
the trend which sees Europe switching to a more balanced energetic mix, using more natural gas
rather than traditional raw materials as coal.
The evolution of transport for grains is considerable too; from 17 million tonnes in 2000 to 39
million tonnes in 2014 (+127%), it reflects the change of some productive systems relevant for
Europe which, over the last years have become exporters of agricultural commodities notably as a
result of the growth in China’s domestic consumption and to the fact that this country buys most
of its grain from abroad5. As a result, the overall export of grains coming from the EU and Ukraine
5
Pitzalis S., “Mercato cereali, vige l’incertezza”, Agrinotizie.com, April 14th 2014.
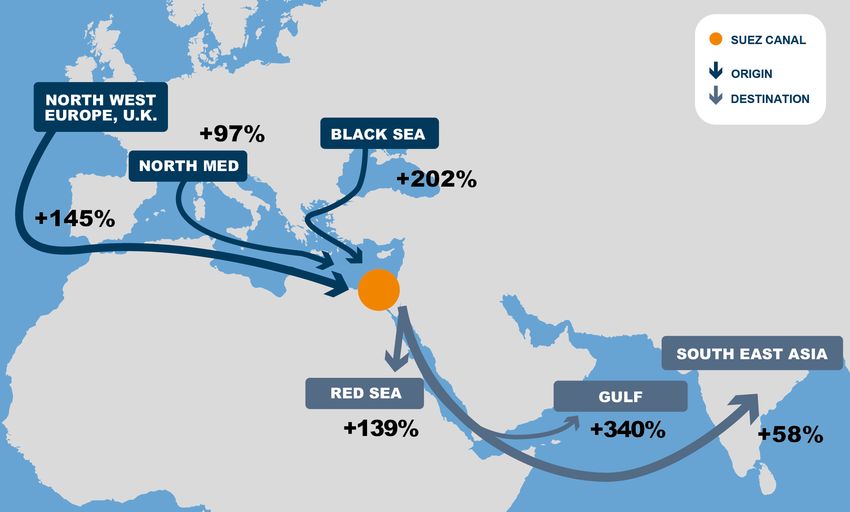
www.srm-maritimeconomy.com 13grew largely between 2006 and 2014 (+132%). The analysis of this traffic direction shows that while in 2001 and 2007 there was a clear preva- lence of northbound flows -57% on average - from 2008 there was a progressive and continuous shrinkage of transport from Asia to Europe which continued over the first half of 2015, reducing the amount of northbound flows by 49%. This outcome is due to the economic crisis which greatly affected European consumption in particular. The 2007-2009 period was noticeable as at the time the south-north passages through the Canal reduced drastically by more than 160 million tonnes. When observing the overall 2014 tonnage, it shows that trade by routes are not particularly unba- lanced although in the south-north route 2014 volumes are far from the peak reached in 2007 when it reached 424 million tonnes; the north-south traffic, on the other hand grew constantly reaching, in 2014 a record of 416 million tonnes, well above the 295 million tonnes in 2009. If one excludes container traffic which, as previously illustrated, has 50% of the weight, the com- position of some flows change, especially for energy products. In 2014 from south to north 68.9 million tonnes of crude oil passed through the Canal, equal to 17% of the total amount of traffic on this route. Larger volumes of refined products accounting for 14% travel on the opposite route while the amount of crude oil drops to 4%, equal to 18 million tonnes. All in all, there is a growing flow of crude oil intended for refinement travelling northward, while southward the traffic of ga- soline and naphtha, which are oil derivatives, is increasing. For goods travelling northwards the main target area is North-Western Europe which comprises of the Northern Range and United Kingdom that however grows at a reduced rate; by 12% between 2001 and 2014 from 110 million tonnes to 122 million tonnes. Over the same period, Northern Europe’s share on the total south-north transits through the Suez Canal fell from 52% to 30% mainly in favor of the Mediterranean which regained 22% thanks to the growth of the East and South-East of the Mediterranean (Egypt, Israel and Turkey) where in 2014 25% of the south-north traffic was bound for. In this situation, Western Mediterranean regains positions compared to Northern Europe; +3% between 2001 and 2014, just as Northern Mediterranean which recorded +2% over the same period. If one pays attention on the northward traffic, what clearly emerges is the increasingly crucial role of the Gulf as an origin of shipments. As a matter of fact, in 2014, 34% of the shipments (137 million tonnes) originated in this area which was second to Southeast Asia where the shipments amounted to 161 million tonnes. In 2001 the Gulf generated only 24% of the total amount of northbound traffic; about 49 million tonnes. This growth was determined by energy sector trends which are found in the Arabian region, the main mining area in the world. In addition, it is possible to conjecture that northward traffic originated in the Gulf come also from manufactures deriving from the high value logistics areas present in the region and particularly in the vast Special Econo- mic Zones of the UAE. 14 www.srm-maritimeconomy.com
The main south-north cargo flows in the Suez Canal: var % 2001-2014

Figure 2 -Source: SRM on Suez Canal Authority data (data available from 2001)

The main north-south cargo flows in the Suez Canal: var % 2001-2014

Figure 3 - Source: SRM on Suez Canal Authority data (data available from 2001)

* The cargo flows are represented by arrows whose thickness indicates the absolute value in terms of goods.

www.srm-maritimeconomy.com                                                                                    15
Destinations of northbound traffic
2014
3%
3%
10%
10% East
East, S.S.E.
East, , S.E.
Mediterranean
Mediterranean
E. Mediterranean
0%
0% 10% 10%1%
1%8%
8% 25%
25%
North
NorthMediterranean
North Mediterranean
Mediterranean
1%1%
17%
17% West
West,S.W.
West, S.W.
, S.W.
Mediterranean
Mediterranean
Mediterranean
Black
BlackSea
Black Sea
2001
North
NorthWest
North West
West Europe
Europe
Europe, , U.K.
, U.K.
U.K.
30%
30% 9%
9%
Baltic
BalticSea
Baltic Sea
2%
2%
52%
52% America
America
America
19%
19%
Others
Others
Others
1%
1%
12%
12%
Figure 4 - Source: Elaborations on Suez Canal Authority data, various years
Origin of northbound traffic
2014
0% 0%
3% 0%3% 0%
13% 13% Red SeaRed Sea
Red Sea
0% 6%0% 6% 0% East EastAden
Africa
East Africa, ,Africa
Aden , Aden
14% 14% 3% 3%0%
0% 0% Gulf Arabian
Arabian Gulf Gulf
24% 24% South South Asia
Asia
South Asia
40% 40% 2001
South East
South
South East Asia
East Asia
Asia
Far East
Far EastFar East
34% 34%
8% 8% Australia
Australia
Australia
45% 45%
Others
Others Others
10% 10%
Figure 5 - Source: Elaborations on Suez Canal Authority data, various years
As for north-south trades, the ongoing evolution is due to the dynamics regarding the target areas
in the Gulf. In 2014 this area received 83 million tonnes shipments through the Suez Canal amoun-
ting to 20% of the total goods passing through the Canal along this route (it was 12% in 2001). The
growth of the Gulf as a European exports target area was detrimental to Southeast Asia which
accounted for 46% in 2001 and for 46% in 2014. The above data shows that trade between Eu-
rope and the Gulf grew exponentially mainly as a result of the socio-economic dynamics which
characterized the countries in this area and which brought a remarkable growth of welfare and
the diversification of investments financed by revenues from the sale of crude oil.
16 www.srm-maritimeconomy.comOrigin of southbound traffic
2014
1%
0% 1%
15% 0% Red
RedSea
Sea
15% Red Sea
1% 0% 0% 25%
1% 0% 0% 25% East
EastAfrica
Africa, ,Aden
Aden
27% East Africa , Aden
27% Arabian
Gulf Gulf
Arabian Gulf
South
South Asia
Asia
46% South Asia
46% 2001 1% South
South East Asia
East Asia
1% 1% South East Asia
1%
28% Far
Far East
East
28% 12% Far East
12%
Australia
Australia
20% Australia
13% 20% Others
13% Others
Others
10%
10%
Figure 6 - Source: Elaborations on Suez Canal Authority data, various years
Origin of southbound traffic
2014
3% East , S.E. Mediterranean
7% 3% 15% East
East,, S.S.E. Mediterranean
E. Mediterranean
7% 15%
2% 2% 10% North Mediterranean
2% 6% 2% North
North Mediterranean
Mediterranean
4% 6% 10%
4% West , S.W.Mediterranean
Mediterranean
West
West,,S.W.S.W. Mediterranean
20% Black Sea
20% Black
Black Sea
25% 2001 19% North West EuropeU.K.
, U.K.
25% 19% North
North West Europe , U.K.
West Europe,
33% Baltic Sea
33% Baltic
Baltic Sea
Sea
9%
9% America
America
America
16% Others
16% 10% Others
Others
10%
19%
19%
Figure 7 - Source: Elaborations on Suez Canal Authority data, various years
Finally, a remarkable element regards the dynamics of containerized goods. Between 2000 and
2008 container traffic through the Canal grew at a 10.9% annual rate in terms of CAGR, (Com-
pound Annual Growth Rate). Over the same period there was also a progressive reduction of the
average weight per TEU, which fell from 10.2 to 9.5 tonnes. This trend in fact, is due to the re-po-
sitioning of empties as a result of a rebalancing of the trade on the Asia-Europe route; from 2.1
million TEUs in 2001 to 8 million in 2008. In 2008 northbound container traffic was higher than
those in the opposite direction by more than 32 million tonnes. In 2014 this difference shrunk to
10 million tonnes showing that the export of the European economic system was regaining its
competitiveness. Since 2009, in conjunction with a rebalancing of the flows, the average fill rate
www.srm-maritimeconomy.com 17per TEU increased again reaching 10.4 tonnes.
The analysis of the average TEUs transported per ship is particularly interesting, it progressively
rose during the period under examination: from 3,044 TEUs in 2000 to 6,863 TEUs in 2014. This
indicates the average growth of container ships passing through the Canal due principally to the
naval gigantism trend which has characterized the shipping industry over the last twenty years.
The new Suez Canal
The Suez Canal is one of the main hubs of world maritime trade and featured 17,000 ships in 2014
which meant, until the construction of the new channel, on average about 47 units per day. The
Canal spreads along 192km between the bay of Port Said and the Gulf of Suez and was meant to
permit the simultaneous transit of three vessels; from north to south (departing at 00.00 from
Port Said), from south to north, (departing at 06.00 from Suez) and from north to south (departing
at 07.00 from Port Said) with a crossing point at the Great Bitter Lake and at the Ballah by-pass.
The transit speed was limited to 6-8 knots and allowed to pass the Canal in 12-16 hours with a
distance of 2-3 km between the vessels which varied according to the type of load.
The Suez Canal generated for Egyptian Authorities revenues of over US $5 billion and in 2014 this
accounted for almost 2% of the Egyptian GDP6. More in detail, in 2014 the Suez Canal Authority
collected almost US $5,465.30 million meaning an average toll of more than US $318,713 per
ship7. The average revenue attributable to the Canal has significantly increased over the last few
years: in 2000 it only amounted to US $137,321 on average. The modernization of the Canal, inau-
gurated in August 2015, through a series of works on a stretch of 72km today allows the simulta-
neous transit of a greater number of ships, doubling by 50% the capacity of the previous channel.
The works included the excavation of a new 35km long route placed side by side to the old one
and the expansion and deepening of the present Canal on a 37km path. Furthermore the current
way will be dredged up to the depth of -24 m. The construction of six underground tunnels for the
passage of vehicles by road and rail connection with the Sinai Peninsula has also been planned.
Finally, the works include the deepening of the two by-pass: Great Bitter and Ballah.
The estimated cost for the overall project amounted to US $8.2 billion. The Egyptian army was in
charge of organizing and managing the execution of the work, which implied 25 national compa-
nies which were granted a concession. According to the press, the Egyptian Government declared
that the investment costs will not affect the Canal fares8.
6
CIA World Factbook 2015, considering the nominal GDP, calculated at current values in US dollars for the year 2014.
7
Suez Canal Authority, Brief Fiscal year Statistical Report, www.suezcanal.gov.eg.
8
Saleh H., “Sisi bolsters nationalist appeal with $8bn Suez Canal investment”, Financial Times, September 1st 2014.
18 www.srm-maritimeconomy.comAs a result of the works the daily capacity of the Canal increased by up to 97 vessels. If this new capacity is fully used, based on the Government’s estimates and taking into account the current fares, it would produce a potential increase in revenues of more than US $13 billion to 2023. The new Canal solves the issues related to the ships’ long waiting times at the entrance of the Ca- nal and at the by-pass points. The estimated average time for anchorage in the roadstead during transit in the Canal was a maximum of 18 hours. The overall navigational time amounts to 12-16 hours. The waiting time is a maximum of 3 hours. Egyptian authorities emphasized the construction of this new transport system and hypothesized a direct effect linked to a further growth of international trade between Asia, Middle East, Europe and the East Coast of the United States with an indirect effect strictly connected to support and logistics services to maritime and port activities. Along with the new Canal, the Egyptian Government developed the “Suez Canal Corridor Area Project” (SCZone), an enormous investment plan aimed at making the Canal region a center of economic development, thanks to the realization of research centers, industrial hubs, and logisti- cs areas along this connecting route between East and West. Within this context, the New Canal is a necessary but not sufficient condition for the success of this impressive initiative. The regional development plan for the Suez Canal Figure 8 - Source: Suez Canal Area Development Project www.srm-maritimeconomy.com 19
The SCZone project intends to promote the development in three areas of the region which have
immediate availability of space where infrastructures can be built on: Port Said in the north of the
Canal, Qantara (Ismailia) halfway between the two accesses and Ain Sokhna, in the south, in the
Gulf of Suez.
A plan from the Egyptian Government was presented in a Master Plan in March 2015 and more
detailed guidelines were provided in August 2015. The Master Plan sets 2030 and 2050 as deadli-
nes for the intermediate and final realization of the project. The focus of the project is the buil-
ding of an area which is able to compete with the principal European and Middle Eastern logistics
regions. These include Rotterdam, Hamburg and Jabel Ali while exploiting the Canal’s obligatory
passage points for trade between East and West as a central element. The project aims at taking
advantage of the large available areas in the region.
The Egyptian Government has also conceived a project for Port Said which includes the develop-
ment of the port by an increase in capacity of up to 20 million TEUs by 2050 through the building
of an infrastructure on an area exceeding 22,000 hectares, 2,600 of which are intended for the
port’s expansion.
At its full capacity, Port Said contains 3.3 million TEUs, but already by the end of 2015 a new area
in the port will come into operation and will allow an increase in the annual capacity amounting
to more than 5 million TEUs (the so called Phase 2). Port Said’s container terminal, also known
as “Suez Canal Container Terminal” (SCCT) is an infrastructure which came into operation in 2004
and serves as a transshipment port for the trades in transit in the eastern region of the Medi-
terranean9.The terminal works 24/7 and is managed by SCCT (Suez Canal Container Terminal), a
company controlled 55% by APM Terminal (Maersk group) and 20% by COSCO under a 49-year
concession. The remaining shares are held by local stakeholders; 10.3% belongs to the Suez Canal
Port Authority, 5% to the National Bank of Egypt and finally, while 9.7% is owned by Egyptian pri-
vate investors. Currently the terminal is used by Maersk Line, COSCO Pacific, K-Line, Yang Ming,
Hanjin, and CMA-CGM. The container terminal will be flanked with a solid bulk terminal, a general
cargo terminal, a terminal for the logistics of new and used cars and one for the storage of liquid
bulk with a 5 million tonnes capacity.
The dry port will include an industrial and residential area which will cover an area of 4,000 hecta-
res, 80% of which will be intended for manufacture. In the rest of the area of commercial activi-
ties, retail sales, and areas designated for residential use will prevail.
Thereafter, Port Said will be connected to the town of Ramadan in the center of Egypt, and in the
long term it will also be connected with Ain Sokhna through a line which parallels the Suez Canal.

9
    Shipping & Marine, “More than a phase”, June 19th 2014.

20                                                            www.srm-maritimeconomy.com
At the same time, halfway between Port Said and Ain Sokhna, around Ismailia, a residential area will be built in Qantara intended for light and small manufacturing industries, over an area of 670 hectares. Finally, the port hub of Ain Sokhna, south of the Canal, near Suez, will be fully developed. This port is already dealing with container traffic which is managed by DP World, one of the main terminal companies in the world. The Egyptian Government aims to develop the present port by building a container terminal featuring an annual handling capacity of 5.2 million TEUs, 6 quays and covering an overall area of 1,390 hectares. The container terminal will be coupled with infrastructures for the storage of liquid and dry bulks. The port of Ain Sokhna will be the access point to a new productive area with over 8,000 hectares behind the port. About 50% of this new productive site will be allocated for light productions, 20% for heavy industry, and the remaining areas will be for commercial and residential purposes. The expected impact on maritime trade Current challenges The building of the New Canal of Suez allows a reduction in, and a greater predictability of, transit times of the intercontinental east-west connection between Asia, Middle East, Europe and the east coast of the United States. Moreover, in the medium term it will address more effectively the request for a greater capacity. The new Canal increased its transit capacity to 97 ships compared to the previous average of 49 ships. The project’s objective was to maintain the strategic role of the Canal preserved within the geo- political panorama linked to international trade and, finally, the importance of Egypt between all major world markets. In this respect, Notteboom e Rodrigue (2011) point out that in the last few years new challenges arose for the Suez Canal as an intersection of the traffics between East and West10. The growth of piracy attacks in the sea area between Somalia and the Red Sea, for example, resul- ted in a higher cost of transit through the Canal, due to higher insurance premiums and a higher need for staffing and security systems. If in 2005 there were 45 pirate attacks to vessels naviga- ting the Gulf of Aden, the Red Sea and the international waters off the coast of Somalia, in 2011 they were 230. The increase in the expense due to piracy was estimated at US $100,000-115,000 per journey. However, attacks by pirates in the region experienced a drastic reduction, reaching Notteboom T., Rodrigue J. R., “Challenges to and challengers of the Suez Canal”, Port Technology International, Bernard 10 Henry, London, Autumn 2011. www.srm-maritimeconomy.com 21
a historic low in 2013, with 15 events. According to the International Maritime Bureau, Somali
pirates have been deterred by multiple factors; amongst them the key role of international navies
engaged in military control of these waters, the increased use of best practices by vessels, the use
of armed security teams on board and a situation of greater stability in the central government
of Somalia11.
The current arrangement of the Canal has reached its limit for transit of larger vessels, although
Suez allows for vessels larger than those allowed in the Panama Canal. Not surprisingly ships for
liquid bulk transport are generally classified by dimension, and the Suezmax are those ships with
the maximum dimension allowed in the Canal: gross tonnage between 120,000 and 200,000 ton-
nes, a maximum draft of 20.1 m, and width not exceeding 50 m. Larger ships cannot pass through
the Suez Canal; they are for example bulk carriers for transportation of crude oil, called Very Large
Crude Carriers and Ultra Large Crude Carriers, which can reach up to 320,000 gross registered
tonnes. Currently these ships travel on routes passing the Cape of Good Hope.
Traffic through the Canal also depends on the dynamics linked to the oil price trend. As pointed
out by Notteboom and Rodrigue, (2011) low bunker prices correspond to a greater availability
of shipping companies in order to extend the routes performing the so called slow streaming
routes12. In periods of capacity oversupply and low prices of bunker, shipping companies tend
to reformulate the routes thus lengthening the journey, as it happened in 2009 when A.P. Mol-
ler-Maersk, CMA CGM and the Kuwait National Petroleum Company moved part of their traffic
to the circumnavigation of Africa, although afterwards the increase in the bunker price led to a
change of policy.
The Cape of Good Hope route has margins for growth at the expense of the Suez, especially as re-
gards to the south-south trade in the Southern Hemisphere and especially with a strong economic
growth of the African continent in the forthcoming decades.
In addition to the Cape of Good Hope route, another issue of growing interest regards the possi-
ble development of the Arctic route which allows a saving of around 22% on a Far East-Northern
European connection, as is the case of Shanghai-Rotterdam.
This route, usually open between July and November, offers a considerable potential for deve-
lopment due to the large energy resources present in the area and not to the intercontinental
routes. It is estimated that about 13% of the global oil reserves and 30% of those of natural gas
are located in the Arctic Region. However, despite the obvious savings in terms of distance and
the recent improvements in infrastructure to support the safety of navigation, the Arctic route

11
  Confitarma, Relazione Generale 2014, Teseo Editore, Rome, 2014 and ICC International Maritime Bureau, “Piracy and
armed robbery against ships. Report for the period 1st January – 31st December 2014”, London, January 2015 and Middle-
ton R. , “Le conseguenze della pirateria nel Corno d’Africa”, Note Osservatorio di Politica Internazionale, n° 11, May 2010.
 Notteboom T., Rodrigue J. R., “Challenges to and challengers of the Suez Canal”, Port Technology International, Bernard
12

Henry, London, Autumn 2011.

22                                                                      www.srm-maritimeconomy.com
has some considerable operational limits due to the unpredictability of weather, thus requiring a
sailing cruise of about 8 knots which allows ships and vessels to anticipate problems linked both
to the presence of icebergs and to the need for a sudden change of direction in case of uncer-
tainty with respect to the depth of the muddy bottoms –with constant changes depending on the
meteorological conditions, often unsuitable to the passage of large ships.
This type of restriction makes the route inviable for the regular container services and it is also
off route with respect to the flows of oil products and grains. Even in future scenarios involving a
possible extension of the period of navigability, due to higher average temperatures in the area,
the Arctic route will have a very marginal role and will be complementary to the transits in the
Suez Canal, unable to be a real alternative for all the main flows that use the Suez route13.
In the light of the considerable investment made for the renewal of the main world Canals (Suez
and Panama14), it is particularly interesting to focus on the effects this may produce on the trades
between Asia and the East Coast of the United States, taking into account that the ships passing
through the Suez Canal and which depart from America account for 6.7% of the southbound flows
and 9.7% of the northbound ones.
As shown in the table 3, traffic between China and the East Coast of the USA (for example betwe-
en Hong Kong and New York) find the Panama Canal more convenient than the Suez Canal, if
the only factor taken into account is distance. Actually, over the years, the strategic choices of
shipping companies showed that there are a wide range of countries in Southeast Asia com-
prising of Southern China, Vietnam, Malaysia, Indonesia, Singapore and South Korea where the
competition between the two routes takes into account many other factors rather than nautical
distance alone. As a matter of fact, the strategic elements systematically considered by shipping
companies to decide the routes – and in the case of the major shipping companies usually both
service options are offered15, – include:
•    the possibility to apply economies of scale at their best in bunker consumption using large
     vessels (for example, exceeding the limit of 14,500 TEUs which will be the upper limit of capa-
     city to access the new Panama Canal that will be opened in the course of 2016);
•    the possibility to cross different routes on intercontinental hubs, fundamental for the balance
     of flows, like Colombo, Dubai, Port Said, Gioia Tauro, Malta, Algeciras, Tangier;
•    the cost of the Canals’ tolls.

13
  The study of the CPB Netherlands Bureau for Economic Policy Analysis (CPB), entitled “Melting Ice Caps and the Econo-
mic Impact of Opening the Northern Sea Route”, published in May 2015, indicates that about 66% of current traffic flows
crossing the Channel Suez are potentially interested in the Arctic Route, but the real chance that the meteorological
conditions and infrastructure development needed to make this change of route operationally possible are very remote.
14
  In mid-2016, after eight years of work and a government investment of more than US $5.2 billion, the new system of
locks and access routes will be able to increase the size of ships and reduce the time of transit in the connection Canal
between the Atlantic Ocean and the Pacific Ocean.
15
  This is, for example, the case of Maersk, that in 2015 offers TP10, TP11 and TP12 services on the Busan-Miami, Shan-
ghai - Shanghai-Charleston and Norfolk routes via Suez.

www.srm-maritimeconomy.com                                                                                          23
Analysis of the distance and time of navigation of some routes between Asia Europe and the East coast of the USA
The Shanghai-Rotterdam case
Route Distance (in nautical miles) Hypothetical days of navigation (15 knots)
Arctic Sea 8,031 22
Suez 10,525 29
Panama 13,411 37
Cape of Good Hope 13,843 38
Strait of Magellan 17,184 47
The Yokohama-Rotterdam case
Route Distance (in nautical miles) Hypothetical days of navigation (15 knots)
Arctic Sea 7010 19
Suez 11,133 31
Cape of Good Hope 14,448 40
The Hong Kong-New York case
Route Distance (in nautical miles) Hypothetical days of navigation (15 knots)
Panama 11,207 31
Suez 11,593 32
Cape of Good Hope 13,686 38
The Shanghai-New York case
Route Distance (in nautical miles) Hypothetical days of navigation (15 knots)
Panama 10,852 30
Suez 12,370 34
Cape of Good Hope 14,468 40
The Shanghai-Houston case
Route Distance (in nautical miles) Hypothetical days of navigation (15 knots)
Panama 10,138 28
Suez 13,932 39
Cape of Good Hope 15,176 42
The impact of the Suez Canal’s expansion
Route where Suez is already more competitive
Route where the potential competitiveness of Suez against Panama is considerable
Route where the potential competitiveness of Suez against Panama is evident
Route where there are no significant effects
Table 3 - Source: Authors’ elaborations on sea-distance.org information
24 www.srm-maritimeconomy.comA specific analysis conducted by specialized research firm Alphaliner16 on the choices by shipping
companies that offer services for container traffic on the route between the Far East and the East
Coast of the United States, showed that the 25 services offered in July 2015 were arranged so as
to benefit the via Panama route (16) compared to that via Suez (9). In terms of offered capacity,
the two routes are actually more balanced. As a matter of fact, 51% of the supply passes through
Panama (equal to 73.000 TEU per week and ships with an average capacity of 4.570 TEUs) compa-
red to 49% passing through Suez (70,000 TEUs and an average capacity of 7780 TEUs per ship). It
should be pointed out, however, that the data above (n. of services and capacity) are continuou-
sly changing as the thresholds of convenience change rapidly during the year. In fact, in February
2015 the number of services offered was 20, 12 of which were from via Panama and 8 from via
Suez, however Panama only accounted for 44% of the offered capacity. This confirmed a trend
which, in spite of a few fluctuations, saw a reduction on the capacity offered by Panama during
the last five years and also considering that in February 2010 74% of the offered capacity passed
through Panama. Over the last few months, the trend modified from 44% to 51% along with a
reduction in bunker price.
The increased predictability in the timeliness of the transit in the Suez Canal, the strengthening of
local transshipment hubs and the choice not to increase the Canal’s fares will be three elements
which will contribute to reducing the effects of increased competition, on the routes between
Asia and the East Coast of the United States, resulting from the massive expansion of the Panama
Canal whose opening is expected by mid 2016.
The development of multimodal corridors between Europe and Asia’s ability to compete with the
main maritime routes will represent another critical element to take into account when planning
the development of the Canal. In this regard, it should be noted that in 2014 there was a rapid
growth in direct railway connections between Asia — and particularly China — and Europe, per-
formed by many railway companies grouped in consortia and alliances, including the German DB
Shenker. However, just like the Arctic route, this alternative has a limited competitive potential
as the economic advantages are significant only on certain routes which originate or head to the
northern areas of China and Northern Europe. As a matter of fact, the organizational complexity
which derives from balancing the interests of many railway companies involved and the technical
limitations (numerous changes of locomotive and different track gauges) will halt the competitive
potential even in the long term, involving overall flows of less than 100-200 thousand TEUs, com-
pared to more than 40 million TEUs that have already crossed the Suez Canal.
Within this scenario, the most solid alternative – albeit feared by Egyptian Authorities – is the
project (still under study) of the Israeli government to build a high-speed rail alternative to the
Canal, linking the port of Eliaat in the Gulf of Aqaba on the Red Sea with to Ashdood in the Medi-
terranean Sea.
16
Alphaliner Weekly newsletter, n° 28, 2015.
www.srm-maritimeconomy.com 25You can also read