The Nuclear Fuel Report: Expanded Summary - Global Scenarios for Demand and Supply Availability 2019-2040
←
→
Page content transcription
If your browser does not render page correctly, please read the page content below
The Nuclear Fuel Report:
Expanded Summary
Global Scenarios for Demand and
Supply Availability 2019-2040
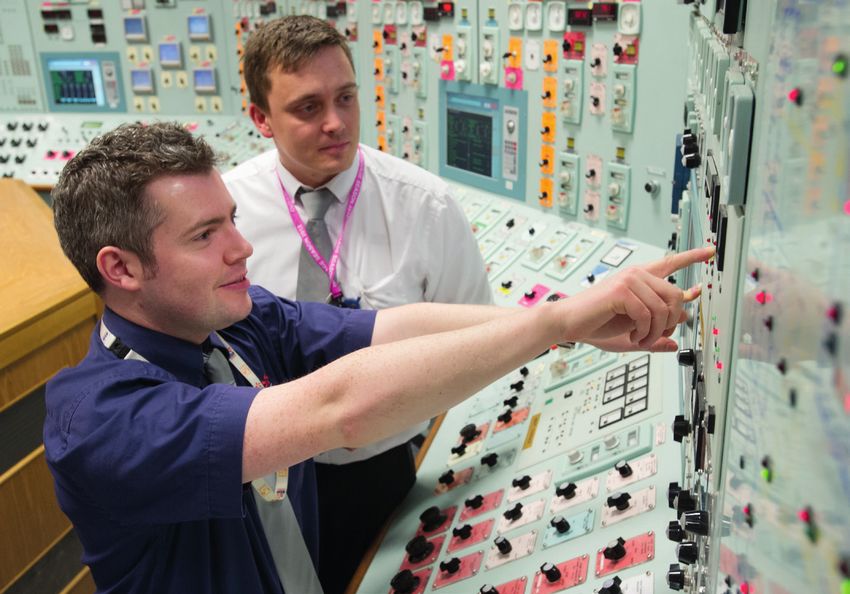
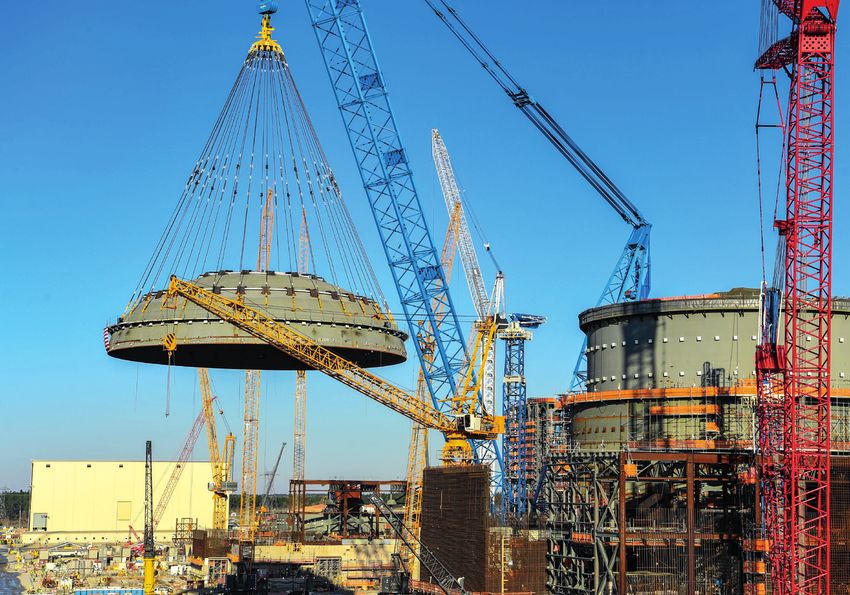
Title: The Nuclear Fuel Report: Expanded Summary –
Global Scenarios for Demand and Supply Availability 2019-2040
Produced by: World Nuclear Association
Published: June 2020
Report No. 2020/005

Cover images: EDF Energy; Georgia Power Company

© 2020 World Nuclear Association.
Registered in England and Wales,
company number 01215741

This report reflects the views
of industry experts but does not
necessarily represent those of any
of the World Nuclear Association’s
individual member organizations
The Nuclear Fuel Report: Expanded Summary
Global Scenarios for Demand and Supply Availability 2019-2040

Contents
1.    Introduction                                              2
1.1   Features of the nuclear fuel market
1.2   Energy and electricity demand
1.3   Factors affecting electricity demand growth
1.4   Factors affecting nuclear power growth

2.    The Nuclear Fuel Report methodology                   11
2.1   Supply methodology
2.2   Projection methodology and assumptions

3.    Scenarios for nuclear generating capacity             13

4.    Secondary supply                                      15
4.1   Concept of market mobility

5.    Uranium supply and demand                             19
5.1   Reactor requirements (uranium demand)
5.2   Overview of the uranium market
5.3   Recent uranium production
5.4   Primary uranium supply
5.5   Unspecified uranium supply

6.    Conversion supply and demand                          28
7.    Enrichment supply and demand                          30

8.    Fuel fabrication supply and demand                    32
9.    Key findings of The Nuclear Fuel Report               36
9.1   Uranium
9.2   Secondary supply
9.3   Conversion
9.4   Enrichment
9.5   Fuel fabrication

10. Harmony programme                                       39
Appendix tables                                             40
Drafting group                                              43

                                                                    1
1. Introduction
The World Nuclear Association has published reports on nuclear fuel supply and demand at roughly
th
two-yearly intervals since its foundation in 1975. The 19 edition of The Nuclear Fuel Report was
released in September 2019 and includes scenarios covering a range of possibilities for nuclear
power to 2040. Forecasts beyond 2040 are beyond the scope of the report and would require a rather
different approach to capture the larger range of uncertainty; however, the key issues examined in the
report are likely to have continued relevance during that longer period.
th
This Expanded Summary covers the key findings of 19 edition, and explains the methodology and
the assumptions underlying the report’s three scenarios for future nuclear fuel demand and supply.
The full version of The Nuclear Fuel Report can be purchased from the World Nuclear Association’s
online shop.
Nuclear power currently contributes over 10% of the world’s electricity
production and is expected to continue playing an important role in future
electricity supply for several reasons, including:
Nuclear power produces near-zero greenhouse gas and other
pollutant emissions.
Nuclear power is a reliable and secure power source, which is
particularly attractive to industrializing countries and those lacking
indigenous energy resources.
Nuclear power has long-term cost-competitiveness, compared with
the levelised cost of both fossil and clean energy sources.
There are many industrial and human-capital benefits associated
with nuclear energy’s development and use.
Despite these advantages, nuclear energy faces competitive challenges
from other electricity generation sources, especially in deregulated markets
as they are currently designed, along with continuing regulatory and political
hurdles. Furthermore, electricity demand growth has slowed down especially
in the countries where nuclear power is well-established. However, the
nuclear sector remains strong in many developing countries and it is in these
countries that the majority of nuclear capacity growth is expected.
1.1. Features of the nuclear fuel market
The nuclear fuel market operates in a very different way to other energy markets. Uranium
concentrate produced by a mine cannot be fed into a nuclear reactor directly; it has to be processed
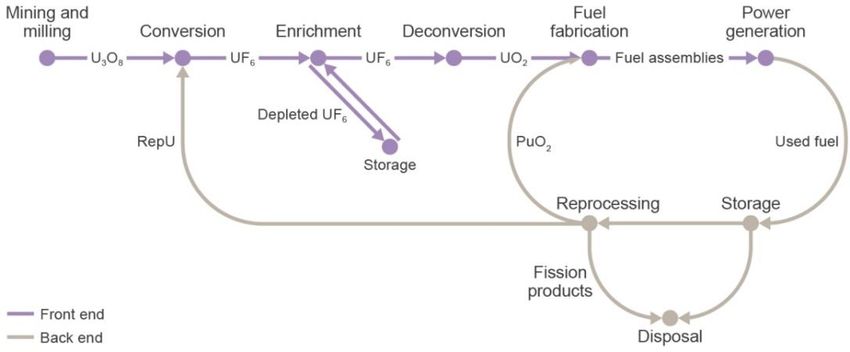
or pass through different stages of the nuclear fuel cycle (see Figure 1).
The nuclear fuel cycle is complex, beginning with the mining of uranium and ending with the disposal
of nuclear waste. In order to use uranium in a nuclear reactor, it has to undergo mining and milling,
conversion, enrichment and fuel fabrication. These steps make up the 'front end' of the nuclear fuel
cycle. The ‘back end’ refers to all stages subsequent to removal of used fuel from the reactor. The
2used fuel may then go through a further series of steps including temporary storage, reprocessing,
and recycling before disposal of remaining waste products.
Figure 1: The nuclear fuel cycle
The fuel cost in nuclear power has historically been a minor element of the total production cost. Fuel
costs (inclusive of uranium, conversion, enrichment and fabrication) typically comprise less than 20%
of the total cost of electricity for a modern nuclear power plant, compared with up to 80% in fossil fuel-
fired plants.
Uranium supply can be characterized by two main categories: primary and secondary supply. Primary
supply refers to uranium that is newly mined and processed, while secondary supply includes uranium
received after reprocessing and returned back to the fuel cycle.
Primary production has recently (2013-2017) represented about 90% of the global reactor demand.
Primary uranium production is characterized by relatively broad geographical distribution (in 2018
uranium was produced in 14 countries), and also by a large number of companies representing major
and junior uranium miners. The intermediate stages of the nuclear fuel cycle – conversion, enrichment
and fuel fabrication – are services provided by specialist companies.
Secondary supply includes natural and low enriched uranium inventories, high enriched uranium,
mixed uranium and plutonium oxide (MOX) fuel, reprocessed uranium and re-enrichment of depleted
uranium. Secondary markets for uranium, conversion and enrichment services are well-established,
currently meeting about 15% of demand. However, the recycling of nuclear material depends largely
on political as well as economic factors.
An important feature of the nuclear fuel cycle is its international dimension. Whilst uranium is relatively
abundant throughout the Earth’s crust, but distinct trade specialization has occurred, due partly to the
high energy density and therefore the low costs of transport, in comparison with coal, oil and gas. For
example, uranium mined in Australia can be converted in Canada, enriched in the UK then fabricated
as fuel in Sweden for a reactor in South Africa. Recycled reactor fuel may follow similar international
routes, with their related political as well as economic implications.
A further aspect of the nuclear fuel cycle’s international dimension is the amount of licensing,
surveillance and national and multinational regulations in place throughout the fuel cycle to ensure
that safety and non-proliferation objectives are met. These are administered by governments, regional
3organizations, such as the Euratom Supply Agency in the EU, and by the International Atomic Energy
Agency (IAEA).
The political influence on the uranium market has always been significant. Decisions taken to
increase uranium production, to build new reactors, and to allow new fuel cycle facility construction,
trade or transport in nuclear materials to take place, often contain significant non-economic
dimensions.
1.2. Energy and electricity demand
Nuclear power must be regarded within the wider framework of trends in energy demand and supply.
The World Nuclear Association does not prepare its own forecasts of world energy and electricity
demand and supply, but relies on the analyses of international organizations such as the International
Energy Agency (IEA) and others. The IEA in particular uses general equilibrium modelling of energy
markets that explicitly incorporates the interactions of different sectors and the relationship of the
energy sector to the wider economy. The World Nuclear Association scenarios are based on expert
opinion from within the nuclear industry and may usefully be compared with the IEA’s nuclear
scenario forecasts.
The IEA’s World Energy Outlook 2018 (WEO 2018), published in November 2018, describes three
scenarios for global nuclear capacity based on different policy responses to climate change and the
need to reduce greenhouse gas emissions from fossil fuels (see Table 1). The central ‘New Policies’
scenario projects the impact of new measures, but on a relatively cautious basis, including broad
policy commitments that were announced as of August 2018. The ‘Current Policies’ scenario projects
the continuation of policies existing in mid-2018, excluding some ambitious targets declared by
governments around the world, and the ‘Sustainable Development’ scenario projects the
implementation of policies aiming to achieve the Paris Agreement’s goals of keeping the increase in
the global average temperature to well below 2°C above pre-industrial levels.
1
Table 1: IEA and World Nuclear Association nuclear capacity scenarios for 2040, GWe
WEO New Policies 518 WNA Reference 569
2018 Current Policies 498 2019 Lower 402
Sustainable Development 678 Upper 776
The drivers for the World Nuclear Association scenarios embrace broader changes than climate
change policy alone. The Reference Scenario is largely a reflection of current government policies
and plans announced by utilities for nuclear in the next 10-15 years, which (with a few significant
exceptions) are generally rather modest.
While the Reference Scenario only assumes that officially announced plans are realized, taking into
account country-specific considerations, the Upper Scenario takes into consideration other
implications and projects how nuclear can develop if the overall landscape would be more favourable.
In contrast to the IEA Current Policies scenario, the Lower Scenario does not foresee a noticeable
impact of climate change policy and mainly focuses on other factors; for example, it is assumed that
1
The IEA figures are gross GWe while the World Nuclear Association figures are net GWe, i.e. net of process
requirements. Net capacity is typically approximately 4-5% lower than gross capacity.
4nuclear becomes economically uncompetitive against the decreasing cost of intermittent renewables,
that there is a lack of political and/or public support for nuclear energy, and that the importance of
security of electricity supply and grid resilience are not sufficiently valued, amongst other factors.
A key advantage of nuclear is its proven ability to provide reliable and
economic base-load power on a near zero-carbon full life-cycle basis. For
example, it is worth mentioning that in the US alone, nuclear energy
currently provides around 55% of the country’s carbon-free electricity, and in
the European Union it accounts for 53% of the region’s carbon-free
electricity.
In 2018 the world's nuclear power plants supplied 2,563 TWh of electricity
through 396 GWe of operable capacity. This avoided the emission of 2.2
billion tonnes of carbon dioxide compared to the equivalent amount of coal
power generation, in addition to total avoided emissions of around 60 billion
tonnes since 1970. Nuclear power also avoids the emission of pollutants
including oxides of sulfur and nitrogen, and is therefore favoured by some
countries as a solution to combat air pollution.
In the future, nuclear energy could contribute substantially more given the
expectation of rapidly rising electricity demand and the changes in energy
consumption. The transport sector offers great potential with electric
vehicles, and programmes to implement higher use of passenger electric
vehicles are under way in numerous countries worldwide. Apart from
electricity generation, nuclear represents a credible low-carbon source of
process heat for various applications, such as district heating, water
desalination, oil and chemical refining, and hydrogen production.
Whilst policies aimed at curbing greenhouse gas emissions should help to create a level playing field for
nuclear, a preference for energy market liberalization by policy-makers may hinder the take-up of
nuclear power if this leads to shorter-term investment horizons. Nuclear power plants take longer to
build than, for instance, gas-fired plants, and have considerably higher initial capital investment.
Therefore, if electricity prices are unpredictable, this may tend to favour quicker payback projects such
as gas over the long-term commitment that is necessary to make a nuclear project financially viable.
1.3. Factors affecting electricity demand growth
There are many factors that affect electricity demand growth, some of the most important are
explained below.
Population growth, urbanization and electrification
Electricity demand is correlated with population growth. Indeed electricity demand growth has been
more than double that of population since 2000. With almost one billion people without access to
electricity globally, the extent to which large developing nations achieve universal access to electricity
will be a key driver of demand growth. Compounding the effect of population growth is the trend
towards urbanization.
5Global economic growth Economic growth rates affect electricity demand, both industrial and household, particularly in developing economies where growing incomes and standards of living enable new consumption of domestic appliances, and domestic cooling and heating. However, in advanced economies growth in gross domestic product has a lower correlation with electricity demand, primarily due to energy efficiency initiatives. Electrification of transport The electrification of transport has played an important role in reversing projected power demand declines in developed industrial economies and in supporting grid power growth in China. The most visible electrification is that of passenger vehicles, with global plug-in vehicle sales increasing three- fold from 773,600 in 2016 to 2.1 million in 2018. Initiatives are under way in numerous countries to expand the electrification of motorcycles, buses, trucks, trains and water transport to reduce urban pollution and vehicle emissions. The effectiveness of emissions reduction measures relies on low- emission electricity for charging transport, providing an opportunity for nuclear power. Alternative generation technologies Competition between generating technologies has changed significantly in recent years. Nuclear power has to compete with alternative generating technologies both in meeting the demand for electricity from existing plants and especially for new investment. Given nuclear energy’s relatively low operating costs, generation from an existing nuclear plant would expect to provide baseload power over an extended period. However, in some circumstances these expectations no longer hold. For example, in the USA, Entergy’s Pilgrim nuclear plant was shut down early for economic reasons, and four reactors operated by FirstEnergy Nuclear Operating Company (Beaver Valley 1&2, Davis- Besse, Perry) are scheduled to close prematurely during the next two years if the financial situation does not improve, with some other US plants at risk. For plants closed prematurely, diminished revenue expectations were a factor in the decision. Regarding new investment, alternative generation technologies can decrease expected returns and therefore also the relative attractiveness of nuclear. The ability to exploit shale gas on a commercial basis has transformed the economics of gas-fired power generation in the USA. The natural gas resource base has been greatly increased by the addition of unconventional gas. Moreover, the cost of exploiting natural gas has fallen. Unconventional gas is widely available and the total cost of transporting gas to the customer has fallen. Gas prices in the USA have essentially remained below $5/mmBTU since 2011, the price at which gas-fired generation can be expected to start undercutting nuclear. The availability of low-cost gas combined with a lower than expected level of power demand has affected the decisions of some US utilities to invest in nuclear capacity uprates as well as in new reactors. As with any source of energy, the exploitation of unconventional gas bears risks, including the productivity and longevity of wells, the impact on water resources and other environmental concerns, the outcome of which will become apparent only over time. At the global level, there is considerable uncertainty as to how far unconventional gas might be developed in other parts of the world. To date, the widespread exploitation of unconventional gas appears to be largely a US phenomenon. The EU is believed to have quite extensive resources but to date exploitation has yet to be demonstrated and in some countries hydraulic fracturing and even exploration have been prevented by regulation. China has made significant efforts to identify and scope its unconventional gas resources which appear to be very significant. In other countries where nuclear is an important contributor to electricity generation such as South Korea, Russia and India, little information on unconventional gas has been made publicly available or exploration activities are at an early stage. 6
The development and promotion of renewable energy over the last decade or so has resulted in new
sources of power generation. The driving force behind renewable generation has been mainly the
political decision to set high levels of subsidies – under the form of power purchase agreements, tax
credits, amongst others – for renewables; the implementation of constraints on greenhouse gas
emissions has not been set yet at a level that would significantly reduce fossil generation. The
intention of policy-makers has been to develop the market for renewables not only to provide low-
carbon electricity but also to reduce the costs of renewable power. Politicians have expressed the
hope that subsidy support can be reduced and eventually removed, and in some countries – for
example Germany, Spain and the UK – this has happened to a degree.

The ambition to induce lower renewable costs has been met with limited success for bioenergy and
geothermal, with some success for onshore wind power and considerable success for solar power.
However, in the EU, where renewables have received the highest levels of support, the generation of
renewable power sits uneasily with existing power market structures and practices. Intermittent
renewables, such as solar and wind, generate power with very low operating costs yet incur high
capital costs. These power sources generally bid into the power market at very low (even negative)
prices and greatly increase the volatility of supply. This volatility reduces the capacity factors of other
producers, including nuclear, as well as increasing the maintenance costs arising from frequent
changes in output.

When the renewable generation is intermittent (as with solar and wind) the system costs related to
guaranteeing supply increase. These system requirements include extensive additional
transmission infrastructure, back-up generating capacity and energy storage. A 2019 study by the
OECD Nuclear Energy Agency shows that when intermittent renewables supply more than 30% of
the electricity generated, system costs will grow exponentially and may double the price of
electricity to the final end user.

Grid storage technology
Challenges associated with the intermittency of renewables are hoped to be partly addressed through
the introduction of large-scale grid storage. Technologies such as pumped storage hydroelectricity,
lithium-ion batteries and vanadium flow batteries have been deployed at a commercial scale for both
stability enhancement and stored power release. Pumped hydro has been effective in limited
geographic circumstances where suitable infrastructure already exists. Lithium-ion battery storage
has been challenged by competition for resources in the electric vehicle market, limitations associated
with cycle times and the cost of scaling up to meet grid demands. Vanadium flow batteries have
demonstrated superior performance and lifecycles, although large-scale deployment is challenged by
vanadium supply availability and price volatility resulting from consumption from the steel industry.
The timeframe for commercialization of other technologies in the research and development stage
remains uncertain.

It is increasingly apparent that battery storage will not be available or affordable on the required
scale during the next few decades for mid- to long-term storage. Besides pumped hydro, which has
a very limited potential worldwide, there are some expectations placed on new technologies such
as power-to-X and hydrogen energy storage, but these are not yet developed and the b usiness
models are uncertain.

                                                                                                         7
1.4. Factors affecting nuclear power growth There are many factors that will determine the rate of growth of nuclear power around the world. The most important of these factors are outlined below. Operating lifetime extensions For the purposes of planning or licensing, the operating lifetime of most types of reactor was considered to be 40 years. However, recent years have seen a strong trend towards operating lifetime extensions beyond the initial design lifetime. Operating reactors are subject to continuous upgrading and replacement of components, as well as rigorous licensing and inspection regimes. It is expected that many, if not most, reactors will operate beyond 40 years and therefore apply for extended operational lifetimes. Licence extensions offer the possibility of much extended operating lifetimes and are the most economic way of generating power beyond the design lifetime period. Carbon neutral energy sources The global imperative to constrain climate change has seen widespread policy support for renewable energy that has led to dramatically increased use of these energy sources over the last decade. However, despite these policy interventions, global CO 2 emissions continued to rise in 2017 and 2018, widening the gap between current global emissions and the trajectory required to limit climate change to 1.5°C (or even 2°C) above pre-industrial levels. The nuclear power industry is achieving increasing recognition for its clean energy credentials amongst policy-makers, environmentalists and the public. There is also increasing awareness of environmental and societal effects from land consumption and decommissioning of solar energy, as well as public resistance of onshore wind turbines. The degree to which this recognition results in government policies supporting existing and future nuclear energy production will be a key factor affecting the growth prospects for nuclear fuel demand. The potential for government policy to play a positive role for nuclear energy will depend on many factors. Should governments increase the urgency with which they seek to decarbonize energy production, nuclear power stands to benefit from policies to avoid early closure of reactors and enable operating lifetime extensions. Government policies to reduce base-load coal consumption are, in many countries, only achievable through displacement by other base-load sources, such as gas, hydroelectric power or nuclear power. Given environmental hurdles associated with hydroelectric power installations and carbon emissions from gas, nuclear power is the logical choice for coal displacement in most instances. However, many governments have been cautious in supporting nuclear power because of the vocal role of interest groups, who have opposed nuclear power for both ideological and competitive reasons, and also because of the complexity in assessing either system costs or the socio-economic contributions of nuclear. Air pollution imperative for clean energy in growth markets Air pollution is an acute challenge in two of the most important growth markets for nuclear power: China and India. Over the last two years, both nations have experienced instances of widespread urban particulate pollution vastly exceeding acceptable limits. Awareness of the health effects of air pollution has grown dramatically, with estimated deaths from air particulate exposure, in part due to coal-fired power, numbering in the millions per annum. This led the Chinese government in 2017 to promise to “make the skies blue again” and enact broad policy measures to control air pollution. Immediate measures have included suspending 8
factories and reducing vehicle traffic during air crises, as well as cancelling and suspending
operation of coal-fired power plants. Longer-term policies are directed at displacing coal power with
clean energy, ensuring that clean energy sources would be used to meet the increasing future
energy demand as transport transitions to become electrified and energy sources for domestic
heating and cooking are centralized.

Nuclear power is positioned particularly well as a solution to Chinese urban air pollution. As a
baseload power source, nuclear offers the preferred source of energy to displace coal-fired power
without sacrificing grid stability. China is the world leader in hydroelectric power production, but there
are environmental, social and multi-lateral constraints to expanding this energy source further.
Moreover, most of China’s air pollution crises occur during low pressure weather conditions in winter
when solar power generation is seasonally low and still conditions reduce or suspend the contribution
of wind power.

Although policies to reduce air pollution are already supporting the expansion of nuclear power in
China and India, the extent to which this could add further impetus to nuclear approvals and
construction in both countries depends on the effectiveness of current policies in addressing air
pollution and the extent to which other clean energy sources can contribute to reducing thermal
power. For instance, if efforts to reduce air pollution from industry and domestic cooking/heating fires
are not sufficiently effective then further measures may be required to displace coal-fired power.
Similarly, if intermittent renewables underperform at crucial times or put too much pressure on grid
stability, there is an opportunity for nuclear power to play a greater role in the clean energy mix.

Geopolitical security of supply
Nuclear power has a number of features that can be expected to continue to appeal to energy policy-
makers in many countries. The most important of these is its contribution to a country’s security of
energy supply. Nuclear power plants consume relatively little fuel compared with fossil-fired plants,
which means that, if it is thought necessary, several years’ supply can easily be stockpiled. Uranium
is in any case available from a diverse range of countries spread around the world, making major
disruption from primary suppliers unlikely. Countries with nuclear programmes are thus less exposed
to large swings in fossil fuel prices and to supply disruptions (such as occurred in the 1970s), as well
as to currency fluctuations.

There are also heightened fears today about dependence on imported energy, given the
concentration of oil and gas reserves in a limited number of countries. Indeed, this was the main
motivation for countries such as France and Japan taking the decision to pursue substantial nuclear
programmes in the 1970s, after the first oil crisis. Today this argument has returned, particularly in
Europe with increasing dependence on gas imports but also in East Asia, which is responsible for an
increasing share of the international trade in fossil fuels.

Geopolitical tensions have increased over the last two years, perhaps to levels not seen since the
collapse of the Soviet Union, as a result of trade disputes, tensions on the Korean peninsula,
instability in the Middle East, and the return of Cold War rhetoric between the USA and Russia.
These tensions are likely to lead to an increased focus on energy security, which will benefit
nuclear power growth.

Grid resilience
The large-scale expansion of intermittent renewables has placed increasing pressure on grid
infrastructure and reduced the grid resilience to non-conducive weather conditions and climatic

                                                                                                        9
aberrations such as the hurricane and extreme cold events experienced in the USA in recent years. For example, the weakening of the polar vortex in 2014 and 2019 resulted in extreme low temperatures in the USA, causing widespread power disruption. In many regions nuclear power was the only power source, with renewables unable to function and coal and gas power supply chains left disabled by extreme conditions. Nuclear power’s role in offering grid stability in all climatic conditions has led to increased recognition of the economic and social value of grid resilience, particularly in developed industrialized nations, evident by the US Federal Energy Regulatory Commission launching proceedings in 2018 to examine the resilience issue. This trend is likely to continue as weather volatility due to climate change increases and the penetration of intermittent renewables increases. Improved economics The cost of nuclear generation mostly depends on the initial capital cost of reactor construction, with nuclear fuel representing only a minor proportion of total production cost. Accordingly, changes in the capital costs of new nuclear have substantial impacts on the lifetime cost-competitiveness of nuclear power compared with other energy sources. Over the last decade the nuclear sector has endured several examples of large cost overruns in the construction of first-of-a-kind reactors. In addition to the financial burden this places on vendors and financiers, these outlying capital costs have increased the average capital costs attributed to the nuclear sector and the perceived cost of nuclear power. Furthermore, the detractors of nuclear power frequently use these figures selectively in order to portray nuclear power as being more expensive than alternative energy sources. Fortunately, the nuclear power sector is currently in a phase of improving capital costs and, therefore, economics. This is partly as a result of moving through the inevitable first-of-a-kind construction phase associated with new reactor models. More significant, however, are the cost benefits associated with reactors being built in significant numbers around the world. Moreover, Chinese and Korean reactor builds have demonstrated a substantial improvement in construction time and up-front capital cost, which is likely to continue. In recognition of the need to improve both the perception and reality of nuclear construction costs, the industry is focused on a range of initiatives to reduce construction times, costs and risk. Continued progress in reducing the capital cost of new nuclear builds will have a substantial impact on the relative economics of nuclear power and, therefore, its growth. New financing models Reactor vendors have continued to evolve to meet the needs of governments and power utilities, particularly in new markets and developing nations. This evolution has included the emergence of build-own-operate reactor packages, with the provision of associated finance. The continued development of this method of financing reactor construction may help to a certain extent to expand the market for nuclear reactors and therefore reactor demand. Cost of capital is a key component in the total cost of nuclear power. Large-scale reactors require large capital spending over a long period of construction before generating any revenue. Financing costs may therefore add 30-50% to the cost of construction. In order to reduce costs, the industry and developers have to reduce the construction time and cost, and should also discuss with governments new financing schemes where risk is appropriately allocated, to lower the cost of capital. Given that 10
nuclear power is such a key contributor to economy, governments should play a significant role in
their development, similar to the measures implemented for renewables development.

Superior safety record of nuclear
Public acceptance of nuclear reactors typically requires host communities to consider nuclear
power on its merits through the evaluation of facts. One of the most relevant facts supporting
nuclear power is its superior safety record – a fact that is not widely understood by the public.
Independent analysis of the fatality rate of the full lifecycle of various energy sources (including
renewables) has confirmed that nuclear power is the safest form of energy ever used when
measured as deaths per TWh generated.

Furthermore, as more evidence becomes available on the effects of radiation exposure, bodies such
as the United Nations Scientific Committee on the Effects of Atomic Radiation have concluded that
low-to-moderate exposures to ionizing radiation present significantly less danger to health than is
commonly perceived. As these statistics become better understood, public acceptance of nuclear
power can be expected to increase.

Long-term storage/reprocessing solutions
Another potential barrier to public acceptance of nuclear power is concern over the permanent
storage of waste products. The industry continues to make progress with the development of long-
term storage facilities in Finland, France and other countries, together with ongoing development of
fast neutron reactors and reprocessing technologies.

Advanced reactors
A number of advanced reactors are under development, including SMRs, floating reactors and fast
neutron reactors. As these advanced reactors have distinct advantages and applications, they have
the potential to expand nuclear power beyond large-scale Generation III/III+ reactors. Whilst some
designs have passed through the regulatory and demonstration stages, the total impact on nuclear
power growth will depend on the timing of their development.

2. The Nuclear Fuel Report methodology
The Nuclear Fuel Report follows previous practice by making extensive use of information from the
World Nuclear Association’s members who represent all aspects of the nuclear fuel cycle on a
worldwide basis. Some of these contributions have been made via working groups made up of
member representatives. The cut-off date for information input was 30 June 2019.

Questionnaires to both World Nuclear Association member and non-member organizations active in
the fuel cycle were used to help produce the projections for nuclear capacity and uranium production
included in this report. In addition, commercially sensitive information on inventories was requested,
the confidentiality of which was secured by having answers compiled by a firm of accountants, with
only regionally aggregated data being provided to the World Nuclear Association. The information in
the questionnaires was supplemented by judgements applied by the Association and its working
group members, based on published material and other information deemed to be accurate. Sources
of information include regular reports produced by industry participants, conference papers, and the
publications of public bodies such as the Energy Information Administration (EIA) in the USA and the
Euratom Supply Agency (ESA) in the EU.

                                                                                                   11
The projections for fuel requirements were generated by a proprietary model developed at the World
Nuclear Association over many years, incorporating the key operating characteristics of reactors
throughout the world.
2.1. Supply methodology
For any mineral resource, the future availability of supply depends on many factors beyond the
geological availability of the mineral. Uranium supply can also face political and policy uncertainties in
some jurisdictions. For this reason, both primary and secondary supply sources are classified
according to two main groups:
Specified Supply. Supply that is either known or has a sufficient degree of certainty so that its
volume and timing can be predicted.
Unspecified Supply. Supply that is either unknown or lacks a sufficient degree of certainty so
that its volume and timing cannot be predicted.
This classification is applied to each category of supply within the report, including secondary supply
(see Figure 2). Those supply sources allocated to Specified Supply are identified in the supply stack
for each component and, in general, include primary supply, secondary supply, and future supply.
2
Those supply sources allocated to Unspecified Supply , in general, comprise unspecified secondary
supply sources and future primary supply that at this time cannot be predicted with any degree of
certainty due to technical and economic factors, as well as policy constraints.
Figure 2: Methodology of specified and unspecified supplies
2
The concept of Unspecified Supply as it relates to secondary supplies is discussed in detail in Sections 4.2 and
specifically in relation to uranium supply in Section 5.6 of The Nuclear Fuel Report.
122.2. Projection methodology and assumptions
Individual country nuclear capacity scenarios are formulated by a World Nuclear Association working
group, taking into account responses to a questionnaire survey and publicly available information.
New reactor additions for each country and area are considered on the basis of existing plans and
policies within three categories: those under construction; those in the planning and licensing process;
and those which are proposed but on which no firm commitments have been made. Where official
nuclear targets or objectives have been published, they are used to inform the Reference Scenario
projections, with any adjustments to timings or levels of the targets deemed necessary by the drafting
group. In countries where the official objective is to limit or reduce the nuclear contribution, this is
factored into the projections. The Upper Scenario projections consider where realistic opportunities
exist for improved plans for existing and new reactors. In the Lower Scenario, plans for new reactors
may be scaled down or cancelled.
For existing reactors, the projection includes an estimation of the operating lifetimes, which is based
on consideration of technical, licensing and policy issues within the framework of each scenario.
3. Scenarios for nuclear generating capacity
To reflect the range of uncertainties which surround any projection, three scenarios are considered;
these are referred to as the Lower, Reference and Upper Scenarios. No attempt is made to attach
probabilities to the scenarios. In principle, the starting point is that all three must be entirely
plausible as representations of future events and are thus worthy of the reader’s consideration. If a
scenario is judged to be very unlikely it would not be included in the report. Although there is a
natural tendency to consider the Reference Scenario as the most probable, the Upper and Lower
cases should not be ignored, as they are considered to be fully plausible, depending on underlying
political and economic trends.
In every scenario the impact of the following factors to the development of nuclear energy is
3
analysed :
Economics of nuclear power generation
The level of political (energy policies)/public support to nuclear energy
Energy mix decarbonisation
Electricity market structure/security of electricity supply
Regulatory standards.
As of mid-2019, world nuclear capacity was 398 GWe (including the idled Japanese reactors). In the
Reference Scenario this is expected to rise to 462 GWe by 2030 and to 569 GWe by 2040. In the
Upper Scenario, the equivalent figures are 537 GWe in 2030 and 776 GWe in 2040. In the Lower
Scenario, nuclear generating capacity is effectively flat throughout the forecast period (see Figure 3).
3
Three scenarios are examined in Section 2.4.1 of The Nuclear Fuel Report.
13Figure 3: Nuclear generating capacity scenarios to 2040, GWe
Figure 4 compares the new scenarios with those of the 2017 edition of The Nuclear Fuel Report
showing the following results: the Upper Scenario and the Reference Scenario almost overlap with
the 2017 projections before 2035, and keep rising 2035-2040; the Lower Scenario is significantly lifted
(10% annually on average), turning the previous declining trend into a slightly increasing one.
Figure 4: Comparison of 2019 and 2017 generating capacity scenarios, GWe
Since the publication of the previous edition of The Nuclear Fuel Report in September 2017, there has
been a reversal of the negative trend in nuclear industry development. For the first time since March
2011, this led to a positive trend in nuclear capacity projections over the forecasting period in all three
scenarios presented in the 2019 report. There are four main reasons for this:
In France, the country’s energy policy was modified, delaying the timeline of planned
reduction of nuclear power in the share of its electricity mix to 50% from the previou s
2025 target to 2035, and allowing operating lifetime extensions of existing reactors
beyond 40 years.
14 In the USA, state legislatures are starting to pass measures that support the continued
operation of reactors, recognizing the valuable role of nuclear in providing low-carbon
electricity. At the same time, the process of granting a second operating licence extension for
US nuclear reactors has begun, allowing reactors to operate for 80 years.
Both China and India have extensive nuclear expansion programmes. The Reference
Scenario projects nuclear generation capacity in India to grow more than six times to
approximately 41 GWe from the current level of 6.2 GWe; and China is expected to reach
almost 179 GWe in the Reference Scenario, quadrupling its current nuclear capacity.
The prospects for new reactors in many countries have improved with several newcomer
countries launching construction projects (e.g. Turkey, Bangladesh, Egypt) and several more
demonstrating a clear interest in developing nuclear programmes (e.g. Uzbekistan,
4
Kazakhstan, Poland) .
4. Secondary supply
Secondary supplies may be defined as the material other than primary production, sourced to satisfy
reactor requirements. There is a broad spectrum of secondary supply sources including, but not
limited to, commercial and governmental inventories, stockpile drawdowns, fuel assemblies no longer
useable in reactors (e.g. in Japan, Taiwan, Germany and the USA), and use of recycled materials of
various types. In the widest sense, secondary supplies may be regarded as previous uranium
production returned to the commercial nuclear fuel market.
For the purposes of this report, all secondary supply sources are divided into two major groups.
Specified Supply – secondary supply that comprises supply sources that have been specifically
identified to enter the market in a form, quantity, and timeframe that can be estimated or predicted to
a reasonable accuracy. For these sources, three scenarios of future secondary supply are provided
5
for uranium, conversion and enrichment .
Unspecified Supply – secondary supply that contains the sources that do not offer an adequate level
of predictability in terms of expected time of market access or availability for consumption, for several
reasons, including limitations in information sources, arbitrary and proprietary policies of individual
entities, technical challenges, geopolitics, and economics. In terms of the limited predictability of this
group’s material, its degree of mobility is included as a new element in the 2019 edition of The
6
Nuclear Fuel Report . Table 2 shows the allocation of secondary supply sources among both groups.
4
A country-by-country analysis of nuclear programmes is detailed in Section 2.4.2 of The Nuclear Fuel Report
5
Three scenarios of secondary supply for uranium, conversion and enrichment are discussed in detail in Section
4.4 of The Nuclear Fuel Report.
6
The concept of market mobility is discussed in the section ‘Nuclear Fuel Report methodology’ above and
examined in detail in Section 4.2.1 of The Nuclear Fuel Report.
15Table 2: Secondary supply categorized as Specified and Unspecified supply
Category of secondary supply Specified sources Unspecified sources
Major commercial inventories (U3O8, UF6, EUP) x
Unusable fresh fuel bundles (EUP) x
Other government stocks x
Spent fuel and products derived from it x
US DOE material inflows
- High assay depleted uranium (DUF 6) x
- High assay low-enriched uranium (HALEU) x
- Environmental management (EM) transfers of natural UF 6 x
- Energy Northwest (ENW) depleted UF 6 (DUF6) x
Plutonium recycled as MOX x
RepU recycled as ERU x
Underfeeding x
Tails re-enrichment x
These categories of secondary supply originate from various stages of the nuclear fuel cycle. A
categorization of secondary sources of supply by originating stage is given in Table 3.
Table 3: Categorization of various secondary supply sources by originating stage
Originating Type of initial Marketable forms of
Economic role Owners
stage secondary sources secondary materials
• Natural U3O8, UF6;
Commercial entities
(producers, traders, utilities)
Commercial inventories • LEU as UF6, UO2, fabricated fuel
Targeted (desired)
and its feed/SWU components
products
Pre-irradiation in Governments and their Military-related materials • LEU from surplus weapons-grade
nuclear reactors contractors and depleted uranium HEU
(front-end) Commercial entities
• Natural uranium equivalent as UF 6
(enrichers) or governments
By-products (including Legacy tails and from tails
and their contractors
underfeeding) underfeeding
Commercial entities • LEU from tails or underfeeding as
(enrichers) UF6
• Reprocessed uranium
• Enriched reprocessed uranium
Commercial entities or (ERU) mostly as UO2
Post-irradiation in Reusable products governments and their • MOX fuel containing plutonium from
nuclear reactors contractors Recycled materials spent fuel or defence
(back-end) • Unprocessed spent fuel (potential
source)
By-products of recycled Commercial entities • LEU from irradiated tails (DSIU)
materials (enrichers) • Depleted RepU as UF6 or UO2
Uranium that has been mined and held as inventory for a period of time before it is further processed
is the simplest form of secondary supply. This inventory normally accounts for only a relatively small
portion of total supply. However, in the current market situation, given historic low U 3O8 prices, this
source has become more significant not only for primary producers and utilities, but also for numerous
7
intermediary parties (e.g. traders, investment funds, banks) .
The majority of secondary supplies are derived from uranium that has undergone transformation in
reactors, enrichment plants and reprocessing facilities. The second largest potential secondary
resource by mass is the world’s inventory of not-yet-treated used nuclear fuel, held largely at
reactor sites. It is categorised as a future potential resource, as, up to now, used fu el in most
7
Commercial inventories are examined in detail in Section 4.3.1 of The Nuclear Fuel Report.
16countries remains destined for interim storage rather than for further use in the nuclear fuel cycle in
the medium term.
A substantial quantity of used nuclear fuel has already been reprocessed in the civil nuclear sector,
leading to separated plutonium and uranium. These are gradually being used as mixed oxide (MOX)
8
fuel and enriched reprocessed uranium (ERU) fuel . Natural uranium requirements so far displaced by
these sources are relatively modest. The future developments in reprocessed uranium (in ERU fuel)
and plutonium (in MOX fuel) utilization depend primarily on back-end policy and the timely availability
of the supply chain to process these materials. ERU and MOX fuel developments are therefore
influenced only marginally by natural uranium market price levels.
Depleted uranium (known also as ‘tails’) is the largest form of potential secondary supplies by
mass. Tails offer a number of opportunities for future use, although not all tails re -enrichment is
economically viable.
The potential for underfeeding enrichment plants is also an important source of secondary supply. In
certain circumstances, particularly if enrichment capacity is underemployed as it is today, it can be
financially and operationally worthwhile for an enrichment facility to have an operational tails assay
below the level that was contracted with the customer, making use of more enrichment capacity. This
so-called underfeeding of the facility ‘creates’ some surplus uranium which can be sold. In this report,
underfeeding is regarded as an additional source of secondary supply as it has become increasingly
important in the current market.
4.1. Concept of market mobility
Regarding the availability for consumption, it is important to differentiate between primary supply and
secondary supply. Primary supply refers to fresh fuel in the form of uranium, conversion, enrichment
or fabricated fuel that is transferred from a producer to a consumer, either directly or through various
intermediaries. In contrast, secondary sources often require additional operations or processing (e.g.
reprocessing or recycling) applied to the material (many of them highly technical in nature) before it
can be returned to the nuclear fuel cycle at various stages. Further processing (at conversion,
enrichment or fuel fabrication facilities) also extends the time needed for certain secondary sources to
re-enter the market and become available to the consumer.
The Nuclear Fuel Report examines the degree of mobility of Unspecified secondary supply. The
concept of ‘degree of mobility’ is the availability of the supply source to access the market and
contribute to satisfying reactor requirements. A source’s mobility does not necessarily refer to
its movement (for example, from a non-end user to an end user); rather, any ability of the
source to offset the need for newly-produced uranium, conversion, or enrichment concerns its
degree of mobility.
In other words, a supply source with the highest degree of mobility is the one that is available for
immediate consumption – the most relevant here would be fabricated, utility-owned fuel inventory that
can be consumed in a reactor almost immediately. Alternatively, an example of a source with a very
low degree of mobility would be spent fuel that requires reprocessing but resides in a district that does
not have a reprocessing programme.
8
More details about recycling of materials from reprocessing could be found in Section 4.3.6 of The Nuclear
Fuel Report.
17Thus, sources of Unspecified secondary supply can be divided into two major parts:
A high degree of mobility but insufficient predictability in terms of quantity and timing of
consumption (e.g. commercial inventories and some government stocks).
A notable future potential for market access but low degree of mobility due to any number of
commercial, policy, technical, and/or capacity-related limitations (e.g. spent fuel or products
derived from it).
9
Three scenarios of future secondary supplies for uranium are compared in Figure 5. As can be seen
in all scenarios, the share steadily declines to 2040. In the Reference Scenario, secondary supply
provides 15% in 2019, 11% in 2025, declining to 8% in 2030 and ending up at 5% in 2040, with
shares a few percent higher for the Lower Scenario and a few percent lower for the Upper Scenario.
Figure 5: Secondary supply scenarios for uranium, tU
For the near term picture, secondary supplies are currently at a level of around 10,000 tU/yr for all
scenarios, slightly declining to 8,000 tU/yr towards 2028 and staying in the range of 5,000 to 7,000
tU/yr from 2030 to 2040.
9
Three scenarios of secondary supply for conversion and enrichment could be found in Section 4.4 of The
Nuclear Fuel Report.
185. Uranium supply and demand
5.1. Reactor requirements (uranium demand)
The World Nuclear Association’s reactor requirements model was revised for the 2019 edition of The
Nuclear Fuel Report, with a reassessment of the various factors affecting nuclear fuel demand, such
as enrichment levels, characteristics of first core loads and fuel burn-ups. For the first time, fast
neutron reactors were included in the model. Capacity factor assumptions, for current and future
reactors, were revised and updated using the most recent data.
Forward reactor requirements can be calculated knowing the nuclear generating capacity in operation
together with various data about reactor operations and fuel cycle characteristics (e.g. load factors,
tails assay, burn-up level). This provides a good measure of how much fissile material and fuel cycle
services will be required to prepare the fuel to be physically loaded into reactors in a given year. The
World Nuclear Association bases its demand projections in this report on such calculations, using
data provided by utilities and from other sources about reactor operations and fuel cycle
characteristics. Reactor requirements are a measure of the longer-term demand for nuclear fuel. They
underpin many of the multiannual supply contracts negotiated in the market. However, current primary
uranium production levels and other market activity are not closely related to requirements.
Primary production levels in the short term are much more closely related to expected utility
procurements in the next few years. Although utility requirements may also be partly met from other
sources, such as inventories held by producers, traders or governments, utility procurement is the
main driver of primary production in the short term. For longer-term planning of production levels (e.g.
decisions on investments in new mines), reactor requirements will be the more important indicator. As
this report covers a period of 20 years, reactor requirements are the principal demand measure
considered. Whenever the term ‘demand’ is used, it means ‘reactor requirements’.
5.2. Overview of the uranium market
The uranium market is primarily composed of transactions between:
Producers or suppliers (uranium miners, convertors, enrichers or fuel fabricators).
Public and private electrical nuclear utilities or fuel consumers.
Various other uranium market participants that buy and sell uranium (agents, traders,
investors, intermediaries).
These organizations carry out a great number of daily transactions, entering into short-term (spot) or
long-term contracts to buy or sell uranium ore concentrate (U3O8). However, the main aim of this
report is to consider reactor uranium requirements, which is driven by utilities (as the main buyers)
and comprises the vast majority of primary uranium demand, along with primary uranium supply, i.e.
the uranium produced by miners, which might be displaced by other forms of uranium, such as UF 6,
EUP or secondary sources.
Figure 6 shows how uranium production and reactor requirements are distributed around the globe,
listing the major uranium producing and consuming countries.
19Figure 6: Uranium production and reactor requirements for major producing
and consuming countries, as of end 2018, tU
Utilities have a relatively stable demand for uranium based upon the amount needed to manufacture
the fuel for operating their reactors. They typically purchase their requirements a number of years in
advance, due to the long time taken to process and convert natural uranium into fuel assemblies, as
well as to hold some strategic inventory based on their perception of future supply risk. Long-term
contract arrangements suit utilities because they know their likely requirements many years in
advance. The stability and certainty associated with such arrangements also suit the uranium miners
on the other side of the long-term contracts.
World reactor requirements for uranium in 2019 are estimated at about 67,600 tU. In the Reference
Scenario, these are expected to rise to 84,850 tU in 2030 and 100,000 tU in 2040. In the Upper
Scenario, uranium requirements are expected to be about 103,500 tU in 2030, and 137,600 tU in
2040. These requirements are relatively consistent with those for the same scenarios in the 2017
edition of The Nuclear Fuel Report (2019 through 2035). Requirements in the Lower Scenario are on
average 10% higher compared than in the 2017 edition.
Geologically established resources of uranium globally are more than adequate to satisfy reactor
requirements to well beyond 2040. Uranium resources are quite widely distributed around the world
and Table 4 shows the distribution of resources by country. Three countries traditionally lead this list:
Australia hosts the largest total resources (26% of the total), with Kazakhstan and Canada having an
almost equal resource base, roughly 11% of the total each.
2010
Table 4: Uranium resources by country in 2017, ranked by 2017 total , thousand tU
2017
Reasonably Inferred
Country assured resources resources Total
Australia 1,401 654 2,055
Kazakhstan 435 470 905
Canada 593 254 846
Russia 260 397 657
Namibia 369 173 541
South Africa 260 190 449
Niger 336 89 426
China 137 154 290
Brazil 156 121 277
Ukraine 138 81 219
India 149 8 157
Uzbekistan 58 82 139
United States 101 NA 101
Others 425 502 926
Total 4,815 3,173 7,988
5.3. Recent uranium production
After peaking in 2016, uranium production then decreased as a result of deteriorating market
conditions. This reduction in production was led by Canada, where the biggest mine, McArthur River,
was idled at the beginning of 2018, and Kazakhstan, which in 2017-2018 ceased its continuous
expansion programme to follow a ‘market-centric’ approach that reduced production for at least three
years. As the existing production centres shut down or idled capacity, as well as reduced production
levels, capacity utilization factors fell globally. For example, in October 2017 Areva NewCo (now
Orano) announced a 20% reduction of uranium production at its Somair mine in 2018, effectively
achieving a 15% reduction of uranium production at both its uranium mines in Niger in 2018.
In aggregate, uranium production showed a decreasing trend over three consecutive years from 2016
through to 2018. The results of these production changes can be seen in Table 5 above. In fact, if
McArthur River’s nameplate capacity of 9,616 tU/yr were included in the 2018 figures, then the
industry capacity utilization would have been an all-time low of 63% instead of 72% (see Table 5).
10
The resources in this table are recoverable resources in theYou can also read