Carbon Flows in the Energy Transition - Extension of the project "Renewable Methane for Transport and Mobility"
←
→
Page content transcription
If your browser does not render page correctly, please read the page content below
Final report

Carbon Flows in the Energy Transition

Extension of the project "Renewable Methane
for Transport and Mobility"
Date: 28.05.2019

Place: Rapperswil

Publisher:
HSR Hochschule für Technik Rapperswil EPFL Valais Wallis
CH-8640 Rapperswil CH-1950 Sion
www.iet.hsr.ch http://www.ipese.epfl.ch

Co-financed by:
Swiss National Science Foundation
CH-3001 Berne
http://www.snf.ch

Federal Office for the Environment FOEN Swiss Federal Office of Energy SFOE
Air Pollution Control and Chemicals Division
CH-3003 Bern CH-3003 Bern
https://www.bafu.admin.ch www.bfe.admin.ch

Authors:
Zoe Stadler, HSR Hochschule für Technik Rapperswil, zoe.stadler@hsr.ch
Boris Meier, HSR Hochschule für Technik Rapperswil, boris.meier@hsr.ch
Prof. Dr. Markus Friedl, HSR Hochschule für Technik Rapperswil, markus.friedl@hsr.ch
Dr. Theodoros Damartzis, EPFL École Polytechnique Fédérale de Lausanne,
theodoros.damartzis@epfl.ch
Dr. Stefano Moret, EPFL École Polytechnique Fédérale de Lausanne
Xiang Li, EPFL École Polytechnique Fédérale de Lausanne
Marcello Borasio, EPFL École Polytechnique Fédérale de Lausanne
Prof. Dr. François Maréchal, EPFL École Polytechnique Fédérale de Lausanne

SNF Steering Committee President: Prof. em. Dr. Hans-Rudolf Schalcher, ETH Zurich
SNF Programme Manager: Dr. Stefan Husi, Swiss National Science Foundation, Berne

The authors of this report bear the entire responsibility for the content and for the conclusions
drawn therefrom.
Summary
In the project “Carbon Flows in the Energy Transition”, a methodology is developed to monitor and
assess the energy and carbon flows in the energy system of Switzerland. As the flows of carbon, either
in the form of released CO 2 or stored in chemicals, are linked to the form and operation of the energy
system, the design of the latter is crucial. Since the defossilization of the energy system is an important
part to reach climate agreement goals, emphasis is given in renewables and biogenic carbon-containing
resources, such as various forms of biomass and waste.
The potential of carbon and energy sources in Switzerland are evaluated in the first part of the project.
In Switzerland, there is a yearly potential of 3.2 Mt wood (dry substance) and 3.1 Mt non-woody biomass
(dry substance) for energetic use. Another carbon source is carbon dioxide from air or flue gases. While
air has a small carbon dioxide content of 410 ppm, industrial sources provide flue gases with higher
concentrations: cement plants (3.29 MtCO2/y), waste incineration plants (4.25 Mt CO2/y) and sewage-
treatment and biogas plants (1.1 MtCO2/y). Renewable energy sources are restricted as well. The above
mentioned potential of wood corresponds to 14 TWh/y. The energy strategy from the Swiss Federal
Office of Energy (SFOE) calculates with a potential of 38.6 TWh/y hydro power and 4.3 TWh/y wind
power. A newly published study shows a potential for PV and thermal solar energy of totally 67 TWh per
year, installed on roofs and building faces.
In the first part the demand in heat, mobility and electricity is evaluated as well. In the year 2017, the
demand in space heating was 66.4 TWh/y, in hot water 12.7 TWh/y, in high temperature process heat
26.5 TWh/y and the demand in electricity was 40.9 TWh/y. Passengers travelled in total 132' 200 Mpkm,
and freight was transported over 44'000 Mtkm. The demand in electricity was covered by hydro dams
(20.72 TWh/y), running river hydro plants (15.95 TWh/y), nuclear power plants (19.50 TWh/y), combined
heat and power plants, incl. waste incineration (2.80 TWh/y), PV (2.28 TWh/y) and wind power plants
(0.22 TWh/y). Heat and mobility was covered by fossil fuels: Light fuel oil (35.54 TWh), Natural gas
(33.03 TWh), diesel (31.82 TWh), gasoline (27.67 TWh) and jet fuels (21.10 TWh). Wood provided with
13.73 TWh also a large amount of energy. Heat pumps produced 4.64 TWh, and 0.69 TWh heat was
provided by thermal solar.
In the second part of the project, energy and carbon conversion technologies (around 120 in total) were
evaluated. These technologies include power plants, technologies for heating, cogeneration, mobility
and transport, as well as biomass technologies, power-to-X-technologies and others.
The resulting data is incorporated into the existing infrastructure of Swiss EnergyScope (SES), an
optimization algorithm for the design of energy systems and applied for the case of Switzerland. Using
a formulation to account for the carbon content of the various streams within the energy system, both
the energy and carbon flows can be tracked during the design of different scenarios related to future
energy policies. A selected number of indicative scenarios are presented that can be used to investigate
the necessary future actions towards nuclear phasing-out, defossilization and CO 2 taxation to name a
few, with regard to the energy and carbon emissions profile of Switzerland.

 3/86
Contents
Summary.................................................................................................................................................3
Contents .................................................................................................................................................5
List of abbreviations ..............................................................................................................................7
1 Introduction ................................................................................................................................8
1.1 Background and motivation .........................................................................................................8
1.2 Goals ...........................................................................................................................................8
1.3 Similar Projects ............................................................................................................................9
1.3.1 Power-to-X ...................................................................................................................................9
1.3.2 Biomass .......................................................................................................................................9
1.3.3 Models ...................................................................................................................................... 10
2 Carbon Sources ...................................................................................................................... 12
2.1 Woody biomass ........................................................................................................................ 14
2.2 Non-woody biomass ................................................................................................................. 15
2.2.1 Crop farming ............................................................................................................................. 16
2.2.2 Animal farming .......................................................................................................................... 16
2.2.3 Waste........................................................................................................................................ 17
2.2.4 Industrial food and meat production ......................................................................................... 18
2.3 Carbon dioxide ......................................................................................................................... 18
2.4 Imports ...................................................................................................................................... 20
3 Carbon Demand ...................................................................................................................... 21
3.1 Mobility and Transport .............................................................................................................. 21
3.1.1 Passenger and Freight Mobility ................................................................................................ 21
3.1.2 Planes ....................................................................................................................................... 21
3.2 Heat .......................................................................................................................................... 22
3.3 Chemicals and Plastics ............................................................................................................ 22
3.4 Negative Emissions .................................................................................................................. 24
4 Conversion Technologies ...................................................................................................... 25
4.1 Biomass to X............................................................................................................................. 25
4.1.1 Wood to Bio-Crude ................................................................................................................... 27
4.1.2 Wood to Biomethane ................................................................................................................ 27
4.1.3 Wet Biomass to Biogas ............................................................................................................ 27
4.1.4 Wet Biomass to Biomethane .................................................................................................... 28
4.1.5 Biomass to alcohols .................................................................................................................. 29
4.1.6 Biomass to synthetic liquid biofuels .......................................................................................... 29
4.2 Carbon Dioxide to X ................................................................................................................. 30
4.2.1 Carbon Dioxide to Methanol ..................................................................................................... 34
4.2.2 Carbon Dioxide to Methane ...................................................................................................... 34 5/86
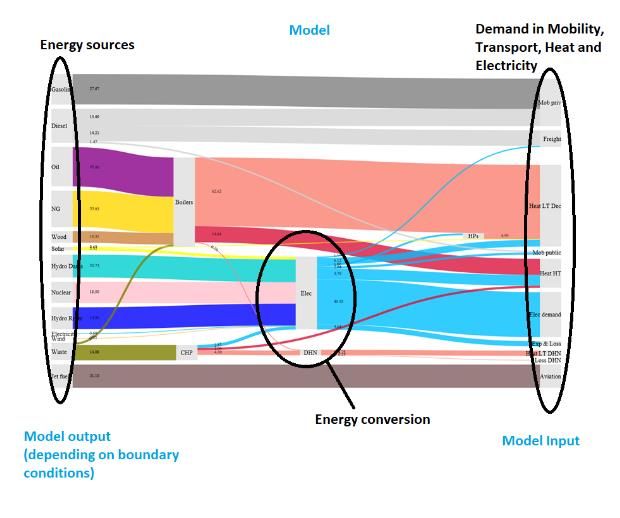
4.2.3 Carbon Dioxide to LNG ............................................................................................................ 35
4.2.4 Carbon Dioxide to Jet Fuel ....................................................................................................... 36
4.3 Other Conversion Technologies ............................................................................................... 38
5 Model ....................................................................................................................................... 40
5.1 EnergyScope ............................................................................................................................ 40
5.1.1 Modelling approach .................................................................................................................. 41
5.1.2 Model description ..................................................................................................................... 41
5.1.3 MILP – Mixed Integer Linear Programming .............................................................................. 41
5.2 Carbon Flows Model ................................................................................................................. 42
5.3 Sankey Diagrams ..................................................................................................................... 45
5.4 Costs ......................................................................................................................................... 46
6 Scenarios................................................................................................................................. 47
6.1 Scenario 1 - Today ................................................................................................................... 49
6.1.1 Heat from renewable sources................................................................................................... 49
6.1.2 Electricity .................................................................................................................................. 49
6.1.3 Mobility...................................................................................................................................... 50
6.1.4 Model Validation Results .......................................................................................................... 51
6.2 Scenario 2 - Nuclear phase-out ................................................................................................ 54
6.3 Scenario 3 - Electric cars .......................................................................................................... 56
6.4 Scenario 4 - Cheapest heating system .................................................................................... 59
6.5 Scenario 5 - Ban on fossil fuels and nuclear phase-out ........................................................... 61
6.6 Scenario 6 - CO2 taxes on fossil fuels ...................................................................................... 64
6.7 Scenario 7 - New energy policy ............................................................................................... 67
7 Discussion of results ............................................................................................................. 71
8 Conclusions and outlook ....................................................................................................... 74
9 Publications and Presentations ............................................................................................ 75
10 References .............................................................................................................................. 76
11 Appendix ................................................................................................................................. 80
11.1 Product Specifications .............................................................................................................. 80
11.2 Electricity production ................................................................................................................ 81
11.3 Heating and cogeneration technologies ................................................................................... 82
11.4 Mobility and Transportation ...................................................................................................... 85
11.5 Imported Chemicals and Plastics (Data from SwissImpex) ..................................................... 86
List of abbreviations
BEV Battery electric vehicle
CCGT Combined cycle gas turbine
CCS Carbon Capture and Storage
DACS Direct Air Capture and Storage
EPFL École Polytechnique Fédérale de Lausanne
FOEN Federal Office for the Environment
HEV Hybrid electric vehicle
HSR Hochschule für Technik Rapperswil
HVACR Heating, Ventilation, Air Conditioning and Refrigeration
IGCC Integrated gasification combined cycle
GWP Global warming potential
NG Natural gas
NRP National Research Programme
PHEV Plug-in hybrid electric vehicle
RMTM Renewable Methane in Transport and Mobility
SFOE Swiss Federal Office of Energy
SNF Swiss National Science Foundation
US Ultra-supercritical

 7/86
1 Introduction
In the context of the energy transition, there is much debate about energy flows and decarbonization.
Little account is taken of the fact that carbon will continue to be indispensable for many applications
after the energy transformation, such as plastics, chemical products and jet fuels. As source for these
carbon based products, biomass as well as carbon dioxide can be used. Especially the latter may play
a crucial role, as carbon dioxide is available in large amounts and so far this by-product is left unused.
In the project "Carbon Flows in the Energy Transition" an algorithm has been developed that models
and allocates energy and carbon flows, in order to design efficient energy systems and identify the
optimal energy and carbon paths, from carbon source (e.g. biomass or carbon dioxide) to carbon-based
products (e.g. plastics or fuels). The objective function of the optimization can include economic and/or
ecological aspects and the produced results help to derive decisions regarding the energy policy that
can ultimately lead to efficient political measures. Although this algorithm is targeted towards the
modeling of the carbon flows with a case study of Switzerland, it is of a generic structure and can be
adapted for other energy systems of different scales as well.
In April 2018 the project “Carbon Flows in the Energy Transition” started as an extension of the project
“Renewable Methane in Transport and Mobility (RMTM)”. It is carried out by a team both from
Hochschule für Technik Rapperswil (HSR) and École Polytechnique Fédérale de Lausanne (EPFL). The
project is part of the National Research Programme NRP70 and financed by the Swiss National Science
Foundation (SNF), the Swiss Federal Office of Energy (SFOE) and the Federal Office for the
Environment (FOEN) as well as by own funds.

1.1 Background and motivation
In order to reduce emissions from fossil fuels and to build an economy that is sustainable both
ecologically and economically, various research projects have been carried out. These projects usually
focus on one technology pathway and usually deal with the corresponding system disregarding the
potential synergies of the resources with other technological pathways or energy systems. For example,
biomass can be used either for biofuels, bioplastics or for heating by combustion. The ongoing project
“Carbon Flows in the Energy Transition” is part of the National Research Programme NRP 70 “Energy
Turnaround”. It takes a holistic approach and looks at all carbon flows associated to bio-based
resources, flue gases, biofuels, biochemicals and plastics within Switzerland and across the borders
(imports and exports).
For a successful energy turnaround, energy and product flows within Switzerland have to be
investigated, with special regard to future demand. To form a fossil-free future of Switzerland, policy
makers have to take measures. To determine which measures are most effective, this project traces the
carbon flows in Switzerland and evaluates different pathways depending on different operating
scenarios. The answers given by the project in the context of designing the optimal energy system with
respect to a variety of operating modes will hint towards the necessary actions to be taken for a
successful implementation in a fossil-free future.

1.2 Goals
Based on given forecast, the goal is the evaluation of scenarios to understand which are the most
efficient pathways of carbon flows and therefore to take the most effective political measures. Questions
like the following are answered in this project:
• What are the carbon resources in Switzerland and what will be their role as products or
 energy carriers? How much biomass is there in Switzerland (sustainable potential)?
 • What are the available conversion technologies for biomass (cost, efficiencies, etc.)?
 • What are the most cost and environmentally efficient ways of using limited biomass
 resources to meet the decarbonization targets?
 • What are the technologies and the technoeconomic conditions of the integration of carbon
 sequestration and reuse in Switzerland?
 • Should we use SNG directly for mobility or for electricity production and electric mobility?
 • What will be the role of carbon harvesting and reuse in the energy transition and what will
 be the impact in terms of fossil CO2 emissions?

1.3 Similar Projects
Most research projects focus on one subject. This of course makes sense because of their expertise in
a field. Some more general publications to certain research fields are the following:

1.3.1 Power-to-X
In the field of Power-to-X, Carbon Capture and Utilisation (CCU) and Carbon Capture and Storage
(CCS) multiple research projects have been launched and some publications are already available.
In August 2018, Dechema published the first Power-to-X roadmap for Europe (Ausfelder, et al., 2018).
It includes political, economic and ecological aspects as well as system compatibility. In the context of
CarbonNext – an EU project carried out by DECHEMA, the University of Sheffield and Trinomics –
deliverables concerning the potential of CCU were published (DECHEMA, 2018).
Ramboll currently carries out another EU research project (Identification and analysis of promising
technologies for carbon capture and use CCU (IASS, 2019)) in collaboration with IASS and University
Kassel with the goal to identify the technologies in the field of the carbon dioxide use. SAPEA (Science
Advice for Policy by European Academies) presents in a report a variety of novel carbon capture and
utilisation technologies, see (SAPEA, 2018) and (Group, 2018).
In October 2018, Frontier Economics published on behalf of the World Energy Council – Germany the
report: "International Aspects of a Power-to-X Roadmap". (Frontier Economics , 2018) The EU-project
"Store&Go" focuses on the integration of PtG into the daily operation of European energy grids to
investigate the maturity level of the technology. Three different demonstration sites offer testing grounds
for PtG. Michael Sterner showed in his report (Sterner, 2017) the necessity of using Power-to-X
technologies in future energy and product systems. METIS Studies, Study S8, made a forecast for the
role and potential of Power-to-X in 2050. (Bossmann, et al., 2018)

1.3.2 Biomass
As a part of the Swiss energy strategy, eight Swiss Competence Centres for Energy Research
(SCCERs) were created. One of them is SCCER BIOSWEET (https://www.sccer-biosweet.ch/), which
is active in the field of bioenergy and focuses on research and implementation of biomass conversion
processes. The main role of SCCER BIOSWEET is the assessment of the role of biomass in the Swiss
energy transition. To achieve this, the project revolves around the design and evaluation of different
biomass conversion pathways leading from the raw materials to useful services but also accounts for
the design of the corresponding supply chains. This is expected to bridge the gap between the current
conversion processes and set the transition from the process to the national level of design considering
the economies of scale. 9/86
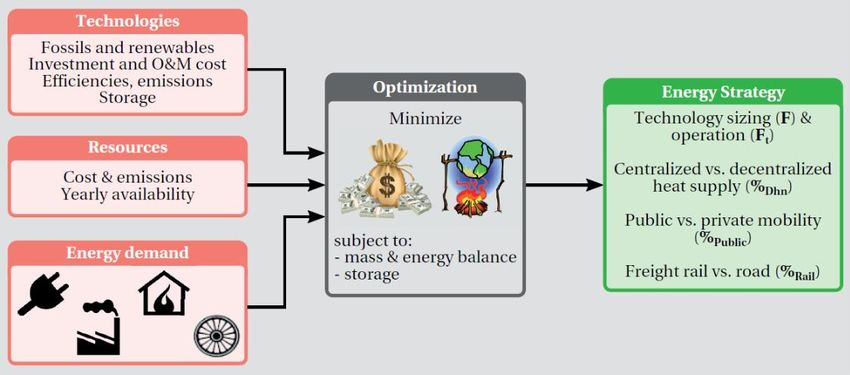
The H2020 project EUCalc (http://www.european-calculator.eu) aims to provide decision makers with a
tool able to quantify the sectoral energy demand, greenhouse gas (GHG) trajectories and social
implications of lifestyles and energy technology choices in Europe. It employs a model based approach
to link emission reduction with human lifestyles, resource management, energy production, agriculture,
process costs etc. While the project deals in general with integrated energy conversion systems, it also
includes information on bio-based as well as CCUS technologies.

Lastly, the H2020 Waste2Watts project (https://waste2watts-project.net/) concerns the design of biogas
to SOFC systems using an integrated scheme that leads from raw materials such as animal manure to
biogas production, upgrade and use in solid oxide fuel cells for power production. The projects aims at
displaying the effect of the biogas upgrading process as well as the scaling effect of the CO 2 removal
and SOFC steps.

1.3.3 Models
In this project, the model is based on EnergyScope (SES – Swiss-EnergyScope), a model developed
by the IPESE (Industrial Process and Energy Systems Engineering) group at the EPFL Valais and part
of the SCCER JASM – Joint Activity Scenario & Modeling. EnergyScope is able to model energy
pathways and optimizes them economically or ecologically with the focus of scenario analysis. Although
the structure of the model is generic, it has been designed and applied with the focus on Switzerland.
Other energy models of Switzerland are developed by the ETHZ, the PSI and UNIBAS. The model by
the PSI is called STEM (Swiss TIMES Energy Systems Model) (https://www.psi.ch/eem/stem), which
focuses on transition scenario analyses and is also part of the SCCER JASM. The ETH Zurich works
on a new model called Nexus. It is an integrated energy systems modelling platform.
There are several modelling tools developed for EU analysis.

Figure 1. EU-Models. Source: https://ec.europa.eu/clima/policies/strategies/analysis/models

The models cover all GHG emissions and removals:
 - Emissions: CO2 emissions from energy and processes (PRIMES), CH 4, N2O, fluorinated
 greenhouse gases (GAINS), CO2 emissions from LULUCF (GLOBIOM-G4M), air pollution SO2,
 NOx, PM2.5-PM10, ground level ozone, VOC, NH3 (GAINS).
- Emission reduction and removals: structural changes and technologies in the energy system
 and industrial processes (PRIMES), technological non-CO2 emission reduction measures
 (GAINS), changes in land use (GLOBIOM-G4M-CAPRI).
- Time horizon: 1990 to 2050 (5-year time steps).
- Geography: individually all EU Member States, EU candidate countries and, where relevant
 Norway, Switzerland and Bosnia and Herzegovina.
- Impacts: on energy, transport, industry, agriculture, forestry, land use, atmospheric dispersion,
 health, ecosystems (acidification, eutrophication), macro-economy with multiple sectors,
 employment and social welfare.

 11/86
2 Carbon Sources
For significant results of the project, a reliable data basis is crucial. In the first part of the project, a data
collection of all carbon sources in Switzerland is generated. These sources are divided into four sections:
 - Woody biomass: Forest wood, wood from landscape maintenance, wood residues, waste wood.
 - Non-woody biomass: Crop farming, animal farming, organic fraction of household waste, green
 waste from households and landscape, commercial and industrial organic waste, sewage
 sludge from central treatment plant, industrial food and meat production.
 - Carbon dioxide: Atmosphere, cement-manufacturing plants, waste-incineration plants, biogas /
 sewage plants, fuel combustion for transport, fuel combustion for heating, industrial processes.
 - Imports: Plant-based food, fossil fuels, chemicals, paper / wood, consumer goods, plastics and
 rubbers, animals, animal-based food, fabrics, stone and base materials.

The potential of each of these carbon sources is elaborated by the following approach:
 1. Definition of the theoretical potential (total available yearly amount, in 106 kg per year), the
 uncertainty of this figure (in %), the carbon content (in %, kg carbon per kg mass) and the energy
 content (in MJ/kg).
 2. Definition and subtraction of the already used potential (in form of goods like furniture e.g.) in 106
 kg per year.
 3. Definition and subtraction of the economical-technical restriction (e.g. woods in remote areas),
 in 106 kg per year.
 4. Supply costs in CHF/GJ or CHF/t respectively, with the corresponding uncertainty.

Nineteen domestic carbon sources are identified (excluding imports which are assumed to be unlimited,
compared to the Swiss demand). Four categories of carbon sources are defined (woody biomass, non-
woody biomass, CO2 sources and net imports), all of them consisting of several carbon sources.
The potential of each of the different sources can be subdivided into four terms. The ”theoretical
potential” of each carbon source is the total amount that is available in Switzerland. Here the specific
properties of the feedstock are provided (i.e. carbon mass fraction and specific energy per mass). The
”already used potential” refers to the amount already sed for energy purposes. Finally, the ”economical-
technical restrictions” express the quantity of economically and / or technically not harvestable sources
(e.g. harvesting wood from trees in remote mountain areas may not be economically feasible).
 = ℎ − − / ℎ

At the end, the available total potential is the theoretical potential from which the already used potential
as well as the economical-technical restrictions have been subtracted. The total available carbon
contained is then calculated based on the carbon content of of the source (potential multiplied by the
carbon mass fraction). The energetic potential is also calculated by multiplying the source potential by
the specific energy content. Additionally, the costs of the different sources are taken into account.
The largest potential after subtracting the already used potential as well as the economical-technical
restrictions are attributed to the carbon dioxide sources. The atmosphere is regarded as an infinite
carbon dioxide source, however with a low carbon dioxide content (around 410 ppm). Waste incineration
plants and cement manufacturing plants represent good carbon sources as they are currently unused
and have a higher carbon content than the atmosphere (around 10 to 35 % v/v (Meier, et al., 2017)).
The figures are based on research done by Thees et al. (2017) and on the previous project “Renewable
methane for transport and mobility” (Meier et al, 2017).

Figure 2. Total potential of domestic carbon sources in 106 kg (dry matter) per year: Woody biomass
(brown), non-woody biomass (green), carbon dioxide (blue), after subtracting the already used potential
as well as economical-technical restrictions. Sources, that are difficult to use or too expensive have a
total potential of zero kilograms (e.g. carbon dioxide emissions from cars). Sources: (Thees, et al., 2017)
and (Meier, et al., 2017).

 13/86
2.1 Woody biomass
For the figures of the potential of woody biomass, studies by (Thees, et al., 2017) as well as by ZHAW
( (BAFU, BFE, BLW, 2008) and (BAFU, BFE, BLW, 2009)) are consulted. As both references show
similar results, the figures from (Thees, et al., 2017) are taken for the result table.
The category "woody biomass" consists of four different sectors: Forest wood, wood from landscape
maintenance, wood residues and waste wood. All figures describing the quantity (i.e. the mass) of the
potentials are a result of a study carried out by the Swiss Competence Centre for Bioenergy Research
(SCCER BIOSWEET), see (Thees, et al., 2017). The uncertainty of the mass is assumed to be 5 %.
This number is based on an information by the ZHAW who carried out a study of the biomass flows
within Switzerland and received similar figures to those by SCCER BIOSWEET . As the quantity of the
mass refers to dry mass, the carbon content is approximately 50% (see (Meier, et al., 2017)). The energy
content of the different woody biomass sources is provided by the (Thees, et al., 2017) as well.
Woody biomass is a special case as many trees grow in remote, inaccessible places. This is represented
in the section ”economical-technical restrictions”. The costs are provided by (Thees, et al., 2017). For
the costs an uncertainty of 10 % is assumed as no information is provided.
In the strategy paper on wood resources the Swiss Federal Offices of Environment, Energy and
Economy present their plans for the use of wood energy (BAFU, BFE, SECO, 2017):

Table 1. Potentials of woody biomass.
 Economical- Supply
 Theoretical Already used Total Total
 technical Costs
 Carbon source potential, ds potential, ds potential, potential
 restrictions, ds (CHF/GJ
 (kt/y) (kt/y) ds (kt/y) (TWh/y)
 (kt/y) )
 Forest wood 7'348 4'612 913 1823 7.41 14.0
 Wood from 606 0 301 305 1.31 6.0
 landscape
 maintenance
 Wood residues 798 145 0 653 3.27 2.0
 Waste wood 1'456 833 165 458 2.09 1.0
 Total 10'208 5'590 1'379 3'239 14.08

In 2017, wood provided around 9.6 TWh/y of energy. Therefrom, 500 GWh/y were used for electricity
production. (BAFU, 2018)
2.2 Non-woody biomass
Non-woody biomass includes all biomass produced in Switzerland including the whole outcome of
agriculture, grasslands and biogenic waste from industry and households including sewage plants.
The whole table is divided, like before with the woody biomass, into four parts . In the first part, the
theoretical potential of non-woody biomass is described. This is the total amount that is annually
available in Switzerland including food and feed production. For the non-woody biomass, the
economical-technical restriction is the one of the more expensive and resource-intensive products like
the ones from animal farming. Additionally, the costs are listed. The information is based on the study
by SCCER BIOSWEET (Thees, et al., 2017) as well. Here an uncertainty of costs of 10 % is assumed
as no information is provided.

Table 2. Potentials of non-woody biomass.
 Already Economical- Total Supply
 Theoretical Total
 used technical potential, Costs
 Carbon source potential, ds potential
 potential, ds restrictions, ds ds (CHF/GJ
 (kt/y) (TWh)
 (kt/y) (kt/y) (kt/y) )
 Crop Farming 9'340 8'553 652 135 0.56 1.0
 Animal Farming 3'811 1'161 956 1'694 7.51 7.0
 Organic fraction of 352 0 0 352 1.67 0.0
 household garbage
 Green waste from 293 0 0 293 1.20 -1.0
 households and
 landscape
 Commercial and 1'027 0 789 238 0.88 4.5
 industrial organic
 waste
 Sewage sludge 347 0 0 347 1.35 4.5
 from central
 treatment plant
 Industrial food and 2'430 2'430 0 0 0 0.0
 meat production
 Total 17'600 12'144 2'397 3'059 13.17

As the study carried out by SCCER BIOSWEET only covers the waste from crop production, the figures
from a study by the ZHAW about the biogenic mass flows within Switzerland (2006, updated in 2009)
are used to supplement the data. These can be found in (BAFU, BFE, BLW, 2008) and (BAFU, BFE,
BLW, 2009).

 15/86
2.2.1 Crop farming
The theoretical potential of crop farming used in the project is summarized in the following table.

Table 3. Distribution of the output of crop farming in kilotons dry substance (ds) per year.
 Mass (ds) (kt/y) % Reference
 Crop by-products 787 8.4 (Thees, et al., 2017)

 Animal Feed 7'467 80.0 (BAFU, BFE, BLW, 2009)

 Food 1'055 11.3 (BAFU, BFE, BLW, 2009)

 Seeds and non-food products 31 0.3 (BAFU, BFE, BLW, 2009)

 total 9'340 100

The crop by-products include, next to the harvest residues, the amount of the currently used biomass
for energy carriers and fermentation as well. The carbon content is typically around 45 % for all crop-
farming products as the mass is given as dry substance. An uncertainty of 5 % in the data is chosen
based on information by the authors.
In 2006, crop farming had according to (BAFU, BFE, BLW, 2008) an energy input of 12.7 TWh/y, and
an energy output of 38.0 TWh/y (proportion ~ 1 to 3). The mass input was 2’852’578 t/y in total (ds), the
mass output 7’934’861 t/y (ds) (proportion 1 to 2.8). The crop farming has almost three times more
output than input in regards to biogenic energy and mass, the rest is gained through photosynthesis.

2.2.2 Animal farming
Animal farming had in 2006 according to (BAFU, BFE, BLW, 2008) an energy input of 38 TWh/y, and
an energy output of 16 TWh/y (proportion ~ 2.4 to 1). The mass input was 8’157’321 t/y in total (ds), the
mass output 3’398’625 t/y (ds) (proportion 2.4 to 1). Animal farming therefore has 2.4-times more input
than output in regards to energy and mass. Currently the output of animal farming is mainly used as
fertilizer for the plant industry.
Table 4. Distribution of the output of animal farming (BAFU, BFE, BLW, 2009).
 Mass (ds) (kt/y) %
 Food 434 11
 Slaughtered 222 6
 animals
 Animal Manure 3'060 80
 Wool 0.4 0
 Milk for feeding 72 2
 Export 23 1
 Total 3'811 100
By far the largest output of animal farming is the manure of the animals. According to Thees et al. (2017),
this figure was distributed among the different animals themselves again (76% by cows, 11% by horses,
rest by sheep, pigs, goats and poultry). The corresponding figures are listed in Table 4. The cost of
animal manure has been set to zero as it is considered a waste.

2.2.3 Waste
Household garbage is split into a biogenic fraction, paper and cardboard, and other organic products.

Table 5. Parameters of organic fraction of household garbage (Thees, et al., 2017).
 Dry substance ds Carbon Content LHV Theoretical
 (%) (in % of ds) (MJ / kg ds) potential
 (kt/y ds)

 Biogenic fraction 36 39.0 14.7 177
 Paper 70 49.6 18.5
 158
 Cardboard 60 51.2 20.0
 Other Org. Products 77 52.2 21.0 17

 Total 352

The figures for green waste from households and landscape maintenance, as well as the figures for
sewage sludge from central treatment plants, are described at the beginning of this chapter and do not
require a more detailed analysis. Commercial and industrial organic waste has different origins; the main
ones are mentioned in the following table:
Table 6. Parameters of commercial and industrial organic waste (Thees, et al., 2017).

 Economical- Total
 Theoretical Already used
 Carbon source technical potential
 potential (kt/y) potential (kt/y)
 restrictions (kt/y) (kt/y)

 Food processing 579 0 407 172
 Catering 36 0 3 33

 Retail trade 39 0 13 26
 Printing Industry 346 0 346 0

 Others 27 0 19 8
 Commercial and industrial 1'027 0 789 238
 organic waste

All figures for the organic fraction of the household garbage, the green waste from households and
landscape, the commercial and industrial organic waste and the sewage sludge are from the SCCER 17/86
BIOSWEET study (Thees, et al., 2017), including the costs. Uncertainties of 5% are assumed regarding
the quantity and 10% regarding the costs. All carbon mass fractions are approximately 45% (given dry
substances). These figures are from the project RMTM (Meier, et al., 2017).

2.2.4 Industrial food and meat production
In the section ”Industrial food and meat production” the actually consumed output of the food and meat
industry is listed (from which the waste was described in the previous four sections). The figures in this
sections are based on the ZHAW study (BAFU, BFE, BLW, 2009). Industrial food and meat production
is divided in four sections: Plant-based food: (2'430 kt/y), Animal-based food (2'287 kt/y), animal feed
(16 kt/y), skin and fur (14 kt/y), which gives a total theoretical potential of 2'430 kt/y. As these quantities
are directly consumed by humans or animals, the theoretical potential is the same as the already-used
potential. Therefore these sources cannot be used for carbon harvesting and the remaining mass
potential is zero.

2.3 Carbon dioxide
A previous study at the IET (Meier, et al., 2017) about Swiss carbon sources shows that it is feasible to
capture annually a carbon mass flow of 1'500 kt/y only by using the flue gas from the larger incineration
plants and cement manufacturing plants.
The total emitted amount of CO2 by vehicles and for heating purposes is the largest one. However,
divided by the number of plants or emitters, the amount per emitter is by far higher in cement-
manufacturing or waste incineration plants. It is therefore much more efficient to harvest carbon dioxide
there. In the large plants, a capture rate of 80% is reasonable (see (Design, Functionality and Emissions
of the Amine Plant, 2001) and (Rao, et al., 2002)). Therefore, the economical-technical restrictions
correspond to 20% of the theoretical potential.

Table 7. Carbon dioxide sources in Switzerland and their potentials (Meier et al., 2017).
 Carbon source Theoretical Already Economical- Total Total Capture
 potential (ds) used technical potential potential Costs
 (kt/y) potential restrictions (kt/y) (TWh) (CHF/t
 (kt/y) (kt/y) CO2)

 Atmosphere Unlimited 0.9 0 Unlimited 0 92-230

 Cement- 3'290 0 494 2'797 0 25-40
 manufacturing plants

 Waste-incineration 4'250 0 638 3'613 0 50
 plants

 Biogas / sewage 1'191 0 179 1'012 0 0-100
 plants

 Fuel combustion for 17'740 0 17'740 0 0 -
 heating

 Fuel combustion for 21'517 0 21'517 0 0 -
 transport

 Industrial processes 5'620 0 5'620 0 0 -
Human / Animal 13'650 0 13'650 0 0 -
 metabolism

The first part of the table specifies the sources. The figures as well as the uncertainties are a result from
the pre-going study "RMTM" (Meier, et al., 2017). There they also define the carbon dioxide fraction,
which is around 410 ppm in the atmosphere and above 10% in flue gases. As carbon dioxide is a result
of a completed reaction, the energy level of it is zero. For the reason that the atmosphere is not nationally
restricted, it is assumed an infinite source.
At present, there is hardly any regaining of the carbon dioxide. Climeworks built a plant in Hinwil in 2017,
which captures 2'460 kg of CO2 per day (Climeworks, 2018). As this is a new, still developing innovation,
the costs are today 600 Swiss francs per ton CO2. However, they claim that carbon dioxide might be
harvested from the atmosphere for 100 Swiss francs per ton once the technology is further developed
and the costs could be lowered. Currently, 900 tons CO 2 per year are captured at their plant. This is the
figure shown in the table in the section ”already used potential”.
Technically and economically it is too expensive to harvest the emissions of a large number of small
emitters like cars and houses. Therefore, the figures of these sources are the same in the part
"economical-technical restrictions" as in the theoretical potential. And the total potential of them are zero.
In the European Union’s Horizon 2020 research and innovation programme ”Store & Go” carbon capture
and Power-to-Gas processes are analysed. In their assessment of literature data about the CO 2 supply,
they report the following average capture costs for CO 2:

Table 8. Average CO2 capture costs related to industrial sectors (Böhm, et al., 2018).

 CO2 Source Capture costs Year Reference
 (€/tCO2)
 Energy industry; Coal 34-42 2017 (Bains, et al., 2017)
 power & heat from 19-47 2015 (Reiter, et al., 2015)
 fossil fuels 20-63 2015
 (CO2 from 48 2011 (Socolow, et al., 2011)
 combustion Natural Gas 63-83 2017 (Bains, et al., 2017)
 processes in power 54-101 2015 (Reiter, et al., 2015)
 plants) 35-75 2015
 Biomass 54-101 2015 (Reiter, et al., 2015)
 Chemical industry Refinery 29-83 2017 (Bains, et al., 2017)
 44-94 2015 (Reiter, et al., 2015)
 48 2012
 97 2014
 Ammonia Production 12 2017 (Bains, et al., 2017)
 23-54 2015 (Reiter, et al., 2015)
 22 2014
 Other chemicals 12-52 2017 (Bains, et al., 2017)
 21 2014
 Iron and steel 19-33 2017 (Bains, et al., 2017)
 production 16-41 2015 (Reiter, et al., 2015)
 81-83 2014
 Cement, clinker & 22-35 2017 (Bains, et al., 2017)
 lime production 33-69 2015 (Reiter, et al., 2015)
 19/86
 17-37 2012
CO2 Source Capture costs Year Reference
 (€/tCO2)
 82 2014
 Pulp, paper & board 18-27 2003
 production 57-87 2017
 Biogenic CO2 Biogas upgrading 0-90 2012
 Source 5-9 2015 (Reiter, et al., 2015)
 Bioethanol 12 2017 (Bains, et al., 2017)
 fermentation 0-18 2011
 25 2014
 5-9 2015 (Reiter, et al., 2015)
 Bioethanol 83-111 2011
 fermentation (incl. 42 2003
 cogeneration)
 Direct air capture 150-320 2012 (Trost, et al., 2012)
 22 2012 (Trost, et al., 2012)
 (Lackner, 2009)
 150 2010
 331-423 2011 (Socolow, et al., 2011)
 268-309 2013 (Mazzotti, et al., 2013)
 341-475 2014
 81-201 2018 (Keith, et al., 2018)

Biogas plants supplying natural gas into the natural gas grid are a very good CO 2 source. The effort of
carbon dioxide capture and sequestration is normally already done for the retrieval of biomethane which
can then be fed into the natural gas grid and therefore the costs are assigned to the methane production.
In this aspect, the sequestration of CO2 is neutral in costs (Böhm, et al., 2018) (based on (Trost, et al.,
2012) and (Reiter, et al., 2015)).

2.4 Imports
Now, most carbon-based products and fuels are imported to Switzerland, as are for example plastics
and gasoline. Thus, it is evident that imports are an important category of carbon sources. Compared to
the global availability of carbon-based products, the Swiss import rate is small enough for not taking any
restrictions of imports into account. For example, compared to the worldwide availability of gasoline, the
Swiss demand is small enough so that there is no restriction due to a potential lack of availability.
Therefore, all imports are considered unlimited. However, for the products and fuels that are produced
abroad, the carbon dioxide emitted during production is considered along with the imports. (Boustead,
2005) define in their study the gross air emissions associated with the production of 1 kg of polyols. A
carbon dioxide content of 2.9 kg per kg of polyol was defined. This value is used for the calculations of
the abroad emissions for all plastics.
3 Carbon Demand Energy and carbon flows are closely connected. For this reason, first the energy demand is investigated. The need of organic chemicals and plastics is determined by the current imports as there is hardly any production at the moment in Switzerland. The demand is defined in GWh/y for the energy flows and in 106 kg/y for product flows. Apart from chemicals and plastics, the carbon demand varies immensely depending on the final product used. It is possible, for example, to cover the entire mobility and heat demand with or without hardly any carbon-based technologies involved (except for planes). For this reason, the end demand in mobility (car traffic, public transportation as well as freight transport) and the heat demand (high and low temperature heat) are defined, without specifying which energy-carrier will be used. For the further steps with the model the end demand will change depending on the scenario used. For example, a scenario could be the ban on diesel cars or that all citizens travel only by public transportation. However, in this chapter, the focus is on the current situation. 3.1 Mobility and Transport In 2015, each Swiss citizen (over 6 years old) travelled a distance of 24'849 km/y on average. From this, 13'754 km/y (55%) were domestic travels, and 11'095 km/y (45%) international journeys. The most important means of transport is the car with 10'371 km per person and year, second is the plane with 8'986 km/y (BFS, 2019). 3.1.1 Passenger and Freight Mobility Private cars covered a distance of total 94'000 Mpkm/y, trains covered 21'000 Mpkm/y and public busses around 4'000 Mpkm/y (BFS, 2019). This makes a total of 119 Mpkm/y. On the Swiss roads a total of 17'200 Mtkm/y was performed for freight transport in 2017, while trains covered around 10'100 Mtkm/y (BFS, 2019). 3.1.2 Planes In 2017 (according to (BFS, 2018)): 24.9 million journeys of Swiss citizens with at least one non-resident overnight stay took place. 33% of these journeys were within Switzerland, 40% to a neighbouring country, 20% within Europe and 7% outside of Europe. 43% of the journeys abroad from Swiss citizens were done by aviation. If it is assumed that all journeys to a destination outside of Europe are done by plane, there were 1.743 million long-distance journeys and 5.431 million short distance flights. In 2017, 1'723'717 tonnes of fuel were filled up in Switzerland. Within the Swiss airspace a total of 582'674 tonnes per year of fuel were consumed (BFS, 2018). According to (BFS, 2018) there were 100'000 million passenger-km/y performed in incoming and outgoing scheduled and charter traffic, with Zurich being the largest airport (70'000 million passenger- km per year). These figures represent the actually performed passenger-km. In 2015 a total of 125'000 million passenger-km were offered for incoming and outgoing scheduled and charter traffic (the seat load factor is 80% on average (FSO, 2018)). 21/86
For the year 2017, FSO also defines the fuel consumption which is 1'724'000 t/y filled up in Switzerland,
and 583'000 t/y consumed in the Swiss airspace. Given the quantity actually filled up in Switzerland, the
carbon dioxide emissions are calculated to be 5'400'000 t/y (FSO, 2018).
Kerosene has a density of 0.78-0.81 g/cm3, a specific energy of 42.8 MJ/kg and an energy density of
37.4 MJ/l.

3.2 Heat
According to recent reports (BFE - Prognos, 2018) the Swiss heat demand was 105.6 TWh/y in total in
2017. Around 25% of the heat consumed is high temperature heat for industrial processes while 75%
of the heat demand is low temperature heat for space heating and hot water. (BFE - Prognos, 2018)
defines three different kind of heat demand:
 - Space heating includes the energy consumption of fixed heating installations as well as the
 consumption of mobile heating systems (e.g. electric heating). (The energy demand of heating
 installations for the control system and pumps belong to the category "ventilation, air
 conditioning and refrigeration" and are covered in the electricity demand.)
 - Process heat includes the heat demand in industrial and commercial operating processes as
 well as the electricity demand in the kitchen (cooking stove and steamer).

Table 1. Swiss Heat Demand in 2017 (GWh/y) (BFE - Prognos, 2018)
 Households Services Industry Transportation Total
 Low Temperature Heat 44'140 18'000 4'310 0 66'450
 – Space Heating
 Low Temperature Heat - 8'920 3'080 720 0 12'720
 Hot Water
 High Temperature Heat 1'530 580 24360 0 26'470
 - Process Heat
 Total domestic energy 54'590 21'660 29'390 0 105'640
 demand

3.3 Chemicals and Plastics
Together with the demand in form of heat, mobility, electricity and lighting, the demand in organic
chemicals as well as plastics is considered with focus on the most common ones. In the year 2017, the
import of organic chemicals was dominated by the following products (see Appendix - Section 11.5 ):

 1. Acetone, annual demand: 54.0 kt, Import price: 0.8 CHF/kg
 2. Esters of acrylic acid, 48.8 kt, Import price: 1.7 CHF/kg
 3. Acetic Acid, annual demand: 47.4 kt, Import price: 0.5 CHF/kg
 4. Aromatic monoamines, 36.9 kt, Import price: 3.5 CHF/kg
 5. Methanol, annual demand: 36.6 kt, Import price: 0.4 CHF/kg
 6. Phenol, annual demand: 36.5 kt, Import price: 1.1 CHF/kg
7. Ethanol, annual demand: 36.3 kt, Import price: 1.4 CHF/kg
It is considered that the current demand is equal to the current import. The plastic imports are dominated
by the following products (see Appendix - Section 11.5):

 1. Polyethylene, annual demand: 208.2 kt, Import price: 1.5 CHF/kg
 2. Polyethylene terephthalate, annual demand: 95.8 kt, Import price: 1.1 CHF/kg
 3. Polyvinyl chloride, annual demand: 84.3 kt, Import price: 1.1 CHF/kg
 4. Plates, sheets, film, foil and strip, of non-cellular plastics, 80.1 kt, Import price: 3.2 CHF/kg
 5. Polypropylene, annual demand: 75.1 kt, Import price: 1.5 CHF/kg
 6. Urea resins and thiourea resins, in primary forms, 65.9 kt, Import price: 0.4 CHF/kg
 7. Articles of plastics and articles of other materials of heading 3901 to 3914, n.e.s, 57.0 kt, Import
 price: 14.3 CHF/kg
 8. Polystyrene, annual demand: 56.2 kt, Import price: 1.5 CHF/kg

Currently, the Swiss plastic demand is covered by imports. In 2017, Switzerland imported totally 1'728
ktons of plastics and articles thereof (see (Swiss-Impex, 2019) or Appendix - Section 11.5). However,
in the same year, the export was in total 915 ktons of plastics per year, which results in a net import of
8'114 ktons of plastics per year.
With an increasing number of recycling processes, the total import demand and therefore the carbon
dioxide emissions associated with the production abroad can be reduced (around 2.9 kg CO 2 per kg
plastics (Boustead, 2005) at the moment). The recycling processes are not included in the model
currently, but implicitly accounted in the net import figures. For example, a reduction in the plastics
imports by 50% would be equal to a recycling rate of 50% if the demand remains the same.
In Switzerland the recycling rate was around 25% in the year 2018, and the rest (75%) is incinerated
and used for electricity and heat production (PlasticsEurope, 2018). Switzerland is one of the European
Union (EU) top trade partners for plastics (PlasticsEurope, 2018).
Polyethylene-based materials (PE-LD, PE-LLD, PE-HD, PE-MD, PET) as well as polypropylene are
mainly used for packaging purposes. However, the use of polypropylene (PP) is more evenly distributed
as it is also used in other sectors (building & construction, automotive, electrical & electronic devices,
agriculture, household/leisure/sports). Polyvinylchloride (PVC) is used in buildings and construction.

 23/86
3.4 Negative Emissions
Many predictions for the future development of carbon flows include negative emissions, i.e. carbon
dioxide that is captured from the atmosphere or flue gases and stored underground. A consortium of
Icelandic utility Reykjavik Energy and Swiss company Climeworks has successfully tested Direct Air
Capture and Storage (DACS) technology in Iceland. According to their press release in October 2018
(Climeworks, 2018) this consortium named ”CarbFix” will start now the project-planning phase for
expanding their DACS capacity. It will be the first plant to remove carbon dioxide from the atmosphere
and store it in the ground. In their latest report, the IPCC made clear that for avoiding a major raise in
temperature, a crucial reduction in carbon dioxide emissions whilst at the same time remove CO 2 from
the atmosphere (Rogelj, et al., 2018). Climeworks has declared their goal of capturing one per cent of
global emissions by 2025 (Climeworks, 2018).
For the CarbFix2 project In Hellisheidi in Iceland Reykjavik Energy, ON Power and Climeworks are now
planning an expansion of their DACS capacity. (Gunnarsson et al., 2018) defines the costs of carbon
capture at the CarbFix2 site to be $25/ton of the gas mixture.

Table 10. Cost of mixed gas capture (54.4 vol% CO2 and 22.7 vol% H2S) and storage at the CarbFix2
site (Gunnarsson et al., 2018) (CHF/t).
 Case 1 Case 2 Case 3

 Capture 21.3 21.3 42.1
 Transport 1.3 1.3 1.3
 Injection 1.3 4.1 4.1
 Monitoring 0.9 0.9 0.9

 Total CCS Cost 24.8 27.6 48.4
Assumption: $ 1 = CHF 1. Case 1: On site up-scaled cost at Hellisheidi power plant. Case 2: On site up-scaled cost at
Hellisheidi power plant including drilling a well for injection. Case 3: On site up-scaled cost at Hellisheidi power plant including
drilling a well and using average OECD electricity price for industry in 2014 (US$ 123.9/MWh).

The relatively low cost derive from optimal conditions in Iceland. In Hellisheidi the exhaust gas is
concentrated and heat is available for free.

Table 11. Carbon capture costs derived from literature study results (CHF/t), from (Rubin et al., 2015),
(WorleyParsons Services Pty Ltd., 2011) and (Rackley, 2009).
 Process Industrial carbon source Direct air capture

 Capture 50 300
 Transport 1.3 1.3
 Injection 4.1 4.1
 Monitoring 0.9 0.9

 Total CCS Cost 56.3 306.3
4 Conversion Technologies
For converting the carbon sources into usable products, different pathways are taken into account. The
definition of the conversion technologies takes the following factors into account:
 - Reference plant size (GW)
 - Investment costs (CHF / kW)
 - Maintenance costs (CHF / kW th / year)
 - GWP of construction
 - Lifetime (in years)
 - Input and Output (in kW or kg).
The technologies themselves are divided in six sectors:
 1. Energy conversion technologies (Moret, 2017)
 2. Hydrogen: Although not explicitly associated to carbon, hydrogen is a necessary component for
 many carbon conversion technologies.
 3. Renewable Fuels: This section is comprised of technologies that have methane, diesel, gasoline,
 coal or kerosene as end products, produced from renewable input materials.
 4. Organic Chemicals: In this section, the end products are acetic acid, methanol, ethanol, phenol
 and acetone. These are the most common organic chemicals.
 5. Intermediates: To produce bioplastics, intermediate products like ethylene, propylene, styrene
 and benzene are required. These are covered in this section.
 6. Plastics: In the last section, the intermediates are converted into plastics.

4.1 Biomass to X
In this section, a short description of the main technologies employed in this study to convert biomass
into useful services is given. Table 12 summarizes the values of the energy efficiency as well as the
costs considered for the calculations.

Table 12. Energy efficiencies and cost values used for the biomass to X technologies
 Source Product Pathway Conversion CAPEX OPEX
 Factors (Energy) (CHF/kW) (CHF/kWth/y)

 Wet Biogas Anaerobic Digestion Wet Biomass: -2.86 1053 93.91
 Biomass Biogas : +1.00 (Ro, et al., (Lantz, 2012)
 (Pöschl, et al., 2006)
 2010)
 Wet BioSNG Hydrothermal Gasification Wet Biomass: -1.54 1700 118.8
 Biomass Electricity: +0.02 (Gassner, et (Gassner, et
 BioSNG : +1.00 al., 2011) al., 2011)
 (Gassner, et al.,
 25/86
 2011)
You can also read