The surface modification effect on the interfacial properties of glass fiber-reinforced epoxy: A molecular dynamics study - De Gruyter
←
→
Page content transcription
If your browser does not render page correctly, please read the page content below
Nanotechnology Reviews 2022; 11: 1143–1157
Research Article
Jiangang Deng, You Song, Zhenbo Lan, Zhuolin Xu, Yanming Chen, Bing Yang, and
Huali Hao*#
The surface modification effect on the interfacial
properties of glass fiber-reinforced epoxy:
A molecular dynamics study
https://doi.org/10.1515/ntrev-2022-0068 control of the interfacial properties of such composites
#received December 29, 2021; accepted January 5, 2022 through surface modification techniques.
Abstract: In this work, the effect of common functional Keywords: functional groups, interfacial failure, confor-
groups, namely hydroxyl, formyl, carboxyl, and amine mational change, steered molecular dynamics, atomistic
groups on the interfacial behavior of surface-modified scale
glass fiber-reinforced epoxy is investigated at molecular
scale. The interfacial properties of the epoxy/silica coated
with different functional group systems are quantified
by performing pulling test using the steered molecular 1 Introduction
dynamics simulations. It is found that the system with
hydroxyl groups has a relatively lower interfacial inter- Glass fiber-reinforced (GFR) epoxy resin has been widely
action, exhibiting an adhesive failure mode. When partial used as insulating materials, adhesives, electronic packing
hydroxyl groups are replaced by carboxyl, amine, and materials, and matrix for functional composites because
formyl groups, respectively, the interfacial interactions of its thermal stability, lightweight, superior mechanical
are increased and these systems exhibit a cohesive failure properties, excellent resistance to corrosion, and out-
mode where failure happens in the epoxy close to inter- standing electrical insulation [1,2]. GFR epoxy compos-
face. A relatively higher force is required for the adhesive ites have revealed significant applications in a variety
debonding, while more energy can be dissipated for the of engineering fields such as automobile, automotive,
cohesive debonding. Because the increased interfacial aerospace, and construction [3]. However, glass fiber
interactions can prevent the mobility of polymer chains, has poor adhesion with epoxy matrix. It has been found
and delay the propagation of micropores in the matrix, that most failure cases of GFR epoxy composites are
leading to the epoxy matrix with a high ability of energy correlated to the weak interfacial bonding between glass
absorption. Our work provides an insight into how func- fiber and epoxy matrix [4,5]. The durability of reinforced
tional groups affect the interface debonding behavior of epoxy composites is highly dependent on the interface
glass fiber-reinforced epoxy, offering a guideline for interaction. Therefore, an appropriate control over the
interfacial characteristics is required in order to achieve
the optimum performance of GFR epoxy composites for
their safe and reliable applications.
# Co-first author.
The surface of glass fiber, modified by using alkali
treatment, acetylation, electroplating, plasma treatment,
and grafting, has been widely adopted to improve the
* Corresponding author: Huali Hao, School of Power and Mechanical
Engineering, Wuhan University, Wuhan, Hubei Province, 430072, interfacial adhesion between glass fiber and epoxy matrix
China, e-mail: haohuali@whu.edu.cn [6,7]. For example, the surface polarity of glass fiber can be
Jiangang Deng, You Song, Zhenbo Lan, Zhuolin Xu: Wuhan Nari improved by plasma treatment, where large numbers of
Limited Liability Company of State Grid Electric Power Research functional groups are introduced leading to an improve-
Institute, Wuhan, Hubei Province, 430074, China; State Grid Electric
ment in the interfacial bonding [8]. Numerous direct and
Power Research Institute, China
Yanming Chen, Bing Yang: School of Power and Mechanical
indirect experimental methods have been developed to
Engineering, Wuhan University, Wuhan, Hubei Province, 430072, quantify the interfacial properties of fiber-reinforced com-
China posites. The most common method to investigate the
Open Access. © 2022 Jiangang Deng et al., published by De Gruyter. This work is licensed under the Creative Commons Attribution 4.0
International License.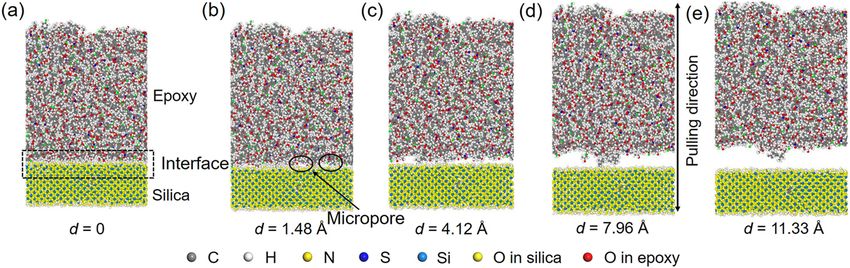
1144 Jiangang Deng et al.
interfacial properties is through fiber pull-out test, which structure is employed to represent glass fiber in this
consists of debonding, bridging, and followed pull-out work. The scope of this work is to first model the initial
process, occurring on atomic, microscopic, and macro- structures of the cross-linked epoxy and modified silica
scopic levels at the interface [9,10]. The knowledge of with different functional groups introduced on the sur-
the sequences of events occurring on these different levels face. The physical properties of the cross-linked epoxy
is extremely important to understand the nature of the and silica are predicted and compared with experimental
interfacial properties. Moreover, the interface region that results so as to validate the reliability of the modeled
controls the stress transfer between fiber and matrix is structures and selected forcefield. Subsequently, the
primarily dependent on the level of interfacial adhesion bilayer structure is composed based on the equilibrated
[11]. The interfacial adhesion is confined to a several hun- cross-linked epoxy and silica structures. The interfacial
dred nanometers-wide boundary region at the interface of properties of epoxy/silica functionalized with different
fibers and polymer matrix, known as the interphase [12]. functional groups are studied by performing the pulling
The failure of GFR epoxy initiates from the failure of test using the steered MD simulations. The interfacial
interphase. The intrinsic of the surface modification of properties such as the force, energy, and displacement
glass fiber is to modify the failure behavior of interphase. for interface failure are quantified. Finally, the conforma-
However, due to the limitation of experimental character- tional change of interface is captured to figure out the
ization, how the functional groups affect the failure of location of interface failure. The reason for the variation
interphase is still ambiguous, making it difficult to control in interfacial properties of epoxy/silica systems with dif-
the interfacial properties of GFR composites. The effect of ferent functional groups is figured out; and the mechanism
functional groups on the interfacial debonding that occurred of interface failure for surface-modified GFR epoxy com-
at the early stage of fiber pull-out is still unknown, and the posites is discussed. Such understanding of the interac-
underlying reason for the variation in failure mechanism tions between glass fiber with different functional groups
for surface-modified GFR composites is unrevealed. and epoxy matrix at atomistic scale can provide valuable
Molecular dynamics (MD) simulations can depict the theoretical support for interface control of GFR epoxy
microstructure evolution, including the rearrangement composites.
of atoms, the change in polymer chain conformation,
and the intra- and inter-molecular interactions [13,14].
MD simulations have become a powerful approach for
exploring the dynamical processes of conformational 2 Computational details
changes and predicting mechanical properties [15]. The
relationship between interfacial structures and properties The atomistic simulations start with the construction of
can be revealed by MD simulation approach. For example, full-atomistic models of cross-linked epoxy and silica
the optimal chemical functionalization groups grafting with different functional groups in Accelrys Materials
on carbon fiber to improve the mechanical properties of Studio [18]. The interfacial models are constructed using
carbon fiber-reinforced polypropylene have been suc- Large-scale Atomic/Molecular Massively Parallel Simu-
cessfully determined by MD simulations [16]. The inter- lator (LAMMPS) [19]. The equilibration and dynamic
face adsorption mechanism of surface-modified carbon deformation are carried out using the parallel MD code
fiber-reinforced epoxy has also been validated by MD LAMMPS. The details of the model construction and
simulations [17]. It has been found that oxygen atoms on simulation procedures are presented.
the surface of the epoxy matrix are first accumulated on The critical step in MD simulations is the selection of
the carbon fiber surface; the molecular chain of epoxy is an appropriate forcefield because the forcefield deter-
then driven towards the carbon fiber surface with func- mines the accuracy of the predicting properties related
tional groups [17]. The details of how functional groups to atom interactions of materials [20]. The conventional
affect the interfacial bonding between fiber and polymer polymer consistentforcefield (PCFF) is chosen. The poten-
matrix can be figured out by MD simulations. tial energy of PCFF comprises a set of covalent-related
The objective of this work is to investigate the effect interactions such as the bond interaction between pairs
of functional groups on the interfacial behavior between of bonded atoms, the angle interaction between three con-
glass fiber and epoxy matrix at molecular scale, quanti- secutive bonded atoms, the dihedral interaction, and the
fying their effects on interfacial failure. As silica is the improper interaction between quadruplets of atoms and
major composite, accounting for more than half of the non-bonded interactions. Specifically, the covalent-related
weight fraction in commercial S-glass fiber, the silica potential energy depends on the bond lengths, bond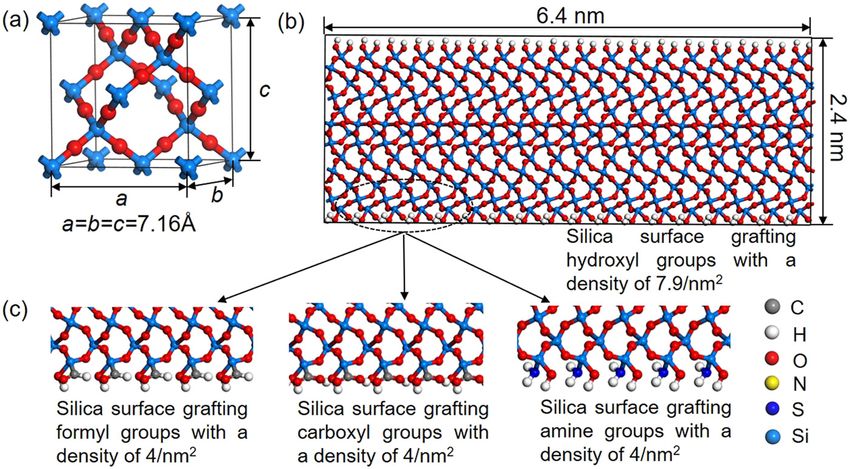
Surface modification effect on GFR epoxy: A molecular dynamics study 1145
angles, torsion angles, and improper out-of-plane angles. diaminodiphenyl sulfone (DDS), the properties of the
The non-bonded potential energy is determined by the van resultant cured epoxy resins are much sought after,
der Waals interactions and Coulomb interactions. These including an improved glass transition temperature and
interactions dominate the mechanical behaviors of the excellent chemical resistance [22]. In this study, the high-
molecular materials. The PCFF has been successfully used performance epoxy resin DGEBA and curing agent 4,4′-
to predict the structural, conformational, and vibrational diaminodiphenyl sulfone (44DDS) are selected as the
properties of a broad range of molecules in condensed representative. The β-cristobalite is served as the starting
phases, and it also has an experimentally comparable pre- conformation for the creation of silica. This is because
cision in predicting molecular properties in condensed silica structure is constructed via the melt-quench tech-
phases [21]. This potential has been successfully applied in nique and the β-cristobalite can undergo a direct phase
the simulations of a wide range of organic and inorganic transition to the liquid state as the temperature rises
materials including silica and epoxy resin. In this work, higher than the melting point [23]. The silica structure
PCFF is used to cross-link epoxy resin and to describe the is obtained by heating the crystalline β-cristobalite to
interactions within the cross-linked epoxy and silica, as high temperature for melt and then cooling down to
well as between epoxy and silica. Although some covalent room temperature [24].
bonds can be formed between functional groups on glass
fiber and epoxy, the non-bonded interactions make a domi-
nant contribution to the interfacial adhesion. Because the
introduced functional groups on the surface glass fiber by 2.1 Cross-linking of epoxy
surface modification method is mainly to improve the wett-
ability between glass fiber and epoxy. Thus, the interfacial The molecular structures of DGEBA and 44DDS are shown
interaction between epoxy and silica governed by the non- in Figure 1. DGEBA reacts with the curing agent 44DDS to
bonded interactions is considered in this work. form a cross-linked structure. The details of the polymer-
The default high performance epoxy resin, diglycidyl ization mechanism are shown in Figure 2(a). The epoxide
ether of bisphenol A (DGEBA), is used in a wide variety of groups in DGEBA molecules can be activated and the
applications, including as the matrix phase in composite C–O–C bonds in the epoxide group are broken with the
systems. When cured with an aromatic diamine, such as formation of a reactive CH2 site [25]. The activated CH2 site
Figure 1: (a) Multiscale structures of glass fiber-reinforced epoxy composites. (b) Molecular structures of DGEBA and 44DDS monomers of
cross-linked epoxy.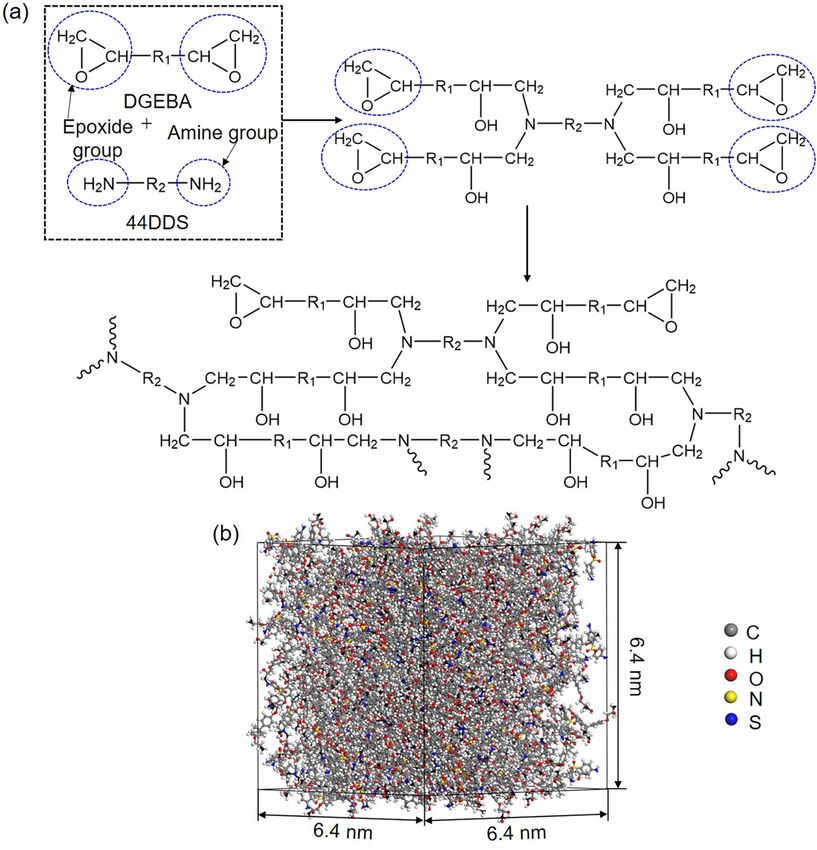
1146 Jiangang Deng et al.
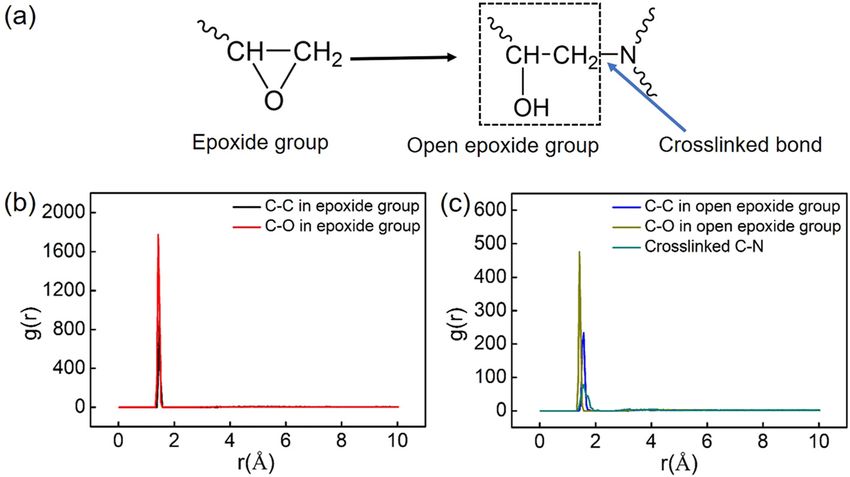
Figure 2: (a) Mechanism of cross-linking reaction between DGEBA and curing agent 44DDS. Parts of epoxy groups are open and activated to
react with amine primary hydrogens in 44DDS resulting in the formation of secondary amine. The secondary amine can continue to react
with opened epoxy groups. Finally, a cross-linked structure through the reaction between the open epoxy group in DGEBA and amine groups
in 44DDS is formed. (b) The cross-linked epoxy structure.
reacts with primary amine hydrogens in 44DDS, resulting equilibrated system is heated to 400 K for cross-link.
in the formation of secondary amine [26]. The secondary The condensation reaction occurs between the hydroxyl
amine in turn reacts with open epoxide groups. A cross- groups in open epoxide groups of DGEBA and hydrogens
linked network is formed through the reaction between in amine groups of 44DDS at 400 K. The cross-linked
open epoxide groups and the amine groups. structure is obtained with a cross-linking degree of
We start to construct the cross-linked epoxy structure 85%, as shown in Figure 2(b). Next the condensation
by packing activated DGEBA (C–O–C bonds in epoxide reaction occurs within DGEBA monomers where the
groups are broken and the hydroxyl groups are attached unreacted open epoxide groups change to inactivated
at the activated CH2 site.) with 44DDS using the amor- epoxide groups through the condensation reaction
phous cell module in Materials Studio. The stoichiometric between hydroxyl groups, meaning that DGEBA mole-
mixing ratio of DGEBA to 44DDS is 2:1 with 400 mono- cules are ended with epoxide groups. The system is
mers of DGEBA and 200 monomers of 44DDS. A cubic finally cooled down to 300 K for equilibration in NPT
primitive cell with a length of 6.4 nm is constructed. ensemble. After equilibration, the obtained cross-linked
The energy and geometry of the system are minimized structure is served as the initial structure of epoxy resin
by the conjugate gradient method and then equilibrated with a size of 6.4 nm × 6.4 nm × 6.4 nm.
at 300 K in the canonical (NVT) ensemble for 1 ns followed The physical properties of epoxy resin are predicted
by another 1 ns equilibration in the isothermal–isobaric in LAMMPS. The cross-linked structure obtained from
(NPT) ensemble at 300 K and 1 atm. Subsequently, the Materials Studio is first minimized and equilibrated for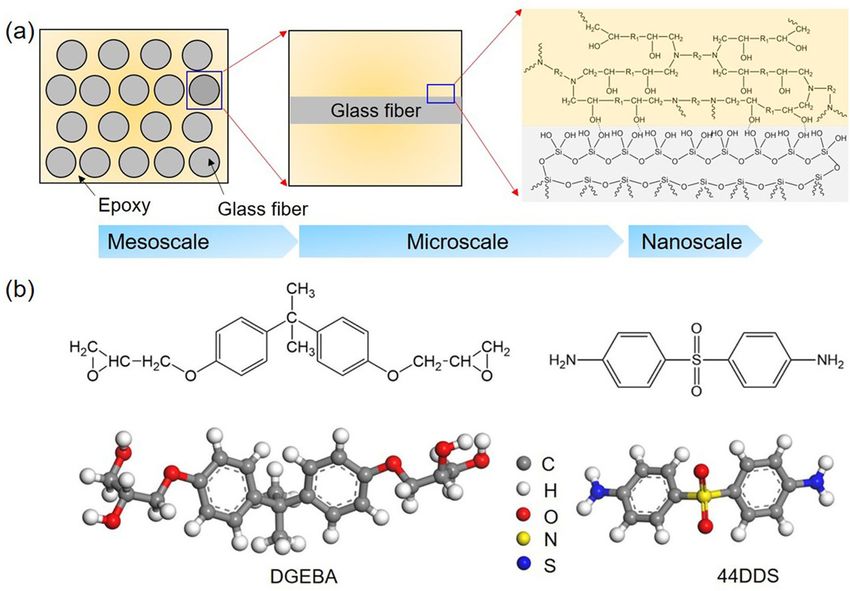
Surface modification effect on GFR epoxy: A molecular dynamics study 1147 1 ns in NVT ensemble at 300 K, then equilibrated for 2.2 Construction of silica model another 1 ns in NPT ensemble at 300 K and 1 atm. The purpose of doing NVT before NPT is based on algorithmic The β-cristobalite has a lattice constant of 7.16 Å with stability. Velocity generation in MD simulations can crash an oxygen-to-silicon ratio of 2:1 shown in Figure 3(a). if coupled directly with a barostat. The equilibration is The crystalline β-cristobalite system is cleaved on (001) often done under NVT for a period to get the velocity plane. The dangling oxygen atoms on the (001) surface distribution reasonable, followed by NPT. The root-mean- are all saturated by the hydrogen atoms and dangling square displacement (RMSD) is checked; it is found that silicon atoms are saturated by hydroxyl groups, as shown the value of RMSD at the end of 500 ps is almost constant in Figure 3(b). The density of the surface hydroxyl groups indicating that the system is equilibrated. The density of is about 7.9/nm2, located in the range of the experimental the cross-linked epoxy is about 1.14 g/cm3, located in the results [28]. It is found that the surface of silica is range of 1.1–1.4 g/cm3 tested by experiments [25,27]. The covered, to some extent, with hydroxyl groups during glass transition temperature (Tg) and Young’s modulus (E) the formation processes; and the overall coverage of of the cross-linked epoxy are predicted. Specifically, the hydroxyl groups on a surface ranges from 0 to 9.4/nm2 equilibrated structure is heated to 690 K and then cooled in experimental tests [29]. The silica is first equilibrated at down to 200 K at a temperature step of 30 K with a cooling 300 K in NVT ensemble for 1 ns, then equilibrated in NPT rate of 0.5 K/ps. At each temperature, an equilibration of ensemble at 300 K and 1 atm for another 1 ns with the 500 ps is performed using NPT ensemble at 1 atm, so that periodic boundary condition. The equilibrated system is the predicted results can be directly compared with experi- then heated to 5,000 K for melting and equilibrated for mental data. The specific volume as a function of tempera- 1 ns in NPT ensemble. Next the equilibrated silica is ture is obtained to evaluate Tg of cross-linked epoxy. The cooled down to 300 K at a rate of 5 K/ps and equilibrated tensile deformation of the system is performed at 300 K and at 300 K at 1 atm for 1 ns. The density of constructed silica 1 atm where the system is deformed along z direction with a is about 2.18 g/cm3, close to the experimental data [30]. fixed strain rate of 108/s. The system is equilibrated for In order to study the effect of functional groups on about 50 ps following each step of deformation. The stress the interfacial bonding, half of the number of hydroxyl under a specific strain is obtained from the average stress groups on the surface of silica are randomly substituted for the last 5 ps equilibration. The value of E is predicted by functional groups such as formyl groups, carboxyl from the stress–strain curve. groups, and amine groups with a density of 4/nm2. The Figure 3: (a) The lattice structure of β-cristobalite. (b) The initial model of silica where the surface is covered by hydroxyl groups. It is obtained by cleaving on (001) surface of β-cristobalite and then the dangling oxygen on (001) surface are statured by hydrogen atoms and dangling silicon atoms are statured by hydroxyl groups. The density of hydroxyl groups on the silica surface is about 7.9/nm2. (c) The initial models of silica where the surface is covered by formyl group (COH), carboxyl group (COOH), and amine group (NH2), respectively. Such structures are obtained by replacing partial hydroxyl groups in (b). The density of these functional groups is about 4/nm2.
1148 Jiangang Deng et al.
silica models with different functional groups are equili- to those tested by experimental and computational
brated at 300 K and 1 atm in NPT ensemble for 1 ns. The approaches [34].
RMSD is checked, and it is constant at the end of 500 ps,
which indicates that the system is in an equilibrated
state.
Radial distribution function (RDF) analysis is among 2.3 Construction of epoxy/silica structure
one of the most important methods for revealing the
structural features of a system and is calculated to quan- The equilibrated epoxy, silica with different functional
tify bond types. RDF is the probability density of finding groups on the surface, and a vacuum layer with a thick-
atoms A and B at a distance r averaged over the equili- ness of 2 nm are sequentially placed in order from bottom
brium trajectory. Figure 4 shows the partial RDF of dif- to top with the formation of the complete simulation sys-
ferent silica systems. In the silica system with hydroxyl tems. The interlayer separation between silica and epoxy
groups, the Si–O bond in inner silicon oxygen tetrahe- is initially selected to be 5 Å, which is subsequently
dron (bulk Si–O) and in silanol groups (Si–OH) are adjusted by the repulsive and attractive forces at the inter-
about 1.58 Å, as shown in Figure 4(a). This has a good face during equilibration process. The periodic boundary
agreement with the value (about 1.61 Å) measured by conditions are applied in x, y, and z directions to avoid the
X-ray diffraction [31,32]. The length of bulk Si–O bond finite-size effects. The vacuum layer added is in order to
in silica models covered with formyl, carboxyl, and amine avoid the interfacial interaction caused by the periodic
groups are similar to that in the silica models covered with boundary condition in z direction. The interactions between
hydroxyl groups as shown in Figure 4(b). The bond length epoxy and silica mainly consist of non-bonded interactions
of Si–N in the silica model covered with amine groups is including the Coulomb interaction and van der Waals inter-
around 1.68 Å, consistent with the value of 1.69 Å mea- action. The constructed epoxy/silica system is first energy
sured by experiments [33]. The length of Si–C in the minimized, and then equilibrated at 300 K in NVT ensemble
silica model covered with formyl and carboxyl groups for 1 ns, followed by another 1 ns equilibration at 300 K and
are 1.98 and 1.93 Å, respectively, in Figure 4(c), similar 1 atom in NPT ensemble. Finally, the RMSD is checked, and
Figure 4: (a) The partial RDF of Si–O bond in silica model with the surface covered by hydroxyl groups. The length of the Si–O bond in silanol
group (Si–OH) and in silicon oxygen tetrahedron (referring to bulk Si–O) is 1.58 Å, close to that measured by experiments. (b) The partial
RDF of bulk Si–O bond in different silica models where the length of Si–O bond is close. (c) The partial RDF of Si–N and Si–C bonds in silica
models with the surface covered by formyl, carboxyl, and amine groups. The length of the Si–N bond is about 1.68 Å. The length of the Si–C
bond in silica with formyl and carboxyl groups are 1.98 Å and 1.93 Å, respectively, close to that measured by experiments.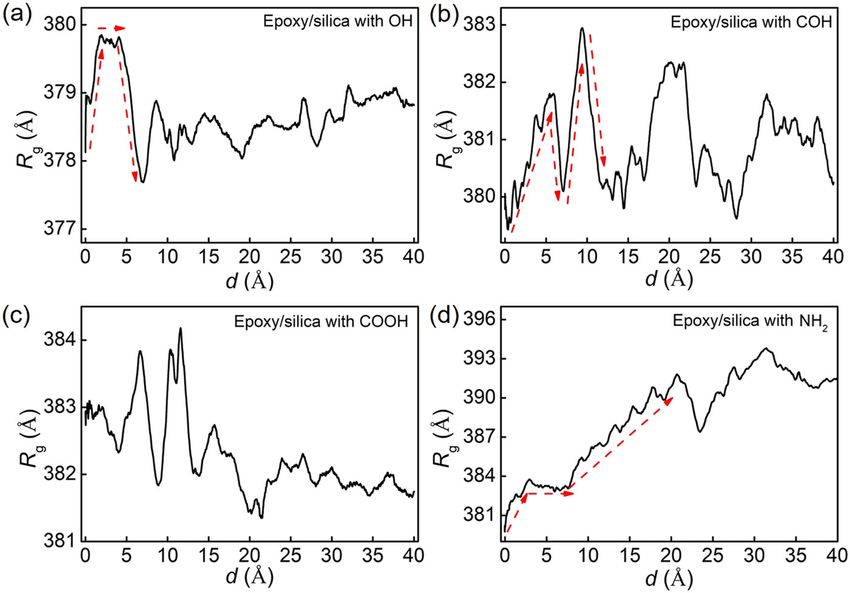
Surface modification effect on GFR epoxy: A molecular dynamics study 1149
it is constant at the end of 500 ps, indicating that the system F is collected every 0.1 fs. The initial length of the
is in an equilibrated state. spring is equal to the initial displacement between
The interfacial bonding energy of bilayer materials is the COM of epoxy and silica. As the value of COM for
calculated based on the formula [26]: epoxy and silica along x and y directions are nearly the
same, the variation in the distance between the COM of
(Eepoxy + Esilica ) − Ebilayer
Ebonding = (1) epoxy and silica along the z direction can be regarded as
A
pulling displacement (d). This means that there is relation-
where Ebonding is the interfacial bonding energy of the ship of d = (Rt − R0)⋅ n. The free energy change is equal to
epoxy/silica system; Eepoxy is the potential energy of the the work done on the system in a reversible isothermal
equilibrated epoxy system; Esilica is the potential energy process and equal to the integral of an externally applied
of the equilibrated silica system; Ebilayer is the potential force over the coordinate. During SMD simulations, the
energy of the equilibrated epoxy/silica system and A is free energy change is defined as the potential of mean
the interface area. force (PMF). The SMD simulations are performed in NVT
The interfacial debonding behavior of different bilayer ensemble at 300 K. Because SMD simulations require an
systems is studied by pulling test using steered molecular empty volume along one Cartesian axis, the system has
dynamics (SMD) simulations. The SMD simulations, based free space to stretch without colliding with its periodic
on the principles of atomic force microscopy technique, images [37]. To avoid this problem, a vacuum slab is
can provide the conformational change in atomistic scale added, and the NVT ensemble is used for SMD simulations
and energy variation during dynamic deformation [35]. In to avoid a barostat control that can reduce the empty space
SMD simulations, the center-of-mass (COM) for epoxy and added. The conformational changes in interface are cap-
silica is attached by a virtual spring. The atoms are dis- tured with OVITO.
placed by applying a constant velocity (v) to them. A
restoring force is applied to the atoms and the magnitude
of the force is related to the spring constant (k). The epoxy
and silica are debonded along z direction under equivalent
3 Results and discussions
opposite force perpendicular to the interface. The virtual
spring force is determined by ref. [36]:
3.1 Physical properties of cross-linked
1
U = k[vt − (Rt − R0)⋅ n]2 (2) epoxy
2
F = −∇U (3)
Figure 5 shows the partial RDF of bonds in epoxide
where t is the time; n is a unit vector for the direction of groups and the cross-linked bonds between DGEBA and
pulling; Rt and R0 are the displacement at t and the initial 44DDS. During the cross-linking process, the C–O bond
displacement between the COM of epoxy and silica, in the epoxide group is broken as shown in Figure 5(a).
respectively. U and F are the potential energy and virtual The length of C–C and C–O bonds is 1.48 and 1.43 Å,
spring force, respectively. As shown in equations (2) and respectively, as shown in Figure 5(b). The C–N bond is
(3), the pulling force applied is dependent on the spring formed between DGEBA and 44DDS for cross-linking; its
constant and the pulling velocity. If the spring constant is length is about 1.53 Å as shown in Figure 5(c). The bond
too small, the interface cannot be debonded. Otherwise, lengths of C–C and C–O in open epoxide groups are 1.58
if the spring constant is too large or the pulling velocity is and 1.43 Å, respectively. These results are close to the
too fast, there is a problem to sample the interaction experimental data, which are 1.47, 1.54, and 1.43 Å for
between fiber and epoxy along the pulling displacement. C–N, C–C, and C–O bonds, respectively [38]. The variation
On the other hand, the velocity cannot be too small, in C–C bond in epoxide groups and open epoxide groups is
considering the simulation time. Taking all these into correlated to the change in the type of linkage for the
consideration, we use the velocity of 1 Å/ps and a carbon atoms. The types of carbon atoms according to
spring constant of 100 kcal/(mol · Å2) to ensure the the PCFF forcefield are changed when the epoxide groups
high simulation accuracy and reasonable computa- are open and cross-linked with amine groups.
tional cost of simulations. The epoxy and silica are The physical and mechanical properties of the cross-
debonded along z direction under equivalent opposite linked epoxy have been predicted and compared with the
force perpendicular to the interface. The pulling force experimental data for validation. Figure 6(a) shows the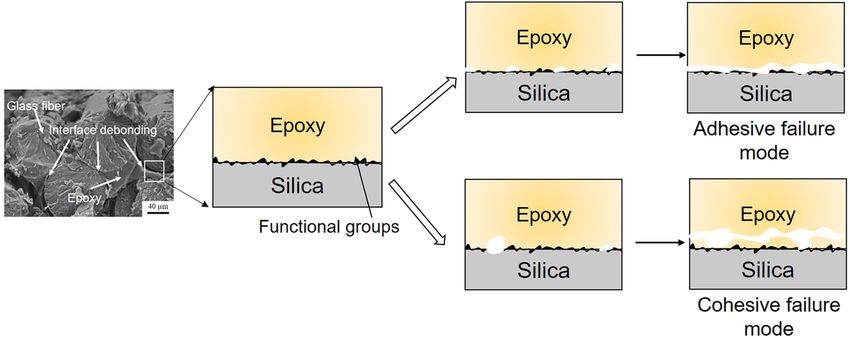
1150 Jiangang Deng et al. Figure 5: (a) The schematic diagram of bond change during cross-link. (b) The partial RDF of bonds in the epoxide group. The lengths of C–C and C–O bonds are 1.48 and 1.43 Å, respectively, close to those measured by experiments. (c) The partial RDF bonds in open epoxide groups. The lengths of C–C and C–O bonds are 1.58 and 1.43 Å. The cross-linked C–N bond between DGEBA monomer and 44DDS monomer is about 1.53 Å. temperature dependence of the specific volume for the fiber mainly affect the conformational change in epoxy cross-linked epoxy during the cooling process. The spe- during debonding, a reasonable selection of forcefield to cific volume of the cross-linked epoxy at each tempera- describe the epoxy properties is important. ture has been calculated from the average density of the system for the last 50 ps of equilibration. The abrupt change in the slope of the curve determines Tg. The inter- sect of the extrapolations denotes that Tg of the cross-linked 3.2 Interfacial properties of epoxy/silica epoxy is about 489 K, located in the range from 460 to 530 K systems tested by the experimental approach [22,26,39]. Figure 6(b) shows the stress–strain curve of the tensile deformation for The effect of interfacial properties between epoxy and the cross-linked epoxy. Young’s modulus is about 4.4 GPa. functionalized silica is investigated by performing the This is located in the range of experimental results and pulling test. The pulling force and PMF as a function of close to other computational results [40,41]. All these indi- pulling distance are shown in Figure 7. In the pulling test, cate the reliability of PCFF in terms of predicting the the force first increases linearly with pulling displace- mechanical properties of the modeled cross-linked epoxy. ment, and the functional groups effect can be negligible As the functional groups introduced on the surface of glass as shown in Figure 7(b). The force, then, increases Figure 6: (a) The curve of specific volume as a function of temperature for the cross-linked epoxy. Tg of the cross-linked epoxy is about 489 K, close to the experimental result. (b) The stress–strain curve of the cross-linked epoxy under a fixed strain rate of 108/s. Young’s modulus is about 4.4 GPa.
Surface modification effect on GFR epoxy: A molecular dynamics study 1151
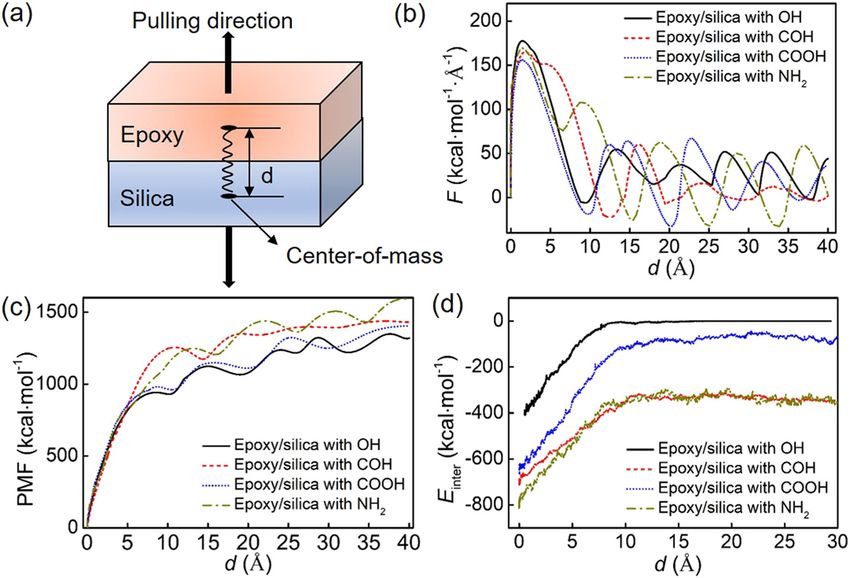
Figure 7: (a) The schematic diagram of pulling for epoxy/silica systems. (b) The curve of pulling force as a function of pulling displacement.
(c) The curve of PMF as a function of pulling displacement. When the PMF reaches the first peak, the pulling force can be negligible
indicating the failure of the interface. (d) The curve of interfacial interactions (Einter) as a function of pulling displacement for different
systems during debonding.
nonlinearly to reach the maximum. The maximum force at the point of PMFpeak. Moreover, when the interface is
(Fmax) is different, indicating that the functional groups completely debonded, the interaction between epoxy and
affect the force for the interface failure. The maximum silica with hydroxyl groups is reduced to zero, while that
OH NH2 COH COOH between epoxy and silica with formyl, carboxyl, and amine
force has a relationship Fmax > Fmax > Fmax > Fmax . The
pulling displacement for the different systems at the groups still exists. This indicates that the surface modifica-
point of Fmax is similar, around 1.1 Å. After pulling force tion of glass fiber changes the interface failure mode.
reaches the maximum, it reduces significantly with the The interfacial bonding energy, the value of Fmax,
increment in pulling displacement. The value of PMF as a PMFpeak, and corresponding d0 for different bilayer sys-
function of d is shown in Figure 7(c). PMF first increases tems are shown in Table 1. The interfacial bonding
linearly, and then increases progressively to reach the first energy for different systems has a relationship of
NH2
peak; PMF finally keeps increasing with fluctuation. It is OH
Ebonding > Ebonding COH
> Ebonding COOH
> Ebonding . The relationship
found that when PMF reaches the first peak, the pulling of the interfacial bonding energy in different systems is
force is almost reduced to zero. The value of the first consistent with the relationship of Fmax. The epoxy/silica
peak PMF (PMFpeak) in different systems has a relationship with hydroxyl groups system has the highest force for
NH2
of PMFCOH COOH OH
peak > PMF peak > PMF peak > PMF peak . The corre- debonding, but the lowest absorbed energy. For the
sponding pulling displacement (d0) of the systems has surface-modified silica, the variation trend of max-
a relationship of d0NH2 > d0COH > d0COOH > d0OH . The change imum pulling force is approximately consistent with
in interfacial interaction (Einter) between epoxy and that of interfacial bonding energy and PMF. For example,
silica with different functional groups during debond- compared with the system with carboxyl groups, the system
ing is shown in Figure 7(d). It is clear that the inter- with amine groups requires higher force and energy for
facial interaction is increased when partial hydroxyl interface debonding. In order to understand the reason
groups on the surface of silica are replaced by formyl, for the difference, the evolution of interfacial structures
carboxyl, and amine groups. There is a relationship during pulling is captured.
NH2
of Einter COH
> Einter COOH
> Einter OH
> Einter . The Einter reduces and The conformational changes at different displace-
then reaches a stable value from the point of PMFpeak. This ments are represented to figure out the reason for the
indicates that the bilayer system is completely debonded change in force and energy. Figure 8 shows the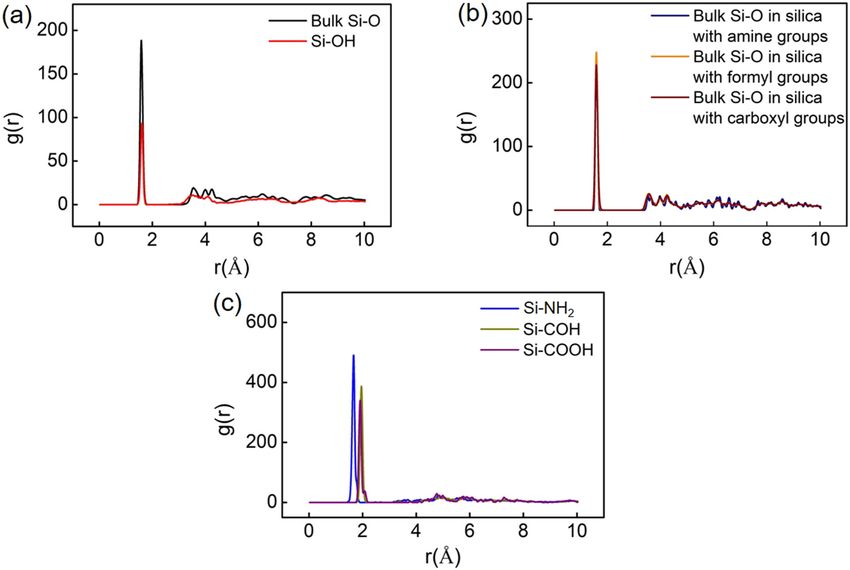
1152 Jiangang Deng et al.
Table 1: The interfacial properties of different epoxy/silica systems, including the functional groups density, interfacial bonding energy
(Ebonding), the maximum pulling force (Fmax), the PMF for debonding (PMFpeak), and the corresponding pulling displacement (d0)
Model Functional group density Fmax PMFpeak d0 Ebonding
(kcal · mol−1 · Å−1) (kcal · mol−1) (Å) (kcal · mol−1 · nm−2)
System 1 OH 177.60 ± 5.70 939.68 ± 30.24 7.96 ± 0.11 262.17 ± 3.13
7.9/nm2
System 2 OH COH 164.77 ± 7.57 1,255.78 ± 30.41 10.95 ± 0.01 80.12 ± 3.68
4/nm2 4/nm2
System 3 OH COOH 155.97 ± 2.35 982.25 ± 29.24 8.73 ± 0.25 77.63 ± 1.25
4/nm2 4/nm2
System 4 OH NH2 169.47 ± 2.92 1,223 ± 28.11 13.19 ± 0.08 168.79 ± 2.37
4/nm2 4/nm2
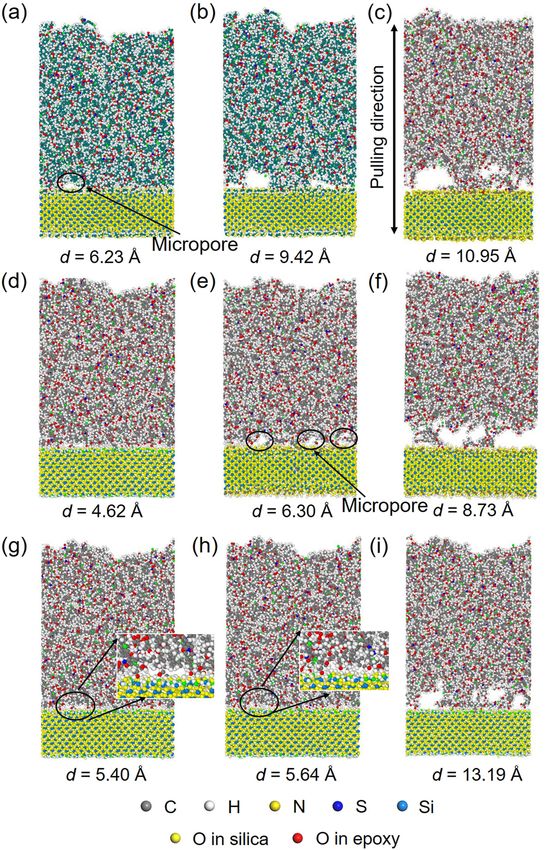
conformation of the epoxy/silica system with hydroxyl more micropores formed (Figure 9e). The number of
groups system at different pulling displacements. After micropores is much larger than that in the system with
the force reaches the peak, with the continuous incre- formyl groups at the same displacement. The coupled
ment in displacement, micropores are generated between effect of formation and growth of micropores leads to
epoxy and silica as shown in Figure 8(b). These micro- the failure of interface with a few polymer chains bonded
pores grow (Figure 8c) resulting in the debonding to silica (Figure 9f). However, after the micropores formed
between epoxy and silica at the point of PMFpeak (Figure 8d). in the system with amine groups (Figure 9g), the size of
The interface fails at the contact surface between epoxy and some micropores is reduced with the increment in dis-
silica; the debonded interface is relatively smooth as shown placement as shown in Figure 9(h). A great number of
in Figure 8(e). The conformational change in the epoxy/ polymer chains are still bonded to silica when the inter-
silica with formyl, carboxyl, and amine groups during face fails as shown in Figure 9(i). This indicates that a
pulling is shown in Figure 9. Different from the system stronger interfacial interaction can prevent the mobility
with hydroxyl groups, the interface fails in the epoxy close of polymer chains, inhibit the generation and growth of
to the interface for these surface-modified systems. Speci- micropores, and even repair the micropores.
fically, the interface failure of the system with formyl For a better understanding of the conformational
groups is mainly due to the localized growth of micropores change in epoxy during deformation, the radius of gyra-
as shown in Figure 9(b). When the interface fails, some tion (Rg) of the epoxy is quantified and calculated by:
polymer chains of epoxy are still bonded to the silica as
1
shown in Figure 9(c). For the system with carboxyl Rg = ∑mi(ri − rcm)2 (4)
M i
groups, the growth of micropores is associated with
Figure 8: The structural evaluation of the interface in the epoxy/silica with hydroxyl groups. (a) The initial equilibrated system; (b) the
generation of micropores; (c) the generation and growth of micropores; (d) the conformation at the point of PMFpeak where the interface fails
at the contact surface between epoxy and silica; and (d) the conformation when the epoxy and silica are completely debonded.Surface modification effect on GFR epoxy: A molecular dynamics study 1153 Figure 9: The structural evaluation of the interface in different systems. For the system with formyl groups, (a) the formation of micropores; (b) the growth of micropores; and (c) the failed interfacial structures at the point of PMFpeak. For the system with carboxyl groups, (d) the formation of micropores; (e) the generation and growth of multi micropores; and (f) the failed interfacial structures at the point of PMFpeak. For the system with amine groups, (g) the formation of micropores; (h) the reduction in micropore size; and (i) the failed interfacial structures with a great number of polymer chains in epoxy still bonded to silica. where M is the total mass of epoxy; rcm is the COM posi- Figure 10(a). However, it reduces significantly to reach tion of the group; ri is the position of atom i; mi is the the minimum value. This rapid reduction is correlated to mass of atom i; and the sum is the overall atoms in the the failure mode. When the interface between epoxy and epoxy. This parameter can be used to evaluate the degree silica is debonded, the motion of polymer chains in epoxy of compression and stretch for polymer chains. Figure 10 is no longer constrained by the interfacial interactions, shows the curves of Rg as a function of pulling displace- and Rg reaches the minimum at the point of PMFpeak. ment d. The Rg of the system with hydroxyl groups first The Rg of the system with formyl groups is first increased increases, and then almost keeps constant as shown in followed by a decrease as shown in Figure 10(b). The
1154 Jiangang Deng et al. Figure 10: Rg of epoxy as a function of displacement during pulling for (a) the system with hydroxyl groups; (b) the system with formyl groups; (c) the system with carboxyl groups; and (d) the system with amine groups. Rg increases obviously at the beginning stage of pulling, consistent with the linear increment in pulling force. When the interface fails, Rg reaches the local minima. reduction of Rg is correlated to the constraint of polymer 3.3 Failure mechanism of surface-modified chains from the silica is reduced with the growth of GFR epoxy micropores. The micropores generated in the epoxy close to the interface cause the increment in Rg. When the The functional groups introduced on the surface of glass interface fails, Rg reaches to the minima due to a signifi- fiber change the interfacial interaction, significantly affect- cant release of constraint. For the system with carboxyl ing the interface debonding behavior. As shown in Figure 11, groups, the Rg fluctuates obviously before the interface there are two types of debonding failure mode for GFR epoxy fails in Figure 10(c). This is correlated to the formation at nanoscale: adhesive failure at the interface between and growth of multi micropores at the contact surface epoxy and glass fiber, and cohesive failure in the epoxy between epoxy and silica and in the epoxy near the matrix. Generally, higher stress is required for the adhesive interface. The Rg of the system with amine groups first failure mode, while more energy is absorbed for the cohesive increases and then reduces slightly in Figure 10(d). The failure mode. Because the increased interfacial interactions reduction is correlated to the formation of micropores. between epoxy and silica can prevent the debonding that However, different from the system with hydroxyl, formyl, occurred at the contact surface between epoxy and silica, and carboxyl groups, the Rg keeps growing with the the matrix has the lowest strength, causing a cohesive increase in the displacement after the point of PMFpeak. failure mode. A stronger interfacial adhesion prevents the This is mainly correlated to the increased number of mobility of polymer chains, inhibiting the generation and polymer chains bonded to silica, where there is still a growth of micropores near the interface, leading to more strong interfacial interaction between epoxy and silica micropores generated in the matrix far from the interface. when the interface is completely debonded. Generally, More energy can be absorbed for the interface debonding. Rg first increases rapidly when the force grows linearly at For example, the introduction of amine groups on the sur- the beginning stage. The reduction in Rg is correlated to face contributes to the improvement in the ability of energy the constraint release from silica caused by the generation absorption, resulting in a much larger displacement for and growth of micropores near the interface. However, interface debonding. Such failure mode is expected because a strong interfacial interaction promotes the growth of GFR epoxy composites have a high ability of energy absorp- micropores within the epoxy matrix far from the interface, tion and the components made up of such composites can leading to an increment in Rg. avoid the catastrophic failures caused by the localized
Surface modification effect on GFR epoxy: A molecular dynamics study 1155
Figure 11: The surface-modified GFR epoxy composites exhibit two types of interface debonding: adhesive failure mode and cohesive failure
mode. The introduction of functional groups significantly affects the interface failure mode. The strong interfacial interactions between
epoxy and silica prevent the debonding at the contact surface between epoxy and silica, leading to a cohesive failure mode.
failure, making them reliable. Moreover, the cohesive failure the interfacial bonding between fiber and matrix include
of interface debonding can make it difficult for fiber pull-out mechanical interlocking, physical binding, and chemical
that initiates from debonding between epoxy and glass fiber. bonding. Our simulated work on the physical binding
Additionally, when the interfacial debonding occurs in the effect between glass fiber and polymer matrix lay a foun-
epoxy close to the interface, methods can be applied to dation to realize precise control over the interface adhesion
improve the properties of epoxy. For example, the cross- of GFR composites. For the example of surface modification
linking degree of the epoxy matrix can be improved to technique of plasma treatment, our results provide a guide-
decrease the speed of micropore growth. The reinforcements line for the selection of the atmosphere parameter. A
such as carbon nanotubes [42] and graphene [43] can be nitrogen atmosphere can be selected to introduce the
added to inhibit micropore growth in the matrix for opti- amine groups on the silica surface for surface modification
mizing the performance of GFR composites. of glass fibers.
In this work, we mainly consider the non-bonded
interactions between glass fiber and epoxy matrix. In
practice, the glass fiber surface modification changes
not only the interfacial interaction but also the surface 4 Conclusion
morphology of fiber and chemical reactivity along the
fiber-matrix interface [44]. The surface roughness and The surface modification techniques with the introduction of
the chemical bonds between epoxy and surface-modified different functional groups have been widely applied to
glass fiber are not considered, because the main purpose improve the interfacial bonding between the glass fiber
of modification of the surface characteristics of glass fiber and epoxy resin. However, as the underlying mechanism
is to improve the compatibility or wettability between is still not fully understood, the surface modification is still
glass fiber and epoxy matrix. The naturally hydrophilic based on the trial-and-error approach to obtain the optimum
epoxy is not inherently compatible with hydrophobic performance of GFR epoxy. The enhancement of interfacial
glass fiber. Composites with improved wettability can properties for GFR epoxy by surface modification is limited.
have superior interfacial bonding. Moreover, the effect In this work, the effect of functional groups on the interfacial
of roughness on interfacial adhesion is complicated. An behavior between epoxy and silica at atomistic scale has
increment in surface roughness of glass fiber contributes been studied. The DGEBA and 44DDS are cross-linked to
to the mechanical interlocking between fiber and polymer form epoxy resin. The interfacial properties of the epoxy/
matrix. However, with a further increase in surface roughness, silica systems have been predicted by the pulling test using
the fiber is damaged with a reduction in mechanical SMD simulations. Based on the findings, several conclusions
properties. Compared with the non-bonded interfacial can be drawn:
interactions, the chemical bonds at interface and the 1) The epoxy/silica system with hydroxyl groups requires
surface roughness are more difficult to be controlled. the highest force, but the shortest pulling displacement
For surface modification techniques, the factors affecting and the lowest energy for interface debonding. The1156 Jiangang Deng et al.
system fails at the contact surface between epoxy and [3] Rajak DK, Pagar DD, Menezes PL, Linul E. Fiber-reinforced
silica, exhibiting an adhesive failure mode. polymer composites: manufacturing, properties, and
2) When partial hydroxyl groups are replaced by formyl, applications. Polymers. 2019;11(10):1667.
[4] Ren D, Li K, Chen L, Chen S, Han M, Xu M, et al. Modification on
carboxyl, and amine groups, respectively, the system
glass fiber surface and their improved properties of fiber-
fails in the epoxy close to the interface, represent- reinforced composites via enhanced interfacial properties.
ing a cohesive failure mode. Although the pulling Compos Part B Eng. 2019;177:107419.
force for debonding is reduced compared with that [5] Zhang H, Han W, Tavakoli J, Zhang Y-P, Lin X, Lu X, et al.
in the system with hydroxyl groups, more energy is Understanding interfacial interactions of polydopamine and
glass fiber and their enhancement mechanisms in epoxy-
absorbed for the rearrangement of polymer chains in
based laminates. Compos Part A Appl Sci Manuf.
epoxy. 2019;116:62–71.
3) When the epoxy/surface-modified silica system exhibits [6] Jing M, Che J, Xu S, Liu Z, Fu Q. The effect of surface modifi-
a cohesive failure mode, the force and energy for de- cation of glass fiber on the performance of poly(lactic acid)
bonding are increased with the increment in the interface composites: Graphene oxide vs silane coupling agents. Appl
Surf Sci. 2018;435:1046–56.
interactions. Compared with the system with carboxyl
[7] Huang J, Li W, Huang D, Wang L, Chen E, Wu CY, et al. Fractal
groups, the systems with amine and formyl groups require
analysis on pore structure and hydration of magnesium oxy-
a relatively higher force and energy for debonding because sulfate cements by first principle, thermodynamic and micro-
of the stronger interfacial interaction. structure-based methods. Fractal Fract. 2021;5(4):164.
[8] Wu M, Jia L, Lu S, Qin Z, Wei S, Yan R. Interfacial performance
Our work reveals the mechanism of different func- of high-performance fiber-reinforced composites improved by
cold plasma treatment: a review. Surf Interfaces.
tional groups on the interfacial behavior of GFR epoxy.
2021;24:101077.
Such understanding is fundamental to figure out the [9] Abbas YM, Khan IM. Fiber-matrix interactions in fber-rein-
reason for the variation in interfacial performance caused forced concrete: a review. Arab J Sci Eng. 2016;41(4):1183–98.
by different glass fiber surface modification techniques. [10] Zhou Y, Fan M, Chen L. Interface and bonding mechanisms of
The findings in this work lay a foundation for the accu- plant fibre composites: an overview. Compos Part B: Eng.
rate control of interfacial properties of GFR composites by 2016;101:31–45.
[11] Singh DK, Vaidya A, Thomas V, Theodore M, Kore S, Vaidya U.
surface modification.
Finite element modeling of the fiber-matrix interface in
polymer composites. J Compos Sci. 2020;4(2):58.
Funding information: The work described in this article [12] Karger-Kocsis J, Mahmood H, Pegoretti A. Recent advances in
was fully supported by the grant from State Grid Electric fiber/matrix interphase engineering for polymer composites.
Power Research Institute (Project Number: 524625190052), Prog in Mater Sci. 2015;73:1–43.
[13] Hao H, Tam L-H, Lu Y, Lau An D. atomistic study on the
and the Natural Science Foundation of Huber Province
mechanical behavior of bamboo cell wall constituents.
(2021CFB137). The numerical calculations in this work Compos Part B Eng. 2018;151:222–31.
have been done on the supercomputing system in the [14] Hao H, Chow CL, Lau D. Carbon monoxide release mechanism
Supercomputing Center of Wuhan University. in cellulose combustion using reactive forcefield. Fuel.
2020;269:117422.
Author contributions: All authors have accepted respon- [15] Hao H, Hui D, Lau D. Material advancement in technological
development for the 5G wireless communications.
sibility for the entire content of this manuscript and
Nanotechnol Rev. 2020;9(1):683–99.
approved its submission. [16] Ju SP, Chen CC, Huang TJ, Liao CH, Chen HL, Chuang YC, et al.
Investigation of the structural and mechanical properties of
Conflict of interest: The authors state no conflict of interest. polypropylene-based carbon fiber nanocomposites by experi-
mental measurement and molecular dynamics simulation.
Comput Mater Sci. 2016;115:1–10.
[17] Wang H, Jin K, Wang C, Guo X, Chen Z, Tao J. Effect of fiber
surface functionalization on shear behavior at carbon fiber/
References epoxy interface through molecular dynamics analysis. Compos
Part A Appl Sci Manuf. 2019;126:105611.
[1] Hu Z, Zhang D, Lu F, Yuan W, Xu X, Zhang Q, et al. Multistimuli- [18] Accelrys Software Inc.: Materials Studio 2007.
responsive intrinsic self-healing epoxy resin constructed by [19] Plimpton S. Fast parallel algorithms for short-range molecular
host-guest interactions. Macromolecules. dynamics. J Comput Phys. 1995;117(1):1–19.
2018;51(14):5294–3. [20] Hao H, Zhou W, Lu Y, Lau D. Atomic arrangement in CuZr-based
[2] Ma H, Zhang X, Ju F, Tsai SB. A study on curing kinetics of metallic glass composites under tensile deformation. Phys
nano-phase modified epoxy resin. Sci Rep. 2018;8(1):3045. Chem Chem Phys. 2019;22(1):313–24.Surface modification effect on GFR epoxy: A molecular dynamics study 1157
[21] Pramanik C, Nepal D, Nathanson M, Gissinger JR, Garley A, [34] Campanelli AR. Stereoelectronic effects in the Si–C bond: a
Berry RJ, et al. Molecular engineering of interphases in polymer/ study of the molecular structure and conformation of
carbon nanotube composites to reach the limits of mechanical tetraphenylsilane by gas-phase electron diffraction and
performance. Compos Sci Technol. 2018;166:86–94. theoretical calculations. J Phys Chem.
[22] Amariutei OA, Ramsdale-Capper R, Correa Álvarez M, 2001;105(24):5933–9.
Chan LKY, Foreman JP. Modelling the properties of a [35] Min K, Kim Y, Goyal S, Lee SH, McKenzie M, Park H, et al.
difunctional epoxy resin cured with aromatic diamine isomers. Interfacial adhesion behavior of polyimides on silica glass: a
Polymer. 2018;156:203–13. molecular dynamics study. Polymer. 2016;98:1–10.
[23] Leroch S, Wendland M. Simulation of forces between humid [36] Sun Q, Zhao Y, Choi K-S, Hou X, Mao X. Reduction of atomistic
amorphous silica surfaces: a comparison of empirical ato- ice tensile stress by graphene–carbon nanotube coating. Appl
mistic force fields. J Phys Chem C. 2012;116(50):26247–61. Surf Sci. 2021;565:150562.
[24] Pedone A. Properties calculations of silica-based glasses by [37] Cruz-Chú ER, Villegas-Rodríguez GJ, Jäger T, Valentini L,
atomistic simulations techniques- a review. J Chem Phys. Pugno NM, Gkagkas K, et al. Mechanical characterization
2009;1136:20773–84. and induced crystallization in nanocomposites of thermo-
[25] Moller JC, Berry RJ, Foster HA. On the nature of epoxy resin plastics and carbon nanotubes. Npj Comput Mater.
post-curing. Polymers. 2020;12(2):466. 2020;6(1):151.
[26] Fu K, Xie Q, Lu F, Duan Q, Wang X, Zhu Q, et al. Molecular [38] Lu N, Li ZY, Yang JL. Structure of graphene oxide: the-
dynamics simulation and experimental studies on the ther- rmodynamics versus kinetics. J Phys Chem.
momechanical properties of epoxy resin with different anhy- 2011;115(24):11991–5.
dride curing agents. Polymers. 2019;11(6):975. [39] Jin K, Luo H, Wang Z, Wang H, Tao J. Composition
[27] Becker O, Varley R, Simon G. Morphology, thermal relaxations optimization of a high-performance epoxy resin based on
and mechanical properties of layered silicate nanocomposites molecular dynamics and machine learning. Mater Des.
based upon high-functionality epoxy resins. Polymer. 2020;194:108932.
2002;43:4365–73. [40] Xie Q, Fu K, Liang S, Liu B, Lu L, Yang X, et al. Micro-structure
[28] Patwardhan SV, Emami FS, Berry RJ, Jones SE, Naik RR, and thermomechanical properties of crosslinked epoxy
Deschaume O, et al. Chemistry of aqueous silica nanoparticle composite modified by nano-SiO2: a molecular dynamics
surfaces and the mechanism of selective peptide adsorption. J simulation. Polymers. 2018;10(7):801.
Am Chem Soc. 2012;134(14):6244–56. [41] Jeyranpour F, Alahyarizadeh G, Arab B. Comparative
[29] Thipperudrappa S, Ullal Kini A, Hiremath A. Influence of zinc investigation of thermal and mechanical properties of
oxide nanoparticles on the mechanical and thermal responses cross-linked epoxy polymers with different curing agents
of glass fiber‐reinforced epoxy nanocomposites. Polym by molecular dynamics simulation. J Mol Graph Model.
Compos. 2019;41(1):174–81. 2015;62:157–64.
[30] Shrivastava A. Introduction to plastics engineering. 1st edn. [42] Pan S, Dai Q, Safaei B, Qin Z, Chu F. Damping characteristics of
Oxford: William Andrew; 2018. carbon nanotube reinforced epoxy nanocomposite beams.
[31] Rimsza JM, Jones RE, Criscenti LJ. Surface structure and sta- Thin-Walled Struct. 2021;166:108127.
bility of partially hydroxylated silica surfaces. Langmuir. [43] Wang Y, Ermilov V, Strigin S, Safaei B. Multilevel modeling of
2017;33(15):3882–91. the mechanical properties of graphene nanocomposites/
[32] Kaliannan NK. Monte carlo simulations of amorphous hydro- polymer composites. Microsyst Technol.
xylated silica (SiO2) nanoparticles. Comput Mater Sci. 2021;27(12):4241–51.
2017;135:90–8. [44] Cho K, Wang G, Raju Fang J, Rajan G, Stenzel MH, Farrar P,
[33] Ippolito MMeloni S. Atomistic structure of amorphous silicon et al. Selective atomic-level etching on short S-glass fibres to
nitride from classical molecular dynamics simulations. control interfacial properties for restorative dental compo-
Phys Rev B. 2011;83:165209. sites. Sci Rep. 2019;9(1):3851.You can also read