The tidal measurements of James Cook during the voyage of the Endeavour - HGSS
←
→
Page content transcription
If your browser does not render page correctly, please read the page content below
Hist. Geo Space Sci., 9, 85–103, 2018
https://doi.org/10.5194/hgss-9-85-2018
© Author(s) 2018. This work is distributed under
the Creative Commons Attribution 4.0 License.

              The tidal measurements of James Cook during the
                           voyage of the Endeavour
                                           Philip L. Woodworth1 and Glen H. Rowe2
                                        1 National  Oceanography Centre, Liverpool, UK
                                  2 Land   Information New Zealand, Wellington, New Zealand
            Correspondence: Philip L. Woodworth (plw@noc.ac.uk) and Glen H. Rowe (growe@linz.govt.nz)

                          Received: 27 February 2018 – Accepted: 10 April 2018 – Published: 31 May 2018

       Abstract. The main priority of the first of James Cook’s famous voyages of discovery was the observation of
       the transit of Venus at Tahiti. Following that, he was ordered to embark on a search for new lands in the South
       Pacific Ocean. Cook had instructions to record as many aspects of the environment as possible at each place
       that he visited, including the character of the tide. This paper makes an assessment of the quality of Cook’s
       tidal observations using modern knowledge of the tide, and with an assumption that no major tidal changes have
       taken place during the past two and half centuries. We conclude that Cook’s tidal measurements were accurate
       in general to about 0.5 ft (15 cm) in height and 0.5 h in time. Those of his findings which are less consistent with
       modern insight can be explained by the short stays of the Endeavour at some places. Cook’s measurements were
       good enough (or unique enough) to be included in global compilations of tidal information in the 18th century
       and were used in the 19th century in the construction of the first worldwide tidal atlases. In most cases, they
       support Cook’s reputation as a good observer of the environment.

1   Introduction                                                        until you discover it [Terra Australis], or fall in
                                                                        with the Eastern side of the land discover’d by Tas-
The years 2018–2021 mark the 250th anniversary of the fa-               man and now called New Zeland.
mous voyage of Lt James Cook aboard HM Bark Endeav-
our. Following his observation of the transit of Venus at            Cook was told to make many observations during the voy-
Tahiti, Cook embarked on a remarkable set of discoveries           age, including detailed observations of flora and fauna, the
in the SW Pacific, including the first landing by Europeans        nature of soils and minerals, etc. More conventionally for
in New Zealand and the first survey of the east coast of Aus-      someone in command of a vessel in the Royal Navy, he was
tralia. The findings of Cook and others on the Endeavour,          ordered to observe
notably Joseph Banks, have been discussed in detail by Bea-             the Variation of the Needle, bearings of Head
glehole (1955) and by many other authors.                               Lands, Height, direction and Course of the Tides
   Cook carried two sets of orders, both marked “secret”. The           and Currents, Depths and Soundings of the Sea,
first set ordered him to proceed to Tahiti, which had been se-          Shoals, Rocks &ca and also surveying and making
lected by the Royal Society as a suitable site to observe the           Charts, and taking Views of Such Bays, Harbours
transit of Venus on 3 June 1769. Tahiti had been discovered             and Parts of the Coasts as may be useful to Navi-
shortly before (June 1767) by Lt Samuel Wallis aboard HMS               gation.
Dolphin and named “King George the Third’s Island”. The
second set of orders instructed Cook, once the transit had           Any natives were to be treated well.
been observed, to embark on a search for the great southern          Cook already had an excellent reputation as a marine sur-
continent (Terra Australis), which had been included specu-        veyor, a fact which had been important in his selection as
latively on maps of the world for hundreds of years. He was        captain of the Endeavour (Skelton, 1954; Ritchie, 1978). He
then to head westward between 35 and 40◦ S                         was also a skilled scientific observer who, for example, took

Published by Copernicus Publications.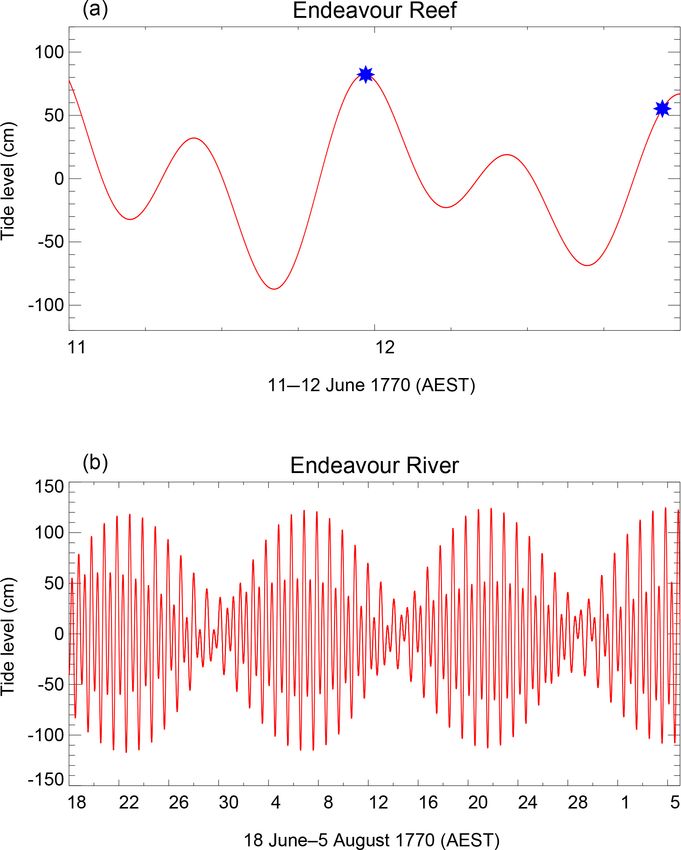
86                                                P. L. Woodworth and G. H. Rowe: The tidal measurements of James Cook

responsibility for the astronomical measurements of the tran-      cant change in the tide during the past 250 years. In fact,
sit alongside the official astronomer Charles Green (Badger,       small secular tidal changes are known to have occurred at
1970; Orchiston, 2004). In addition, as might be expected,         other locations, but they are too small to be of importance
the daily entries in his journal often include observations of     to the present investigation (e.g. Woodworth, 2010). Other
tides, weather, appearance of coastlines and environmental         processes, such as storm surges or seiches, might also have
conditions. Literal transcriptions of the copies of the journals   contributed to sea level variation on similar timescales to the
of Cook and Banks held by the National Library of Australia        tide during Cook’s observation periods. However, we have
are freely available at http://southseas.nla.gov.au/ (see Bea-     no way of modelling them, and the assumption has to be that
glehole, 1955, for an explanation of the differences between       any “tide” observed by him was simply the astronomical tide.
the various copies of Cook’s journal).                                To our knowledge, only one assessment of Cook’s tides
   In this paper, we consider one particular aspect of Cook’s      has been made before. David (1988) made use of tidal infor-
observations – those to do with the tides. These included the      mation provided by the UK Hydrographic Office (UKHO),
heights and times of the ocean tide at the places he visited and   but for locations in Australia only, not at Tahiti or New
of the tidal streams he encountered during the voyage. The         Zealand. In the discussion below we comment on this pre-
former are taken largely from observations noted in the daily      vious UKHO comparison.
entries and summarised in a table which Cook later passed to
Nevil Maskelyne, the Astronomer Royal, who had them pub-
                                                                   2     Tides past and present
lished in Philosophical Transactions (Cook, 1772). There are
some other observations of tidal elevations in the daily en-       2.1    Measurements of tidal establishment
tries not in the publication, which we refer to below. Further
aspects of the tides are mentioned in Cook and Green (1771)        Table 1 is taken from Cook (1772) and claims to show the
and Cook (1776).                                                   range and timing of the tide at new and full moons at 14
   Cook and Green (1771) is particularly interesting, in that      locations during the Endeavour voyage (Fig. 1). Anyone in-
it is the only publication (as far as we know) to include the      terested in tides in the 18th century would have interpreted
original observations of the tides, from which the summary         this table as follows.
in Cook (1772) was derived (at Tahiti in this case). In many          The range (Cook calls this “Rise and Fall”) would have
of the cases reported in Cook (1772), the Endeavour was            been taken to be the difference in height between high and
present at that location for only a day or so. Therefore, we       low tide at new and full moon. This quantity would have
expect that in those examples there were no detailed obser-        been known to be almost the same as the range at spring
vations at all, and that the values reported in Cook (1772)        tides. However, springs do not always coincide with new
were based simply on his general impressions as a skilled          and full moons, and in most parts of the world they occur
observer.                                                          about 1–2 days later. This lag is called the age of the tide, a
   Cook was probably responsible himself for all the tidal         term coined by William Whewell (Cartwright, 1999). Con-
measurements during the Endeavour voyage. For example,             sequently, the range at new and full moon is slightly smaller
the entry in his journal for 5 December 1769 refers to the         than at springs.
“few observations I have been able to make of the tides”,             The timing would have been assumed to be a quan-
and his later publications (Cook, 1772, 1776) refer to “my         tity called high water full and change (HWFC), later
observations on the tides”. Deacon (1971) suggests that            called establishment by Lubbock (1831), and subsequently
Cook shared the tidal work with Green, based on Cook and           vulgar or common establishment by Whewell (1833).
Green (1771) being a summary of measurements by them               Cartwright (1999) gives a history of how Lubbock and
both at Tahiti. However, while they both contributed to mea-       Whewell came to use these terms. HWFC represents the lag
surements of the transit (Orchiston, 2004, 2017), there is         between the moon’s transit of the meridian at the location in
no evidence that Green contributed to the tides. This sit-         question and the next occurrence of high tide, at times when
uation contrasts with Cook’s second voyage of discovery.           the moon, earth and sun are aligned (syzygy). Because we de-
David (1992) explains how William Wales, the astronomer            fine time with respect to the sun, HWFC also corresponds to
of the Resolution, and William Bayly on the Adventure had          the time of day that high tide occurs, measured at that merid-
the responsibility for tidal measurements during the second        ian and on the day of new and full moon.
voyage. Both of them used a type of tide gauge called a still-        Spring tidal range and HWFC were widely used during
ing well, consisting of a long narrow vertical tube with an        the 18th century as the two parameters with which to char-
aperture in the bottom to admit the water. By contrast, there      acterise the tide at any location. They had both practical
is no information on how Cook’s tidal measurements on the          and scientific importance. Seafarers would have known how
Endeavour voyage were made.                                        they varied along a coastline, so aiding safe navigation (La-
   Our assessment of the quality of Cook’s tidal observa-          lande, 1781, refers to a Manuel du Pilote, which contains
tions has been made by comparison to those by modern tide          such information for the 60 principal ports in Europe). They
gauges, with an assumption that there has been no signifi-         were also the parameters used by researchers of the tides,

Hist. Geo Space Sci., 9, 85–103, 2018                                                  www.hist-geo-space-sci.net/9/85/2018/
P. L. Woodworth and G. H. Rowe: The tidal measurements of James Cook 87
Table 1. The 14 locations where Cook estimated the timing (high water, hours and minutes) and range (rise and fall, feet and inches) of the
tide at new and full moon, adapted from the table in Cook (1772). Latitudes and longitudes are as stated by Cook (1772), except for Thirsty
Sound (station 12), which is given as 25◦ 050 S in Cook (1772). This is an obvious typographical error, with his journal entry of 30 May
1770 being 22◦ 050 S. (See the comments on the general quality of Cook’s longitudes in the text.) Rise and fall was not estimated at Lagoon
Island (station 2). For Endeavour River (station 13), high water of 9:15 has been assumed, as given in Cook (1776) instead of 9:30 in Cook
(1772). The final column shows the approximate number of days that the Endeavour spent at each location as inferred from the daily entries
in Cook’s journal.
New and full moon
Names of observed places Lat. Long. High water Rise and Fall Days
(S) (W) (h) (min) (ft) (in.)
1 Success Bay in Strait le Maire 54◦ 450 66◦ 040 4 30 5 6 5
2 Lagoon Island 18◦ 470 139◦ 280 0 30 – – ∗
3 Matavai Bay, Otaheita (Tahiti) 17◦ 290 149◦ 300 0 30 0 11 90
4 Tolaga Bay, East coast of New Zealand 38◦ 220 181◦ 140 6 0 5 6 6
5 Mercury Bay, NE New Zealand 36◦ 480 184◦ 040 7 30 7 0 12
6 River Thames, NE New Zealand 37◦ 120 184◦ 120 9 0 10 0 3
7 Bay of Islands, NE New Zealand 35◦ 140 185◦ 360 8 0 7 0 6
8 Queen Charlotte’s Sound, 41◦ 000 184◦ 450 9 30 7 6 21
Cook’s Strait, New Zealand
9 Admiralty Bay, Cook’s Strait, New Zealand 41◦ 450 185◦ 120 10 0 7 0 5
10 Botany Bay, coast of New South-Wales 34◦ 000 208◦ 370 8 0 4 6 8
11 Bustard Bay, coast of New South-Wales 24◦ 300 208◦ 200 8 0 8 0 2
12 Thirsty Sound, coast of New South-Wales 22◦ 050 210◦ 240 11 0 16 0 2
13 Endeavour River, coast of New South-Wales 15◦ 260 214◦ 480 9 15 9 0 48
14 Endeavour’s Strait, which 10◦ 370 218◦ 450 1 30 11 0 1
divides New Guinea from New Holland
∗ for Lagoon Island indicates a stay of only a few hours (see text).
who were eager to have similar information from further where κ(M2) is the phase lag of M2 and s(M2) is its angular
afield (Lalande, 1781). These simple parameters were de- speed. The difference between HWFC and MHWI depends
vised in Europe, with its predominantly semidiurnal tidal upon the age of the tide, with the difference being approx-
regime. HWFC was expressed in the range 0–12 h and so imately 30 min for parts of the world’s coastline where the
had an inherent precision of ∼ 25 min for prediction of the tide’s age is about 2 days. Appendix A provides more infor-
time of any particular morning or afternoon semidiurnal tide mation on the relationships between these quantities.
(which is why Whewell, 1859, described establishment as a The compilation of Lalande (1781) contains many values
“loose parameter”). of HWFC and tidal range from locations around the world.
If the tide consisted of only a semidiurnal lunar compo- Most of these were from ports where it would have been
nent (called M2), then the lag between lunar transit and high straightforward to make observations of timing of the tide
water would be the same for every tide. However, the exis- on the actual days of new and full moon. However, how did
tence also of a semidiurnal solar component (S2) results in Cook (or other captains in the 18th century) estimate HWFC
the lag between lunar transit and high water varying over the from observations of the tide at newly discovered locations
spring–neap cycle by typically ±30–60 min. This variation during short stays in between new and full moon? Figure 2
is known as “priming” and “lagging” and the amplitude of gives a summary of the periods of Cook’s stay at each of the
the variation depends on the magnitude of S2 relative to M2. stations in Table 1 with respect to the days since new moon.
Consequently, HWFC can differ significantly from the aver- At many stations he was present for new (or full) moon, but
age lag that occurs between lunar transit and high tide, called at others such as River Thames1 (station 6) and Bay of Is-
the mean high water interval (MHWI). MHWI was much lands (7) in New Zealand or Thirsty Sound (12) in Australia
preferred as a tidal parameter by Whewell, who called it his visit took the form of a short stay in between new and full
the corrected or mean establishment (Whewell, 1833, 1859; moons.
Cartwright, 1999). In the later nomenclature of harmonic
1 River Thames is the name used by Cook; today this is known
tidal constituents, one can express MHWI as
as Firth of Thames. The names of several other localities that Cook
κ(M2) visited have changed – we use Cook’s nomenclature when referring
MHWI = , (1) to his work and current names when using modern sources.
s(M2)
www.hist-geo-space-sci.net/9/85/2018/ Hist. Geo Space Sci., 9, 85–103, 201888 P. L. Woodworth and G. H. Rowe: The tidal measurements of James Cook
Figure 1. Locations of Cook’s tidal observations: (a) before New Zealand, (b) New Zealand and (c) Australia. Stations 1–14 are listed
in Table 1 and stations M, K, C and R in Appendix B. Maps are made using Natural Earth free vector and raster map data (http://www.
naturalearthdata.com).
We have not found any publication which provides a satis- David (1988) suggests that Cook must have used a proce-
factory answer to this question. However, the only possibility dure similar to that given by Moore (1800), who states,
is that a rough correction would have been applied to the time
of high water observed on a particular day, assuming that the
time of high tide advances by 50 min per day and knowing Find the time of the moon’s southing2 on that day,
the number of days that had elapsed since the last new (or and subtract from it the time of high water at the
full) moon (the moon’s age). In fact, one can show that, in given place, if you can, and the remainder will be
the case of a simple tide consisting of M2 and S2, if one the time of high water on the full and change days
knows the exact time of day when new moon occurs, then of the moon.
the difference between that and the time of the high tide on
a particular day provides a perfect correction for obtaining
2 An archaic term for the moon’s transit of the southern meridian
HWFC.
(as seen from the Northern Hemisphere).
Hist. Geo Space Sci., 9, 85–103, 2018 www.hist-geo-space-sci.net/9/85/2018/P. L. Woodworth and G. H. Rowe: The tidal measurements of James Cook 89
Periods of the Endeavour’s stay at each station
14
13
12
11
10
Station number
9
8
7
6
5
4
3
2
1
0 7 14 21 28
Days since previous new moon
Figure 2. A schematic summary of the periods of the Endeavour’s stay at each station in Table 1 expressed as days since the last new moon
at Greenwich.
This is the same procedure explained by Whewell (1859) HWFC and MHWI are largest (i.e. where the age of the tide
for obtaining the corrected establishment (MHWI), once is largest, which applies to several New Zealand stations),
small corrections for priming and lagging have been made. Cook’s values are indeed closer to the computed HWFC than
It is just about plausible that Cook could also have worked to MHWI.
this way. He would have had a copy of The Nautical Almanac However, the real ocean tide is never a simple combina-
(first published in 1767), from which he could have com- tion of M2 and S2. Even where the tide is predominantly
puted the local time of lunar transit to adequate accuracy for semidiurnal, such as at most of the locations discussed here,
subtraction from the time of high water. The local time of there are other constituents which can be important. For ex-
transit could be estimated readily from the published time of ample, New Zealand has predominantly semidiurnal tides,
transit at Greenwich by adding 2 min for every hour of lon- with the largest amplitudes on the north-west coasts (Walters
gitude west of Greenwich. He would not have been able to et al., 2001). However, N2 (the constituent which describes
make priming and lagging corrections. However, how would the variation of the semidiurnal tide over a month) has an
such a busy man as Cook have had time to make such cal- amplitude several times that of S2 along parts of the east
culations? Cook would have had time once he arrived home. coast. At these locations, the semidiurnal tide varies primar-
However, the values in Cook (1772) are direct copies of the ily over a month instead of a fortnight. Then, there are loca-
values in the daily entries of his journal, so they must have tions where diurnal constituents can have comparable mag-
been the numbers that he decided upon at the time. Anyway, nitude to semidiurnal constituents, such as along the coasts
as explained above, the result of any such calculation involv- of NE Australia.
ing The Nautical Almanac, as in Moore (1800), would have Consequently, there are two aspects to our examination of
provided a quantity closer to MHWI than to HWFC. Cook’s tidal measurements. One concerns whether his esti-
Therefore, we do not believe that Cook and other cap- mates of range and timing are consistent with the average val-
tains worked this way at this time, and certainly most of ues of those quantities derived from modern measurements
them would not have had copies of The Nautical Almanac of M2 and S2 and therefore whether they have value as repre-
at this point in the 18th century. We suspect that Cook made sentative of longer-term knowledge of the tide. A second as-
a more rough-and-ready correction to obtain HWFC, as ex- pect is to consider whether any differences can be explained
plained above. We show below a comparison of his findings by the Endeavour’s short stays and the existence of tidal con-
to a modern calculation of HWFC using formulae given by stituents additional to M2 and S2. In the case of a significant
Doodson and Warburg (1941) in the case of an idealised tide contribution from other constituents, Cook (or any other cap-
containing M2 and S2 constituents only (see Appendix A). tain) can hardly be criticised for having made estimates of
It will be seen that, at locations where differences between
www.hist-geo-space-sci.net/9/85/2018/ Hist. Geo Space Sci., 9, 85–103, 201890 P. L. Woodworth and G. H. Rowe: The tidal measurements of James Cook
range and HWFC that differ from their long-term average before those of AM or “morning”. An uncertainty of a day
values. can clearly be important when considering tidal information.
It should also be noted that during the extended stay at Tahiti
2.2 Aspects of Cook’s tidal measurements for the transit of Venus, Cook reverted to the use of the civil
day.
Before making a detailed comparison to modern information, A second aspect to keep in mind is that Cook did not make
it is worth considering how accurate Cook’s measurements an adjustment of +1 day to his dates when the Endeavour
might have been, especially at locations where the Endeav- crossed the 180◦ meridian (in effect, the modern Interna-
our stayed for only a short time. If one looks for tidal in- tional Date Line) when travelling west across the Pacific to-
formation in the daily entries, one finds statements such as at wards New Zealand. Instead, he incremented his dates by one
Queen Charlotte’s Sound, New Zealand, on 6 February 1770: when he arrived at Batavia (now known as Jakarta, capital
In sailing in or out of this Sound with little wind of Indonesia) on 10 October 1770. These complications are
attention must be had to the Tides which flows 9 or straightforward to deal with once they are realised, with any
10 oClock at the full and change of the Moon and of Cook’s dates converted to civil ones before comparison to
rises and falls upon a perpendicular 7 or 8 feet. modern tidal information.
Finally, one should note that the values of longitude re-
This statement converts to the stated timing of 9:30 and ported by Cook were often highly inaccurate (Keir, 2010),
range of 7 ft 6 in. given in Table 1. Similarly, at Botany Bay, partly due to the lack of an accurate chronometer. Any un-
New South Wales, on 6 May 1770: certainty in longitude can enter into a comparison of Cook’s
tides to modern tidal information via the use of the phase
I had almost forgot to mention
lags of tidal constituents (κ), such as given for M2 above.
that the tide in∧it is high water in this Harbour∧Bay flowes
Phase lags are now stored in catalogues such as the Admi-
at the full and change of the Moon about 8 o’
ralty Tide Tables as Greenwich phase lags (G), or as phase
Clock and rises and falls upon a perpendicular
lags (g) in a given time zone west (TZW) of Greenwich (e.g.
about 4 or 5 feet,
TZW = −1200 h for New Zealand). κ, G and g are related
which converts to 8:00 and 4 ft 6 in. given in Table 1. There- via
fore, in most cases an accuracy (akin to a standard error) is
implied of ∼ 0.5 h and ∼ 0.5 ft in timing and range respec- κ = G − nλ, (2a)
tively.
TZW
A second consideration with regard to timing is that Cook κ = g − nλ + s, (2b)
100
worked throughout using apparent (sun dial) time. The En-
deavour did not carry an accurate chronometer which would where λ is longitude west of Greenwich; n = 1 and 2 for a
have provided mean time. Cook had only a small watch that diurnal and semidiurnal constituent respectively; and s is the
had to be adjusted regularly to apparent time using sextant angular speed of the constituent (e.g. 28.9841◦ h−1 for M2,
observations of the local noon (Keir, 2010). Apparent time 30◦ h−1 for S2). Therefore, an error in λ propagates into an
was anyway appropriate with regard to the Endeavour’s nav- error in κ. Consequently, any comparison of tide times has
igation, given that the astronomical information in The Nau- to employ modern estimates of longitude and disregard those
tical Almanac was also given in apparent time (but according given by Cook.
to the astronomical day which begins at noon on the civil
day). However, modern estimates of the tide are calculated 2.3 Modern tidal information
in mean time, which differs from apparent time by ±16 min
depending on the day in the year (the equation of time, see The modern tidal information used in this paper is in the form
Hughes et al., 1989). Therefore, in principle, any comparison of predictions of the height and time of the tide based on har-
of times of the tide by Cook and from modern measurements monic constants (amplitudes and phase lags) derived from
should be made using mean time throughout. We decided to extensive observations by tide gauges located as near as pos-
ignore this complication for present purposes given the larger sible to the sites in Table 1 where Cook made his own mea-
uncertainties mentioned above. surements. Table 2 lists the 14 modern tide gauge stations
There are further considerations to do with the way that that were chosen.
Cook recorded dates. As was standard practice in the Royal In the case of New Zealand stations, we used sets of con-
Navy at that time, Cook’s daily entries are given according stants computed by Land Information New Zealand (LINZ)
to the naval day (ship time). In that system, the naval day containing between 9 and 26 constituents depending on the
begins at noon on the preceding civil day and ends at noon on station. For most Australian and other locations, the four
the civil day in question, rather than at midnight (and so the main constants (M2, S2, K1 and O1) were considered to be
naval day is 1 day ahead of the astronomical day). Therefore, sufficient for an adequate description of the tide. These were
statements of PM or “afternoon” appear in the journal entry taken from either the Admiralty Tide Tables (ATT) (UKHO,
Hist. Geo Space Sci., 9, 85–103, 2018 www.hist-geo-space-sci.net/9/85/2018/P. L. Woodworth and G. H. Rowe: The tidal measurements of James Cook 91
Table 2. Locations with modern tidal measurements, as near as possible to those reported by Cook in Table 1. The final columns give the
tidal constants for the M2 and S2 constituents (phase lag (g) in degrees and amplitude (H) in metres) as computed in the time zone shown
(the number of hours west of Greenwich × 100). The constants were obtained from the Admiralty Tide Tables (ATT), Australian National
Tide Tables (ANTT), Land Information New Zealand (LINZ), and the global tide model of Cheng and Andersen (2010) from the Technical
University of Denmark (DTU).
M2 S2
Source Place name Lat. Long. Time g H g H
zone (deg) (m) (deg) (m)
1 ATT Bahía Aguirre 54◦ 550 S 65◦ 580 W +0300 165 0.54 225 0.140
2 DTU Vahitahi 18◦ 470 S 138◦ 500 W 0 1 0.293 325 0.083
3 ATT Papeete 17◦ 320 S 149◦ 340 W +1000 16 0.07 20 0.070
4 LINZ Cook’s Cove 38◦ 230 S 178◦ 200 E −1200 167 0.652 268 0.070
5 LINZ Whitianga 36◦ 500 S 175◦ 420 E −1200 196 0.702 272 0.091
6 LINZ Rocky Point 37◦ 060 S 175◦ 310 E −1200 200 1.289 270 0.199
7 LINZ Russell 35◦ 160 S 174◦ 070 E −1200 210 0.811 267 0.139
8 LINZ Long Island 41◦ 070 S 174◦ 170 E −1200 247 0.484 327 0.219
9 LINZ Catherine Cove 40◦ 520 S 173◦ 530 E −1200 259 0.817 321 0.308
10 ANTT Botany Bay 33◦ 590 S 151◦ 130 E −1000 238 0.499 262 0.121
11 ANTT Round Hill Head 24◦ 100 S 151◦ 530 E −1000 245 0.819 258 0.284
12 ANTT Osborne Island 22◦ 170 S 150◦ 140 E −1000 306 1.910 312 0.700
13 ANTT Cooktown 15◦ 280 S 145◦ 150 E −1000 277 0.536 247 0.319
14 ANTT Possession Island 10◦ 440 S 142◦ 240 E −1000 47 0.302 333 0.378
2017a, b) or the Australian National Tide Tables (ANTT) Of the New Zealand stations, the range was significantly
(AHS, 2018). ATT and ANTT values are almost identical. over-estimated by Cook at Mercury Bay (station 5) and
For Lagoon Island (Vahitahi, Tuamotu Archipelago, French Queen Charlotte’s Sound (8). The over-estimation was about
Polynesia), the four main constants were taken from the 3 ft at Queen Charlotte’s Sound (i.e. 7.5 ft in Table 1 com-
global tide model of the Technical University of Denmark pared to 4.6 ft inferred from Table 2), which is surprising
(Cheng and Andersen, 2010) as no sets of constants from given that Cook spent 3 weeks there.
tide gauges were available. These Vahitahi values have been A previous assessment of Cook’s tides at the five Aus-
confirmed to be almost identical to those in two other state- tralian locations (stations 10–14) was made by Cdr Nisbet
of-the-art global tide models (Richard Ray, Goddard Space Glen of the UKHO and published in David (1988, p. xxxvii).
Flight Center, personal communication, 2017). The stations used for their modern tidal comparisons were
Two sets of tidal prediction software were used: one from not given. They must have been close to, or the same as,
LINZ based on that of Foreman (1977, updated 2004) and an- the stations we have used. However, without knowing ex-
other from the National Oceanography Centre (NOC) based actly which ones, and without their tidal constants, we cannot
on Bell et al. (1996), with the two sets providing almost iden- make a complete check on the previous findings.
tical information. Time series of 1 min values of the tide were Nevertheless, the conclusions from David (1988) and in
generated for each station spanning 1769–1770, from which the present study are similar (Table 3a). Cook estimated
the heights and times of high and low waters were extracted the spring range well at Botany Bay (station 10) and Bus-
for comparison to Cook’s findings. tard Bay (11). He rather over-estimated it at Endeavour
River (13). Considering that he spent about 7 weeks there
(or three spring–neap cycles), it is hard to see why he
3 Comparisons of tidal range and times of high over-estimated the range by so much (see Sect. 3.4 for
water further discussion). He also appears to have considerably
over-estimated the range at Possession Island (14) (but see
3.1 Tidal range reported in Cook (1772) Sect. 3.5). In the case of Thirsty Sound (12), David (1988)
suggests that Cook over-estimated the range (16 ft in Cook
A first comparison is of spring tidal range. Table 3a shows
17723 ) compared to 12.8 ft from (unspecified) modern mea-
the Cook values from Table 1, converted to centimetres, com-
surements. Banks also reckoned,
pared to twice the sum of the amplitudes of M2 and S2 from
Table 2. At most places, the difference is within the expected
uncertainty, but with an evident bias towards over-estimation 3 But in his journal (30 May 1770) Cook notes: “at Spring tides
of the range by Cook. the tide doth not rise less than 16 or 18 feet”
www.hist-geo-space-sci.net/9/85/2018/ Hist. Geo Space Sci., 9, 85–103, 201892 P. L. Woodworth and G. H. Rowe: The tidal measurements of James Cook
Table 3. (a) Range of the tide at new and full moon (from Cook) might conclude that the range there was negligible. On the
or at springs (from modern constants), and their difference. Modern other hand, modern information (Cheng and Andersen, 2010)
range reported for Australian stations in David (1988). Unit: cm. tells us that there would have been a semidiurnal range
(b) The time of high tide at new and full moon (from Cook), MHWI of about 80 cm on the day that Cook passed the island
(from modern constants) and their difference from Cook, HWFC (4 April 1769).
(from modern constants) and their difference from Cook. HWFC
This contradiction can be explained as follows. The island
reported for Australian stations in David (1988). Unit: hours. Mod-
ern MHWI and HWFC for Possession Island (station 14) are shown
was spotted from the Endeavour at about 10:30 a.m. when
in italics as they are not meaningful quantities at this location (see the ship was several miles away and during clear weather
Sect. 3.5). (Beaglehole, 1955). Cook sailed parallel to the coast, un-
der observation all the way by apparently hostile natives. He
(a) Cook Modern Difference UKHO did not land. By this time, Cook was hell-bent on arriving
rise and fall range (cm) (David, 1988) at Tahiti as soon as possible (Hough, 1994), and by about
(cm) (cm) (cm) 1:00 p.m. on the same day he was ready to sail on to the next
1 167.6 136.0 31.6 island. High tide on 4 April would have been shortly before
2 – 75.2 – 1:00 p.m. Therefore, he was at Lagoon Island for a few hours
3 27.9 28.0 −0.1 at most, just before and around high tide, during which there
4 167.6 144.4 23.2 would have been little vertical variation in the tide.
5 213.4 158.6 54.8
6 304.8 297.6 7.2
7 213.4 190.0 23.4 3.2 Times of high water reported in Cook (1772)
8 228.6 140.6 88.0
3.2.1 Before New Zealand
9 213.4 225.0 −11.6
10 137.2 124.0 13.2 131.1 Table 3b shows HWFC as given by Cook, compared to
11 243.8 220.6 23.2 249.9 MHWI computed from modern constants using Eq. (1) and
12 487.7 522.0 −34.3 390.1
also to HWFC computed as explained in Appendix A. Cook’s
13 274.3 171.0 103.3 170.7
14 335.3 136.0 199.3 140.2 HWFC compares acceptably with both MHWI and modern
HWFC at Success Bay, Tierra del Fuego (station 1), although
(b) Cook Modern Diff. Modern Diff. UKHO there is a better agreement with the latter.
high MHWI (h) HWFC (h) (David,
The largest difference in Table 3b, of over 2 h, is found at
water (h) (h) 1988)
(h) (h)
Vahitahi (Lagoon Island, station 2). However, Cook’s HWFC
estimate, based on a stay of a few hours at an island where
1 4.50 4.14 0.36 4.54 −0.04 he did not even land, is of little value. Timing of the tide is
2 0.50 2.88 −2.38 2.61 −2.11
acceptable at Tahiti (station 3), which is discussed in more
3 0.50 0.23 0.27 0.48 0.02
4 6.00 6.07 −0.07 6.28 −0.28 detail in Sect. 3.3.
5 7.50 6.89 0.61 7.10 0.40
6 9.00 7.01 1.99 7.25 1.75 3.2.2 New Zealand
7 8.00 7.26 0.74 7.47 0.53
8 9.50 8.55 0.95 9.23 0.27 Large differences between Cook’s HWFC and MHWI are
9 10.00 8.93 1.07 9.38 0.62 found at most New Zealand stations. All have positive dif-
10 8.00 8.65 −0.65 8.74 −0.74 8.67 ference values except for −4 min at Tolaga Bay (station 4),
11 8.00 8.93 −0.93 8.96 −0.96 8.68 with values of about 1 h or more at River Thames (6), Queen
12 11.00 10.92 0.08 10.89 0.11 9.97
Charlotte’s Sound (8) and Admiralty Bay (9). All differences,
13 9.25 9.58 −0.33 9.07 0.18 9.18
14 1.50 1.45 0.05 12.22 −10.72 1.03 except for Tolaga Bay, which is already acceptable, reduce
when modern HWFC is considered instead of MHWI.
An explanation for this improvement, which also applies
to Success Bay (station 1), can be understood from Ap-
The tide rose very much, how high was not mea-
pendix A. It is partly due to the large age of the tide at some
sured, but I think I may venture to guess not less at
locations, being 62 h at station 1 and 87, 63, 57, 44, 67 and
spring tides than 18 or twenty feet, perhaps much
49 h at stations 4–9 respectively, and also to the varying rel-
more
ative magnitude of S2 compared to M2. The improvement
(Beaglehole, 1963). In this case, David (1988) seems to have of using modern HWFC rather than MHWI is particularly
made an unsuitable choice of modern station. Our use of Os- marked at Queen Charlotte’s Sound.
borne Island gives a spring range of 17.1 ft that is reasonably This improvement provides further evidence that Cook’s
close to Cook’s estimate. high water times were indeed HWFC, rather than the MHWI
Cook (1772) does not give an estimate for rise and fall implied by the statements in Moore (1800) and David (1988).
at Lagoon Island (Vahitahi, station 2), from which a reader Nevertheless, in spite of the improvement, all the differences
Hist. Geo Space Sci., 9, 85–103, 2018 www.hist-geo-space-sci.net/9/85/2018/P. L. Woodworth and G. H. Rowe: The tidal measurements of James Cook 93
River Thames other tidal constituents cannot have been a major factor in
the systematically positive differences.
100
Figure 3 can be used as a case study of the method we
suggest Cook (and other captains) used to determine HWFC.
Tide level (cm)
For example, there was a high tide at 13.1 h on 21 November
0 (NZST), which would have been 12.8 h mean time at the lon-
gitude of River Thames. This occurred just over 7 days since
-100 a full moon on 14 November. Therefore, 7 × 50 min gives
about 5.8 h, which we have to subtract from 12.8 giving 7.0 h
for estimated HWFC. This corresponds nicely to the value
19 20 21 22 23
for HWFC computed “properly” in Table 3b.
19– 23 November 1769 (NZST)
Consequently, we do not understand why the HWFC re-
Figure 3. The predicted tide during 19–23 November 1769 at
ported by Cook is almost 2 h later than expected at River
Rocky Point at the head of the River Thames, New Zealand, us- Thames, while the differences (also mostly positive) for the
ing a full set of tidal constituents (red) or the M2 constituent only other New Zealand locations are more acceptable given that,
(blue). Mean time at this longitude (175◦ 310 E) is 18 min behind as mentioned above, HWFC is a parameter that is anyway
New Zealand standard time (NZST), which is 12 h east of Green- inherently accurate to only 25 min.
wich. A part (perhaps ∼ 10 min) of the remaining difference at
Mercury Bay, River Thames and Bay of Islands might be
explained by Cook’s measurements having been made in
between Cook’s HWFC and the modern values are still pos- November and early December when the equation of time
itive, with the exception of Tolaga Bay. (the difference between apparent and mean time) would have
We have investigated whether this positive difference introduced a small positive bias. In addition, spatial gradients
could be an artefact of other tidal constituents around New in the tide (e.g. at Cook Strait, Bowman et al., 1980), and
Zealand, including especially N2 as mentioned above, but the fact that our modern stations will not have been located
also the diurnal tides. As an example, Fig. 3 shows in red exactly at Cook’s positions, will have introduced some dif-
the predicted tide for 19–23 November 1769 at Rocky Point ferences. However, these are small factors compared to the
at the southern end of the Coromandel Peninsula at the head estimated uncertainties in Cook’s measurements, as shown
of what is now called the Firth of Thames. Cook was at the above.
River Thames from the morning of 20 November to the af-
ternoon of 23 November (civil dates). The red curve has been 3.2.3 Australia
computed using 26 tidal constituents including N2. The con-
tribution of the diurnal terms can be seen from the small There is agreement within the anticipated uncertainties be-
amount of diurnal inequality. By contrast, the blue curve tween Cook’s HWFC and either MHWI or HWFC from
shows the predicted tide using just M2. There are large dif- modern constituents at most of the Australian stations (10–
ferences between the red and blue curves in the magnitudes 14). The age of the tide is closer to zero for the Australian
of high waters. However, in spite of the importance of the stations, so the two modern parameters are similar. Bustard
other constituents, they are not large enough to make major Bay (11) is the only one in Table 3b with a difference of
changes in the predicted times of high tide. about 1 h. Our values of MHWI and HWFC are similar to
If one computes the average difference between the times those reported by David (1988) at all five Australian sites,
of high tide using the full set of constituents and those us- with the exception again of Thirsty Sound (12), where our
ing M2 only, for the days that Cook was known to have been value is in closer agreement with Cook’s HWFC. Endeavour
present, then one obtains values of ∼ 0.1 h for the six New River (13) and Possession Island (14) are discussed in more
Zealand stations. The average difference at River Thames is detail below (Sect. 3.4 and 3.5).
5 min, within a range of −6 to +18 min for individual high
tides. The largest average difference is at Bay of Islands (sta-
tion 7), being −23 min within a range of −43 to +12 min for
individual high tides. The average value has the opposite sign
for explaining part of the positive difference between Cook’s
HWFC and the modern values.
Of course, Cook cannot have measured high water times
continuously during his stay at each location, and probably
his estimates will have been based on impressions on single
days. However, without further details of when those obser-
vations were made, all we can say is that the existence of
www.hist-geo-space-sci.net/9/85/2018/ Hist. Geo Space Sci., 9, 85–103, 201894 P. L. Woodworth and G. H. Rowe: The tidal measurements of James Cook
3.3 Tahiti cording to the civil account, that is to begin and
end at midnight.
At the end of Cook and Green (1771), there is a table that lists
the heights and times of 16 high and 18 low waters at Matavai The other comes from inspection of the time difference
Bay on the north coast of Tahiti. This is the only publication between high waters when a tide in the morning or noon is
we know of in which actual tidal observations are recorded. followed by one in the afternoon, as occurs for 18/19 June
Therefore, there is some interest in taking a closer look at and 2/3 July. In each case, an assumption of ship time would
them. have two high tides separated by half an hour, which makes
Cook remarked that “The tides are perhaps as inconsider- no sense.
able in these Seas as in any part of the world”. They were cer- A further test is to make use of tidal predictions of high and
tainly small in comparison to, for example, the tides around low waters for Matavai Bay in 1769 using modern tidal con-
the UK. However, there are many other locations in the Pa- stants for Papeete. Constants for the four main constituents
cific with tides that are as small, or smaller, than those at were taken from the ATT, and extra ones for K2 and N2 were
Tahiti. The amplitudes of M2 and S2 at this location are both inferred assuming equilibrium relationships to S2 and M2 re-
7 cm, giving a spring range of 28 cm, which was just about spectively (Pugh and Woodworth, 2014). The extra ones al-
measurable. low for a slightly more complete description of the small tide
The 34 highs and lows in the table were obtained on 22 in- at this location. These constants refer to time zone +1000
dividual days within the period 4 June–5 July 1769, follow- (i.e. 150◦ W), which is fortuitously almost the same as mean
ing completion of the observations of the transit of Venus. time at the longitude of Papeete (149◦ 340 W) (a time differ-
They were not measured every day but appear to have been ence less than 2 min). A comparison can then be made to the
obtained primarily on days when the small tide at Tahiti was times reported in Cook and Green (1771), assuming that they
at its largest (a range of ∼ 10 in., or 25 cm). For each of the are either in ship or civil time. The additional complication
22 days, the times of lunar transit of the meridian are given, of Cook not incrementing his dates by one when he passed
calculated by the Astronomer Royal Nevil Maskelyne, as the 180◦ meridian is not relevant, as the meridian was not
shown by the initials N. M. following a paragraph below the crossed until after visiting Tahiti.
table. Figure 4a shows how the times of the tide measured by
It is not stated explicitly whether the dates and times of Cook correspond to predicted times, if one assumes that the
lunar transit and of the high and low waters are according former are in civil time. Low waters shown in blue are all
to local civil time, rather than using the naval or astronomi- in the morning, while high waters in red are mostly in the
cal days. Therefore, a first task was to check the lunar transit afternoon. The seven encircled points are when the predicted
times with the use of The Nautical Almanac (1769). For 20 of high or low waters are within 7.5 cm of mean sea level or,
the days, the given times and our own calculations, expressed in other words, when that particular tide was so small that
in local apparent time at Matavai Bay, agree to a couple of any estimate of its timing obtained by visual measurements
minutes, confirming that N. M.’s values are also in civil time. is likely to have been highly imprecise. Maskelyne noted that
Two values on 19 and 20 June disagree by 23 and 8 min re-
The times of high and low water seem to be subject
spectively, which we assume to have been errors by N. M.
to great irregularity on particular days; no doubt
These errors have no impact on our conclusions below.
owing to the small rise of the water . . . which ren-
It is a bit harder to decide whether the high and low wa-
ders it more liable to be disturbed by the action of
ters given in the table were also reported in civil time, rather
the winds and other causes: part of the irregularity
than using the naval day (we disregard the possibility that
may be attributed to the difficulty of observing the
the astronomical day was used for these). All the low wa-
time of flood or ebb, with any degree of certainty.
ters were measured in the morning (AM) and, as explained
above, dates for morning times are the same in the naval and If the morning and afternoon tides are considered together,
civil day, so the low water measurements cannot help us de- then one could say that Fig. 4a shows a good correspondence
cide between them. On the other hand, all except two of the between Cook’s data and modern information. Most of the
high waters were made in the afternoon (PM), and so there is low waters lie below the diagonal. However, as mentioned
an uncertainty of 1 day for them, or say ∼ 50 min in the time above, all of them were made in the morning, for which there
of the tide. was no difference between the civil and naval days at Tahiti.
Two simple things lead us to conclude that the high and Most of the high waters lie on or above the diagonal. The
low waters are also expressed in civil time. One is that the high water on 12 June, reportedly measured at 5:00 p.m. by
daily entry in Cook’s journal for 13 April 1769 states, Cook, is an obvious outlier, and in fact all three high waters
measured late in the afternoon were obtained on days with
as the Most material transactions at this Island little tide. Therefore, it would have been even more difficult
must happen in the Day time . . . I shall during our to estimate the times of the turning points by eye on those
stay at this Island but no longer reckon the day ac- days, especially in the presence of large waves.
Hist. Geo Space Sci., 9, 85–103, 2018 www.hist-geo-space-sci.net/9/85/2018/P. L. Woodworth and G. H. Rowe: The tidal measurements of James Cook 95
the mean difference between Cook and predicted times in-
(a) Tahiti times of low (blue) and high (red) waters creases, resulting in poorer correspondence with modern in-
formation. Therefore, one concludes that, although the com-
20 parison is not as sensitive as one would like, it does once
again support the measurements in the table of Cook and
Green (1771) having civil dates and times.
Maskelyne made his own analysis of the data in the ta-
Predicted (h, GMT-10)
15 ble. He appears to have assumed (as we have concluded) that
civil times were used throughout and to have subtracted the
lunar transit times from the times of high and low waters (i.e.
as described by Moore, 1800). He concluded that high water
10
came before lunar passage by about 45 min on average. We
believe this to be essentially correct arithmetically (we calcu-
lated an average of 35 min). However, Maskelyne would not
5 have appreciated that, given that the amplitudes of M2 and S2
are the same at Tahiti, priming and lagging of approximately
5 10 15 20 ±3 h would have introduced a considerable uncertainty into
Measured by Cook (h)
any average time of high water relative to transit (see Ap-
pendix A). His estimate is confirmed by Fig. 4a, which has
many of the red dots above the diagonal, with an average dif-
ference between Cook and predicted times of about half an
(b) Tahiti times of low (blue) and high (red) waters
hour. In other words, Cook’s times of high water were too
early. Similarly, the blue dots show most of Cook’s reported
20 times of low water as being too late.
So how did Cook arrive at a value for HWFC of half an
hour after transit at new and full moons, as shown in Table 1?
Predicted (h, GMT-10)
It seems that he had not arrived at this conclusion when at
15
Tahiti, as (unusually) there is no mention of the range and
time of the tide in his daily entries. One can speculate that
he came to this conclusion back home. He knew full moon
10 had been on 18 June and new moon on 3 July, and a selection
from the small number of high water measurements around
those dates could indeed support an estimate of half an hour
after transit, within some scatter.
5 In summary, Maskelyne’s conclusions from the available
data were arithmetically sound. However, his findings on av-
5 10 15 20 erage timings would have been highly imprecise due to the
Measured by Cook (h)
priming and lagging. Somehow, Cook decided independently
Figure 4. (a) Times of day of high (red) and low (blue) waters upon a value for HWFC that was different to Maskelyne’s
measured at Matavai Bay, Tahiti, by Cook and as predicted using and was in fact closer to our modern knowledge of the tide
modern tidal constants for Papeete, assuming the dates in Cook and at Tahiti. Presumably Maskelyne did not object to (or did not
Green (1771) had been reported using the civil day. Points with a spot) Cook’s Tahiti estimate when the table was sent to him
circle indicate small predicted tides within 7.5 cm of mean sea level. for publication in Cook (1772).
(b) As (a) but assuming the dates were reported using the naval day
(ship time). Note that the change between civil and naval day results
in a different association of Cook times and predicted values, and 3.4 Endeavour Reef and River
as a result the set of encircled points in (a) and (b) is not exactly the As the Endeavour sailed north along the coast of New
same.
South Wales and Queensland, it moved into waters where
the diurnal components of the tide are more important than
the semidiurnal components. The amplitude of the K1 con-
It is interesting that a similar figure, assuming ship time stituent is 30, 28 and 19 % of M2 at the southern stations
used for the measurements, has most of the red dots move 10–12 respectively, but is 58 % at Cooktown (13) and 168 %
closer to the diagonal by about half an hour, resulting in a at Possession Island (14). The diurnal tide was to play an
better fit with regard to high waters alone (Fig. 4b). However, important part in one of the most important events in the En-
in that case, when highs and lows are considered together, deavour’s voyage, when the ship struck the Endeavour Reef
www.hist-geo-space-sci.net/9/85/2018/ Hist. Geo Space Sci., 9, 85–103, 201896 P. L. Woodworth and G. H. Rowe: The tidal measurements of James Cook
In the event, the seamen’s opinion was correct for this loca-
tion and this time of year (although not correct generally),
and the ship refloated a “full hour before high water”.
The state of the tide during 11–12 June can be demon-
strated using modern tidal constants. Figure 5a shows that a
contributing factor in the ship not floating on the 11:00 a.m.
tide was what became known as “diurnal inequality”, in
which a larger/smaller semidiurnal high water tends to be fol-
lowed by a smaller/larger high water. Figure 5a indicates that
the morning tide was 63 cm (2.1 ft) less than the preceding
evening one, confirming Cook’s estimate of 2 ft. There are
also differences between high tides separated by a day, and
Fig. 5a shows that high water at midnight on 12–13 June was
in fact 15 cm (6 in.) less than the day before, when the En-
deavour had struck. Of course, the ship was by now much
lighter.
Cook pursued his interest in diurnal inequality during the
stay at Endeavour River during 18 June–5 August, span-
ning more than three spring–neap cycles. He remarked that
HWFC was about 9 h, 15 min, and that the “height” (range)
of the evening tide at springs was about 9 ft (274 cm) but
the morning tide was “scarce 7 ft” (213 cm). At neap tides
there was no perceptible difference between the morning and
evening tides. Figure 5b shows that these observations were
qualitatively correct (for spring tides at least).
Badger (1970) uses Cook’s interest in diurnal inequality at
Figure 5. (a) The tide at Endeavour Reef on 11–12 June 1770 us-
Endeavour River as an example of “Cook the scientist”. The
ing tidal constants from Cooktown. Mean time at this longitude (ap-
proximately 145.5◦ E) is 18 min behind Australian eastern standard reasons for diurnal inequality were not fully appreciated at
time (AEST), which is 10 h east of Greenwich. The blue stars indi- the time, although 18th century tide table makers knew that
cate when the Endeavour struck the reef and was refloated. (b) The the seamen’s belief was incorrect and that the difference be-
tide at Endeavour River (Cooktown) during 18 June–5 August 1770. tween morning and evening tides had a seasonal dependence
(Woodworth, 2002). Researchers began to appreciate the role
of lunar declination in producing diurnal tides and the rea-
a few minutes before 11:00 p.m. on 11 June 1770 (civil or sons for their seasonal variation via solar declination (Thom-
naval date) at about high tide. son, 1819), and diurnal inequality was to become one of
Cook lightened the ship by throwing water, cannon and the main tidal research topics of the 19th century (Whewell,
other equipment overboard and waited for the next expected 1848; Cartwright, 1999).
high tide at around 11:00 a.m. the following morning. The
Endeavour failed to float, so he continued to lighten the ship 3.5 Possession Island
and waited for the next high tide in the evening of 12 June. Fi-
nally, the Endeavour refloated at 10:20 p.m., just before the Possession Island (station 14) is located in Torres Strait, off
next high water, and sailed north along the coast for about the north coast of Queensland. This is the location where
50 km until finding Endeavour River (station 13, modern Cook took formal possession of the whole east coast of Aus-
Cooktown), where temporary repairs could be made (Bea- tralia in the name of King George the Third just before sunset
glehole, 1955; Wikipedia, 2017). on 22 August 1770. The tides in this area vary considerably
Cook reported on these events, and on subsequent obser- spatially. However, only one set of constants is available from
vations of the tide at Endeavour River, in a letter to Sir John near the landing site from which we can make a modern com-
Pringle, published in edited form in Cook (1776) (see also parison to Cook’s tidal information. This set originated from
Beaglehole, 1955). He remarked that the 11:00 a.m. tide had the UKHO in 1925 and is still included in the catalogues of
failed to rise as much as expected by about 2 ft and that they constants in the ATT and ANTT. A version of this set was
now had no hope but to rely on the evening tide, which was provided to us by the National Tidal Unit of the Australian
Bureau of Meteorology and consists of constants for seven
only founded on the generally received opinion constituents (M2, S2, N2, K2, K1, O1 and P1). The largest
among seamen, that the night tide rises higher than amplitude is that of K1 (51 cm), compared to 30 cm for M2,
the day tide. and that of S2 (38 cm) is also larger than M2. It was almost
Hist. Geo Space Sci., 9, 85–103, 2018 www.hist-geo-space-sci.net/9/85/2018/P. L. Woodworth and G. H. Rowe: The tidal measurements of James Cook 97
Possession Island 3.6 Other tidal mentions in Cook’s daily entries
150
The daily entries in Cook’s journal contain several other
100 mentions of the magnitude of the tide at Madeira (M) and
three locations in Queensland (Keppel Bay, K; between Cape
Tide level (cm)
50
Palmerston and Cape Hillsborough, C; and Repulse Bay, R),
0 which are shown in Fig. 1. Each mention is given in Ap-
-50 pendix B, together with comments based on modern knowl-
edge of the tide. Cook’s measurements can be seen to be in
-100
reasonable agreement with modern information.
16 17 18 19 20 21 22 23 24 25 26 27 28
16– 28 August 1770 (AEST) 4 Cook’s observations of ocean currents and tidal
streams
Figure 6. The tide at Possession Island at the end of August 1770.
Mean time at the longitude of Possession Island (142◦ 420 E) is half
The daily entries in Cook’s journal contain several mentions
an hour behind AEST.
of major currents, which form part of the global ocean cir-
culation, and many references to tidal currents, although few
certainly the same set of constants used by the UKHO, re- of them could be said to have quantitative scientific value.
ported in David (1988), as can be seen by comparison of the For example, on 25 January 1769, when the Endeavour was
modern range and UKHO columns of Table 3a. south of Cape Horn passing east to west through the Drake
It will be recalled that the “modern range” in Table 3a Passage:
is calculated from M2 and S2 amplitudes only. However, Between Strait Le Maire and Cape Horn we
the tide at the end of August, computed using all seven found a Current Seting generally pretty Strong to
constituents, will have looked more like Fig. 6, which the N. E. when we was in with the Shore but when
demonstrates the relative importance of the diurnal terms. 15 or 20 Leagues off we was not sencable of any.
David (1988) reported that the tide rose 5.5 ft (168 cm) on the
day Cook landed (22 August); that is not too different from This was probably an observation of a northern branch of
our own calculation of 159 cm in Fig. 6. New moon had oc- the Antarctic Circumpolar Current (Meredith et al., 2011).
curred the day before, so one might have expected Cook to A few days earlier, on 13–14 January 1769, Cook had com-
report a rise and fall of about 5.2 ft (160 cm). However, Cook mented on difficulties with tidal currents in passing through
instead reported a value of 11 ft (335 cm). David (1988) sug- the Le Maire Strait between Staten Island and Tierra del
gests that Fuego.
There are many more examples from when the Endeavour
being an astute observer, he could well have no- was at New Zealand and Australia. On 5 December 1769,
ticed that the tide actually rose considerably less when at the Bay of Islands on the NE coast of North Island,
than tide marks on the rocks and adjusted his ob- New Zealand, Cook remarked,
servations accordingly to a value closer to the ex- I have lately had reasons to think that there is a
treme rise of tide given by the tide marks. Current which comes from the westward and sets
The daily entries do not confirm that this is indeed what along shore to the SE ∧or SSE as the Land lays.,
happened. However, this suggestion is consistent with the to- and when slightly further north, on 18 December 1769, Cook
tal tide predicted for only a couple of days before (Fig. 6), remarked,
when the range had a value of 303 cm (or almost 10 ft), and
and the Ship ∧fell fast to leeward occasioned as we
which could well have been the reason for any such tide
thought by a Current seting to the Eastward.
marks.
The character of the predicted tide around 19 August These remarks were consistent with observations of the
demonstrates again the importance of the diurnal constituents East Auckland Current, which originates from tropical wa-
in this area, with diurnals becoming even more dominant as ters driven by the wind down the east coast of Australia and
one travels SW into the Gulf of Carpentaria (Pugh and Wood- then flows in an eastward direction across the Tasman Sea
worth, 2014, chap. 1). Possession Island serves as a further (see Fig. 2 of Lumpkin and Johnson, 2013). The current flows
example of the limitations of describing the tide simply in south-east along the north-east coast of New Zealand with
terms of spring range and HWFC in parts of the world where speeds up to 50 cm per sec (∼ 1 kn) (Te Ara, 2017).
the tidal regime is not predominantly semidiurnal. As Table 2 shows, the tides around New Zealand are mod-
est compared to those around the UK, for example. Tidal cur-
rents are generally about 2 km h−1 (1 kn) with the major ex-
ception of Cook Strait, where tidal currents can be stronger
www.hist-geo-space-sci.net/9/85/2018/ Hist. Geo Space Sci., 9, 85–103, 2018You can also read