THEFT OF AND FROM AUTOS IN PARKING FACILITIES IN CHULA VISTA, CALIFORNIA
←
→
Page content transcription
If your browser does not render page correctly, please read the page content below
THEFT OF AND FROM AUTOS
IN PARKING FACILITIES IN
CHULA VISTA, CALIFORNIA
A Final Report to the U.S. Department of Justice,
Office of Community Oriented Policing Services
on the Field Applications of the Problem-
Oriented Guides for Police Project
RANA SAMPSON, AUGUST 2004

This project was supported by cooperative agreement #2001CKWXK051 by the Office of
Community Oriented Policing Services, U.S. Department of Justice. The opinions contained
herein are those of the author(s) and do not necessarily represent the official position of the U.S.
Department of Justice. References to specific companies, products, or services should not be
considered an endorsement of the product by the author or the U.S. Department of
Justice. Rather, the references are illustrations to supplement discussion of the issues.

Summary                                               theft parking lots; an analysis of time parked
                                                      before the theft was noticed; revictimization;
In Chula Vista, CA, a city 10 minutes from            trend data for auto theft; monetary value of
the Mexican border, auto theft and theft              property loss; vehicle theft rates by San
from auto account for 44 percent of the               Diego county cities; offender interviews; lot
city’s total crime index1. Using Ron                  manager interviews and environmental
Clarke’s problem-oriented policing guide              assessments of the lots; and an analysis of
summarizing the research and effective                border point interventions versus parking lot
countermeasures to auto theft and theft from          interventions. The results of the analysis
auto in parking facilities as a framework2,           revealed offenders making highly rational
the Chula Vista Police Department                     choices in target selection and masking their
conducted a detailed review of its vehicle            crimes with the legitimate routine activity in
crime problem, finding that ten parking lots          these lots. The project results also suggest
in Chula Vista, and the adjacent parking lots         for Chula Vista (and potentially other U.S.
to them, accounted for 22 percent of all              border cities to Mexico) that border point
vehicle crime in the city. The review                 interventions are less effective than parking
included analysis of vehicle theft and                lot interventions in reducing auto theft. This
vehicle break-ins by vehicle type, model,             project also confirms the value of this
and year; recovery rates of stolen vehicles in        particular POP guide and its step-by-step
the target parking lots, for all of Chula Vista,      application to reducing theft of and from
and other cities in San Diego county; rates           autos in parking facilities. 3
of theft in Chula Vista’s high volume auto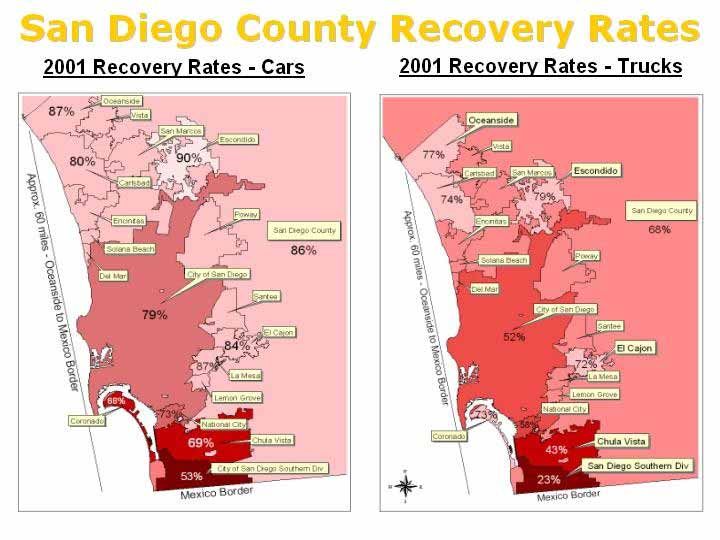
commercial streets bisected by two main
Introduction                                     North-South freeways. These freeways,
                                                 Interstate 5 and 805, traverse Chula Vista
The purpose of this Field Applications POP       converging at the Mexican border. (See
Project, funded by the U.S. Department of        Appendix 1, Figure 1)
Justice, Office of Community Oriented
Policing Services, was fourfold: 1) assist the   Initial site selection
Chula Vista Police Department in finding
more effective responses to auto theft and       The COPS Office selected the Chula Vista
theft from auto in parking lots; 2) reduce       Police Department (CVPD) for participation
vehicle crime in those lots; 3) assess the       in the project. In November 2001, the CVPD
utility of the problem-oriented policing         decided upon the problem of auto theft/theft
guide entitled Thefts of and from Autos in       from auto in parking facilities for
Parking Facilities (the Guide); and lastly, 4)   examination (among the 19 guidebook
improve the police department’s capacity to      problems available at that time) for several
routinely problem solve.4 This paper reports     reasons. The CVPD surveyed its employees
findings from Chula Vista’s examination of
                                                 (both civilian and sworn) seeking input on
auto thefts and theft from autos in parking      the most important crime or safety problems
lots.                                            in Chula Vista. The five problems receiving
                                                 the most nominations included burglary of
Chula Vista, a 50-square mile suburban           single-family homes, thefts of and from cars
community bordering the Pacific Ocean, is        in parking facilities, drug dealing in
approximately seven miles north of the           privately owned apartment complexes, false
Mexican border. With a 2000 census               burglar alarms, and speeding in residential
population of approximately 173,000              areas. Mid-managers and command staff
residents, Chula Vista is a fast-growing,        convened to discuss the importance of each
diverse community. To the south, one slip of     of these problems, reviewing available
the city of San Diego borders the south          information on trends and harms, and the
boundary of Chula Vista, resting between         utility of a POP guide to Chula Vista’s
Chula Vista and the border to Mexico. The        specific problems. Ultimately, this group
San Diego Police Department’s Southern           selected thefts of and from cars in parking
Division polices this part of San Diego. The     facilities for the following reasons:
city directly north of Chula Vista is National
City, a small, generally high crime city with       x   The auto theft problem in Chula
a 2000 census population of under 60,000.               Vista appeared disproportionately
The vast majority of the city of San Diego              high for a city of its population. As
sits on the northern border of National City            for theft from vehicles, the group
with a 2000 census population of 1,200,000              believed that this too was
making it the seventh largest city in the               disproportionately high, particularly
United States. Chula Vista, National City,              since this crime is generally
San Diego, along with a number of other                 underreported.
cities and unincorporated areas, comprise
San Diego County, whose population in               x   Auto theft rates rose 15 percent in
2000 slightly exceeded 2,800,000. The                   2000 through much of 2001, (while
county’s northern border is Camp Pendleton,             residential burglary rates declined
a Marine Corps base. North of this base is              eight percent since 1999).
Orange County.
                                                    x   Because residential burglary rates
Chula Vista is a city of residential and                have declined significantly since the
                                                                                                2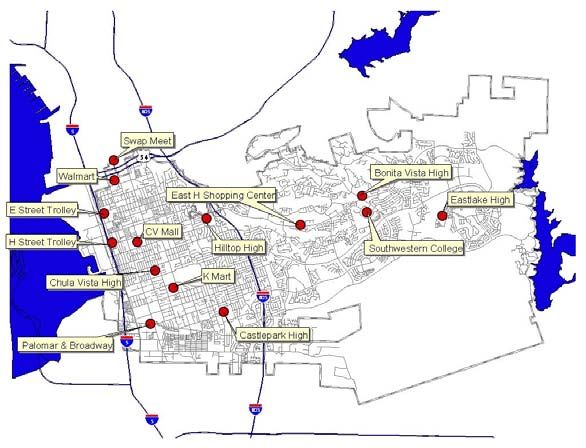
mid-1990s, only an estimated 240
    single-familyburglaries (the focus of      Once the problem type was selected, we
    the residential burglary problem-          presented specific information from the
    solving guide) were expected to            Guide to higher-ranking members of the
    occur in 2001; in comparison, an           Department. Next, we began to gather and
    estimated 1280 incidents of theft          analyze information related to vehicle crime
    of/from auto in public lots were           from the CVPD’s files.
    expected to occur in 2001.
                                                  x   We reviewed 2000 and 2001 data for
x   Data gathered for the meeting                     locations that had the highest volume
    showed that during a 3-month period               of auto theft and the locations that
    in the spring of 2001, approximately              had the highest volume of vehicle
    nine percent of all auto thefts in the            burglaries.5 We decided to use 2001
    City of Chula Vista occurred in just              data for all further analysis, even
    four public lots (Wal-Mart; Target;               though there were some slight
    Home Depot; and the Swap Meet lot)                differences between years 2000 and
    suggesting a good fit between this                2001, since the frequency of the
    POP guide and the problem.                        thefts were great enough in a one-
                                                      year time frame to discern
x   The group believed that vehicle                   meaningful, more recent patterns.
    crime in lots could be reduced since
    lots had borders and they belonged to         x   For 2001, there were 1,714 auto
    a person who or an entity that could              thefts, and 1,656 vehicle burglaries
    exercise greater control over them.               in Chula Vista representing 44
                                                      percent of all Part I crimes in Chula
x   Previous efforts to address public lot            Vista. These vehicle crimes occurred
    auto theft at one lot had been very               in public lots and streets and private
    successful. Auto thefts at Chula                  lots and areas
    Vista Mall were reduced nearly 40
    percent between 1998 and 2001 as a         Finding Meaningful Parameters
    result of problem-solving efforts at
    that location.                             We began a search to identify the locations
                                               in Chula Vista where vehicle crimes
x   Chula Vista’s Uniform Crime Report         clustered. We found that six of the nine
    (UCR) Index crimes are dominated           highest volume auto theft locations in the
    by motor vehicle thefts and larcenies      City coincided with the highest volume auto
    (many of the larcenies are actually        burglary locations. We used aerial (ortho)
    thefts from vehicles). In fact, there is   photos of these top nine locations to allow
    a perception in the County that Chula      us to visually distinguish parking lots from
    Vista is high crime because of its         other types of locations. Using ArcView, the
    relatively high number of crimes. If       crime analyst layered parcel addresses onto
    vehicle crime could be reduced (an         the aerial photos. All of the top nine high
    estimated 17 percent of the total          volume locations were parking lots,
    UCR Index crimes were thefts               however, two were apartment complex
    of/from autos in public lots) then         private parking lots, not public lots (the
    perhaps the perception that Chula          focus of the guidebook is on public lots).
    Vista is high crime could be turned        We skipped these two apartment complex
    around.                                    lots and chose the next two high volume
                                               locations.
                                                                                           3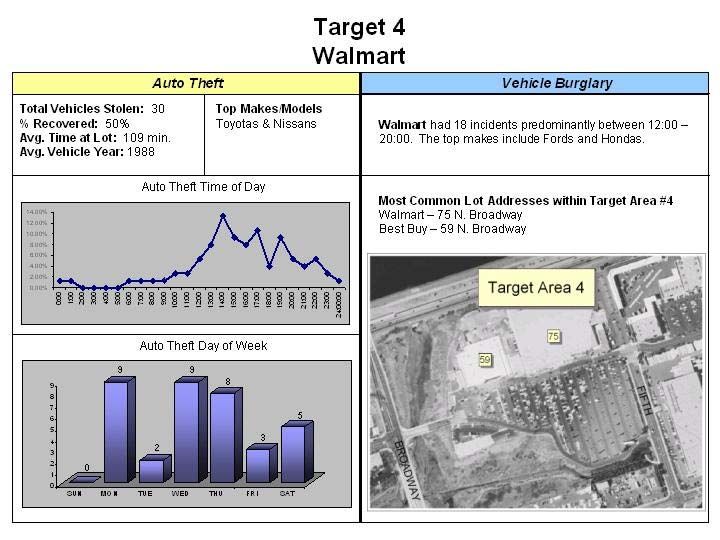
percent of the city’s auto thefts and 20
We then chose a tenth location, which             percent of the city’s auto burglaries. While
requires an additional explanation. We            some of the target areas had only one owner
realized that Chula Vista’s five high schools     and one lot address (Southwestern College),
had a fair amount of vehicle crime.               others had many owners, as well as adjacent
Although no individual high school made it        lots with different addresses and lot owners
onto our top ten list, when grouped, their        (Broadway and Palomar).
volume of vehicle crimes elevated them to
number nine on our list. Because the issues       We discovered that our target lots also had
at these high schools are similar, and they all   high levels of calls for service to police, as
have the same lot owner, the Sweetwater           well as police initiated calls. Six out of the
Union High School District, we believe that       ten target areas were also among Chula
grouping these as one target site provides        Vista’s top ten police call for service
the benefit that CVPD would be able to            locations, indicating that these lots were not
present a more robust data set to the School      just vulnerable to vehicle crime but were
District when offering strategies to reduce       generally crime and disorder magnets. Calls
their vehicle crime problem. With the high        for service ranged from minor disputes and
schools as one target, we now had ten             disturbances to violent crimes. We believe
targets.                                          applying effective responses to vehicle
                                                  crimes in our lots will also reduce many of
While using ArcView, we were able to see          these other police calls, as enhanced
the types of properties adjacent to our target    guardianship of these lots by lot owners and
lots. Unfortunately, we found that many of        managers will produce a diffusion of
our target lots were adjacent to other parking    benefits7 over a wider array of public safety
lots. We decided to add in these adjacent         problems there. (See Appendix 1, Table 1)
lots to lessen displacement opportunities.
We viewed adjacent lots as probable               Geographic distribution of targets
displacement sites. By paying close attention
to these lots upfront and ultimately              Initially, we could have chosen all our target
recommending countermeasures for vehicle          lots from a more specific part of Chula
crime in these adjacent lots we believed we       Vista, such as the downtown area on the
would minimize any displacement.6                 west side, as vehicle crimes are likely to
                                                  concentrate in lots there.8 However, Chula
We designated each of the groupings – our         Vista’s fast-growing suburban areas on the
ten volume lots with their adjacent lots as       east side of town contained some of our auto
one of ten target areas. We determined that       theft hot spots, so we decided to use the
if we grouped in these adjacent lots, we          entire city in analyzing the volume of
captured 22 percent of all vehicle crime in       vehicle crime.
Chula Vista. Some of the adjacent lots were
small, however, they added over 40                We found that seven of the 10 target areas,
additional lots to our analysis. The analyst      and three of the five high schools in Target
drew polygons around each of the target           Area 9 were on the west side of Chula Vista.
areas exporting the vehicle crime data from       The west side of Chula Vista has an older
these into a database file to begin further       downtown area with many businesses,
analysis of the vehicle crimes contained in       although it is still predominantly residential.
those target areas.                               Calls for service and crime rates are higher
                                                  in this area of the city than in the Eastern
These ten targets accounted for 387 auto          section. The largest shopping mall in Chula
thefts and 293 vehicle burglaries – 25            Vista, Target 3, is among the target areas on
                                                                                                4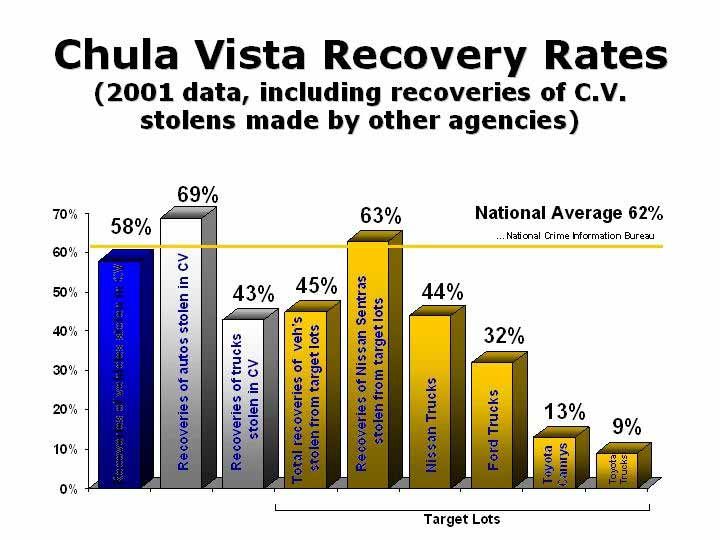
the west side.                                       x   Auto theft prosecution and auto theft
                                                         insurance fraud in Chula Vista
The dividing line between Chula Vista’s east         x   National comparisons for vehicle
and west side is Interstate 805. The east side           crime (other cities, including border
of the city contains three target areas,                 cities)
Southwestern Community College (Target
8), the East H Street Shopping Center             Based on the earlier survey we administered
(Target 1), and two of the five high schools      within the CVPD, we found that more than
contained in Target 9. The east side of Chula     50 employees expressed interest in assisting
Vista is predominantly residential, dotted        on this project.9 We shared with these
with recent or new housing developments           employees the information gathering tasks
and shopping areas. It is a middle- to upper      we expected from each of the
income community, with substantially              subcommittees and asked interested
higher income levels than the west side.          employees to select a subcommittee. A
                                                  lieutenant, sergeant, agent or civilian
We determined that the highest risk lots          manager in the CVPD chaired the
(risk rates of lots will be discussed in detail   subcommittees. As a first step, the
later in this paper) were generally located       subcommittee members were asked to read
within one-tenth of a mile of a freeway.          the POP guide, and in some cases specific
Medium risk lots averaged three-quarters of       research articles pertaining to their
a mile to a freeway. The lowest risk lots of      subcommittee topic. In addition, we asked
the ten targets averaged 2.5 miles to the         that subcommittee members provide us with
freeway. (See Appendix 1, Figure 2)               feedback on the POP guide and its
                                                  application to Chula Vista’s vehicle crime
Analysis Subcommittees                            problem (project goal number 3). We also
                                                  asked that subcommittee members
Once we developed some preliminary                determine, based on their reading and their
parameters for the project, we outlined an        policing experiences, if it would be valuable
analysis plan, in part fashioned from the         to collect any additional information beyond
analysis questions in the problem-oriented        the tasks we initially outlined and those
policing guide, and in part designed to           outlined in the Guide.
capture some of the unique qualities of
border communities. We divided the                We found there was value in engaging so
analysis work into to seven groupings. From       many Department employees in the project.
these groupings, we formed seven                  Since vehicle crime represented 44 percent
subcommittees and tasked each with                of all Part I crimes in Chula Vista, we
information gathering. The subcommittees          believed participating employees would
were as follows:                                  develop a greater understanding of Chula
                                                  Vista’s vehicle crime problem and become
    x   Theft of vehicle problem in Chula         exposed to research-based approaches to
        Vista’s target lots                       reduce it (project goal number 1). We also
    x   Theft from vehicle problem in Chula       believed involvement in a high level
        Vista’s target lots                       problem-solving project was a good method
    x   Offenders                                 of introducing problem-solving to
    x   Risk rates in Chula Vista’s targets       employees less familiar with it while it
        lots                                      could also enhance the problem-solving
    x   Environmental design and                  skills of those employees already familiar
        management practices in Chula             with it (project goal number). In addition,
        Vista’s target area lots                  these employees allowed us to:
                                                                                              5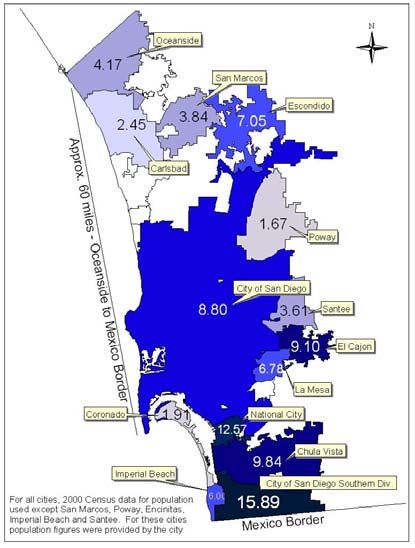
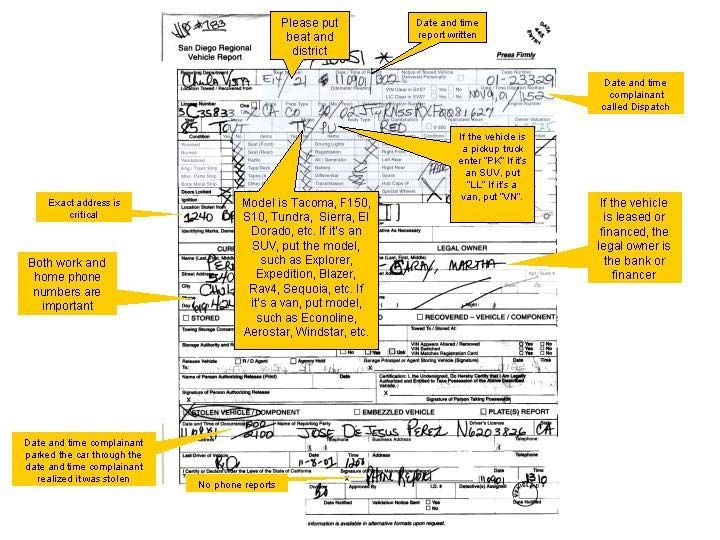
report boxes, particularly the time of theft
   x   Share time-consuming information         discovery, and make and model information,
       gathering tasks among a wider group      particularly for trucks. This is not surprising,
       of people, minimizing the burden on      as the form is somewhat confusing in this
       a single individual, for instance        regard. Many times, these report writers
       carrying out surveys (environmental,     placed information about the timeframe for
       management practices, and offender       the auto theft in their report narratives,
       interviews)                              however, data entry operators only enter
   x   Provide us with a diversity of input     information from the cover sheet boxes not
       on tasks and response strategies         from the narrative description of the crime
   x   Limit the average amount of time         captured on the form’s second page.
       spent by each subcommittee member
       to approximately one hour per            In addition, many of these officers used a
       week.10                                  street’s one-hundred block address for an
   x   Hold ourselves publicly accountable      auto theft occurring in a lot, not realizing the
       with their interest in the project       importance of specifying the exact address
   x   Facilitate employee problem-solving      for the lot. Each lot has a distinct address,
       on other crime problems (project         however, officers were generally unaware of
       goal number 4)                           them. The reporting form also requires that
                                                officers determine and check off whether the
Data Gaps                                       vehicle was stolen from a) the street b) a
                                                garage c) a parking lot d) a driveway or e)
It is worth noting that during the vehicle      other. For the most part, officers left these
theft analysis, we encountered a series of      boxes blank, unaware of their importance in
data gaps, each needing resolution. Police      auto theft analysis. Even in those cases
departments in San Diego County (nine           where one of the boxes was checked, the
municipal, one county, and several college      countywide data entry system does not have
and secondary school police agencies) share     a data-field to collect this information (even
a countywide computer database system.          though these boxes exist on the countywide
These police agencies share the same crime      form) so we could not compare the extent of
reporting form so that agencies can compare     Chula Vista’s lot theft to other cities without
information across cities and the county.       looking through individual reports submitted
Each police department can access their         to the county system from these other cities.
data, as well as countywide data. A police
department can look at another city’s data              Remedy: We pulled by hand every
but not export it for analysis. The gaps fell           Chula Vista report for 2001 that was
into two different categories:                          missing data or solely contained one
                                                        hundred block data (as opposed to
   1. Report writing/data entry gaps                    exact address). Often the narrative
   2. Countywide data system gaps                       contained the needed information, if
                                                        not, we found some other way to
Report writing/data entry gaps                          determine this information. We
                                                        filtered out all reports that were
In Chula Vista, reports of auto theft can be            street thefts allowing us to focus on
taken in person by an officer or a                      the lots.
community service officer, or over the
phone to a community service officer or         Among the theft from auto reports, we found
cadet. 11 Many times, these report-takers       that officers often incorrectly reported theft
neglected to fill out a number of the crime     of vehicle parts, such as theft of an in-dash
                                                                                               6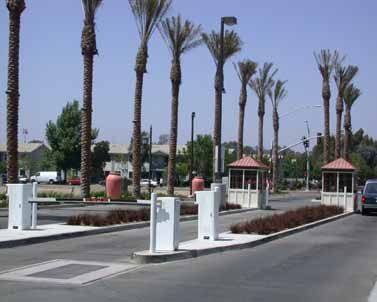
car stereo, license plate, vehicle wheels or            makes and models into the code
after-market body kits. Report-takers                   XXXX or XXX. For instance, the
frequently reported these incorrectly as theft          makes Saturn, Kia and GMC appear
from vehicles.                                          as XXXX and the models Camry,
                                                        Cherokee, Sephia, MR2, 240SX,
    Cure: Once again we hand pulled reports             RX7, Prism, Ram, and X-Terra all
    to determine accuracy. As it turned out,            appear as XXX.
    accurate labeling helped us uncover a           x   In addition, vehicle recovery data is
    theft of parts problem in a movie theatre           not as accurate in the countywide
    lot. The amount of time moviegoers                  system because of discrepancies in
    spend in the theatre guaranteed that                agency reporting, requiring
    offenders had sufficient time (once the             individual agencies concerned with
    moviegoer parked) to dismantle parts of             recovery information to keep a
    the car unnoticed. To correct this and              separate database.
    other reporting problems, we provided
    training to every Chula Vista police                Cure: As a result, for much of our
    officer and CSO on accurately reporting             data we used the separate database
    vehicle crimes.12                                   kept by CVPD. For those county
                                                        reports with missing information we
Countywide data system gaps                             hand pulled reports. For instance, we
                                                        pulled every report for 2001 that the
While there are many advantages to a                    countywide system showed as
countywide report and data access system,               XXXX or XXX in the make or
we found that the system did not have                   model field and hand corrected the
sufficient data access points to adequately             missing data. We contacted the
analyze auto theft and theft from auto                  countywide system administrator to
problems in parking lots. For example, in               alert her to the problem. The CVPD
examining auto theft data:                              expects to have further discussions
                                                        with the countywide system
   x   There was no way to determine from               administrator to see if these other
       the countywide system the entry                  corrections can be made.
       point to the vehicle (door lock,
       broken window, etc.) once the             We experienced additional problems with
       vehicle was recovered.                    the countywide data system when analyzing
   x   In the countywide system, one             Chula Vista’s theft from auto problem.
       cannot extract arrestee names and
       other arrest data associated with            x   The countywide system is not set up
       particular locations limiting “place”            to allow data extraction on the types
       analysis.                                        of property stolen from vehicles
   x   Trucks, SUVs, vans, and                          limiting any pattern analysis of this
       motorhomes are lumped into one                   information.
       category in the countywide data              x   There is no data entry field (although
       system, all under the label “TK”                 there is a box on the actual form
       making vehicle analysis difficult.               which officers fill out) for vehicle
   x   Several vehicle makes, and a large               make and model of the vehicles
       number of vehicle models are not                 burglarized.
       among the list of verified vehicles in
       the countywide system, as a result           Cure: Once again, we relied on CVPD’s
       the system automatically alters these        data systems rather than the County’s
                                                                                                7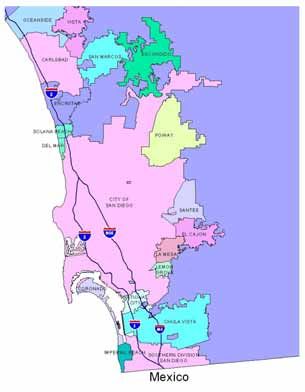
and hand pulled reports with any missing      Auto Theft Rates in San Diego
   information. The CVPD will discuss            County Differ by City According to
   these issues as well with the countywide      Proximity to the Border
   system administrator.
                                                 In 2001, according to the San Diego
Data Findings                                    Association of Governments, one out of
                                                 every 113 registered vehicles in San Diego
Addressing the data gaps allowed us to           County was stolen. Mapping the vehicle
develop a clearer picture of Chula Vista’s       theft rates by city shows rates by city vary.
vehicle crime problem. Some data offered         Chula Vista’s analyst created a choropleth
surprises, and some confirmed hunches held       map depicting 2001 vehicle theft rates, per
by the police. These are reported below.         1,000 population (using 2000 census data
                                                 when available) for San Diego County’s
                                                 cities. It showed that vehicle theft rates are
Chula Vista is Disproportionately                dramatically higher for jurisdictions closest
Victimized by Auto Theft                         to the border. The northernmost city in the
                                                 County has a 4.17 vehicle theft rate while
Chula Vista has a higher auto theft rate than    the southernmost area of the city (resting at
many larger cities, such as L.A., New York,      the border) has a 15.89 motor vehicle theft
Chicago, San Diego, San Antonio, and Fort        rate per 1,000 population. Given that the
Worth (among others). Some of these cities,      county extends only 60 miles to the north of
however, may be outliers for different           the Mexican border, we did not expect such
reasons. Comparisons to cities within            wide variation in motor vehicle theft rates
Metropolitan Statistical Areas (MSAs), such      within one county. In fact, Oceanside, San
as Chula Vista, also show that Chula Vista’s     Diego County’s most northern city is often
auto theft rate is high. In 2001, MSAs had a     used as a comparison city to Chula Vista
rate of 499.1 motor vehicle thefts per           because its population size, demographics,
100,000 persons.13 This is significantly         and income levels are similar. Yet
lower than Chula Vista’s rate of 984.0 motor     Oceanside’s motor vehicle theft rate of 4.17
vehicle thefts per 100,000.                      suggests a very different problem than Chula
                                                 Vista’s 9.84 motor vehicle theft rate. (See
Our National Review Subcommittee found           Appendix 1, Figure 3)
that some of the other U.S. border cities to
Mexico also had high auto theft rates. The       Vehicle crime clearance rates also show a
Nogales (AZ) rate of 1035.0 and Calexico         pattern: rates decrease in cities closest to the
(CA) with a rate 1128.0 exceeded Chula           border.15 Nationally, motor vehicle
Vista (although it was lower than the rate for   clearance rates hover around 14 percent.
San Diego P.D. Southern Division –               Chula Vista P.D.’s motor vehicle clearance
1589.0). McAllen (TX) had a rate of 670.0        rate is 3 percent,16 while the northern cities
close to several of San Diego counties cities    in the county have higher clearance rates.
- Escondido and La Mesa. Eagle Pass (TX),        (See Appendix 1, Figure 4)
Brownsville (TX), and El Paso (TX) had
rates below the average MSA rate, 424.0,         Analysis of vehicle theft
374.0, and 326.0 respectively, comparable to
some of the lower rates held by cities such      While analyzing the vehicle model year for
as Oceanside and Carlsbad in San Diego           vehicles stolen from our target lots we
County.14                                        discovered an aspect of the theft market that
                                                 was surprising. We did not have a luxury
                                                 vehicle theft problem. The average year of

                                                                                                8
the vehicle stolen from our lots was 1990 year. As a result, a top ten list in the county
(compared to 1992 for all vehicles stolen in may contain eight Toyota Camrys, each of a
Chula Vista). The most frequent vehicle different year. We looked at each individual
year for our lots was 1988 (compared to a tie city’s data within the county and found a
between 1991 and 2001 for all vehicles more accurate picture of the stolen vehicles
stolen in Chula Vista). This came as a by clustering certain years of makes and
surprise to CVPD officers participating in models. This is because models, from year
the Theft of Vehicle Subcommittee as they to year, are often the same until there is a
were convinced that recent, expensive major design change in the vehicle. Years
vehicles were targeted for theft. without design changes are not meaningful
as they make little difference to an auto thief
Harm levels, in terms of monetary loss, were in terms of entering the vehicle or using it
also higher than suspected. In 2001, in for parts. Once we clustered the vehicles
Chula Vista, auto theft amounted to makes/models by certain year groupings, we
approximately $12.9 million in property found that Toyota Camrys were the number
loss, nearly three times the loss from all one vehicle stolen for 2001 in the county,
robberies, burglaries and larcenies in the and Toyota trucks17 were number two. For
City combined -- $4.4 million. These auto our city and our lots, the reverse was true;
theft losses do not take into account Toyota trucks were number one, followed
compensation from insurance companies or by Toyota Camrys. (See Appendix 1,
the value if the vehicle is recovered, Figure 6)
however, since the vehicles stolen from our
lots (25 percent of all vehicles taken in In comparing our lot list to the national list
Chula Vista) were predominately older of vehicles stolen in the year 2001, there
vehicles the impact of the theft is more was little match. Only Toyota Camry was on
severe. Older vehicles are unlikely to be both lists. While Ford F150 Pickup appears
insured for theft. Premiums are costly on the national list, ours were not
compared to the value of the car and the specifically Ford F150 pickups, we had
deductible one pays if it is stolen. losses for a variety of Ford pickups.
Types of Vehicles Stolen from Our We were surprised to find that three of the
Lots top five vehicle types stolen from our target
lots were trucks. We asked crime analysts in
We determined that five vehicles accounted the county’s other cities to determine the
for 42 percent of the vehicles stolen from percentage of their stolen vehicles that were
our target areas. In fact, one-third of all trucks. The percentages in the county ranged
Camrys stolen in Chula Vista were stolen from 34 percent to 43 percent. The city of
from our target lots and 30 percent of all Chula Vista, with 43 percent, had the
Toyota trucks stolen in Chula Vista were highest percentage of trucks stolen.
stolen from our lots. (See Appendix 1,
Figure 5) We decided to look at our truck theft
problem more systematically and compare
We compared the five most stolen vehicles car versus truck theft recoveries. We found
from our lots to the top ten vehicles stolen that recoveries of trucks stolen in Chula
from the city and then again to those of the Vista (recovered anywhere in the U.S) -- 43
county. There was some overlap with our percent, were much less than recoveries of
city list, however we ran into difficulty in autos stolen from Chula Vista -- 69 percent.
county comparisons. The county calculates This suggested several things. First, as our
their top ten list by vehicle make, model and auto recovery rate exceeded the national
9recovery rate (62 percent), Chula Vista’s high schools and the college had the highest
auto theft problem appeared to be more of a recovery rates for vehicles stolen (75 percent
theft for transportation and joyriding and 67 percent respectively) indicating theft
problem than our truck theft problem. for transportation or joyriding as the
Second, the market for Chula Vista’s stolen predominate motivations underlying the
trucks might be in Mexico. theft. However, seven of the ten target lots
had recovery rates of 50 percent or below
Testing Theories (four were below 37 percent) indicating theft
for export or dismantling for parts. (See
Based on the analysis at this point, we Appendix 1, Figure 8)
formulated three theories for testing. First,
we believed the recovery rates for stolen When we examined recovery rates within
vehicles in San Diego county cities closer to our targets by type of vehicle we found an
the border would be lower than those of the even more surprising aspect of the vehicle
cities in the northern portion of the county. theft problem. Within our targets, certain
Second, specifically related to trucks, we stolen vehicles had lower recovery rates than
believed truck recovery rates would be others. We compared recovery rates within
lower than auto recovery rates in San Diego our targets by make and model of vehicle for
County. Third, we believed truck recovery our top 5 vehicles stolen. We found that
rates would decline the closer the city is to Nissan Sentras had a recovery rate of 63
the border. percent, Nissan trucks had a recovery rate of
44 percent, Ford trucks had a recovery rate
The analyst created two side by side of 32 percent, Toyota Camrys had a
choropleth maps of cities in the county, one recovery rate of 13 percent, and finally,
of recovery rates for cars, the second of Toyota trucks had a dismal recovery rate of
truck recovery rates. For cars, we found that only 9 percent. These figures indicate that
recovery rates in the northern part of the Nissan Sentras thefts represent more of a
county (45 to 60 minutes from the border, theft for transportation or joyriding problem,
absent traffic) averaged between 80 to 90 and Toyota Camry and Toyota truck theft
percent. In the southern part of the county represent more of a theft for parts
(10 minutes or less to the border, absent dismantling or export problem. As shells of
traffic), recovery rates ranged from 53 to 69 vehicles or stripped vehicles are rarely
percent. For trucks, we found that recovery recovered for Chula Vista’s stolen vehicles,
rates were substantially lower than auto it appears clear that our Toyota truck and
recovery rates and dropped as one Toyota Camry theft problem is almost
approached the border. In the northern part exclusively a theft for export problem. (See
of the county, truck recovery rates averaged Appendix 1, Figure 9)
between 74 to 77 percent. In the southern
part of the county, recovery rates ranged We had one remaining question. Really, all
from 23 to 43 percent. (See Appendix 1, of San Diego County is near the Mexican
Figure 7) border, so why do cities closest to the border
have such dramatically lower recovery
Recovery rates showed other interesting rates? Early on in the analysis, the Theft of
patterns. In Chula Vista, when autos and Subcommittee found that the lots in Chula
trucks were combined, the recovery rate for Vista where theft concentrated were lots
2001 was 58 percent. However, in our target where customers parked for more than a few
lots, the recovery rate dropped to 45 percent. minutes. These lots were not lots where one
We also found that some of the target areas spends a brief amount of time in a store. We
had higher recovery rates than others. The did not find theft concentrating, for instance,
10at supermarkets, where access to express stolen from these lots can be across the
lanes might clip the time that parkers spend border -- in 10 minutes or less -- well before
away from their car. Our lots were next to victims notice their loss. Pulling these
places such as swap meets, trolley stops, findings together, it presents a vivid picture
department stores, and a movie theatre, of why offenders interested in theft for
where parkers are almost guaranteed to export, targeted these lots: 1) these lots
spend predictably long amounts of time contained a wide choice of vehicles from
away from their vehicles in lots that store which to steal; 2) these lots catered to longer
employees infrequently peruse. parked customers, making it unlikely that
offenders would be caught in the lot; 3)
We believed that the nature of our target lots there are no vehicle checks at the border
held the answer to the question of why the when entering Mexico20 again reducing the
cities closest to the border experienced risk of getting caught 4) even if there were
higher auto theft rates and dramatically checks, at this point in the theft, the vehicles
lower recovery rates. The Auto Theft would not as yet be reported stolen; 5)
Subcommittee pondered this question in the within 10 minutes of the theft, the vehicle
context of the time parkers spent on average would be in another country and ready for
in our target lots. We focused again on the immediate resale.
time parked data. We had found that
victims, on average, parked over an hour in The same is true for National City (12 to 15
our target lots before noticing their loss. For minutes to the border) and San Diego Police
some of our top ten lots, victims parked, on Department Southern Division (1 to 9
average, more than three hours before minutes to the border). These three areas
noticing their loss. We also calculated the experience the greatest rates of theft as their
most frequent length of time before proximity to the border creates low-risk,
discovery of the loss, and in only three of high reward opportunities for motivated
the top ten lots were the stolen autos parked thieves.
less than an hour; most had considerably
higher timeframes (between one and 11 We should note that at the beginning of the
hours) before the loss was noticed. project, Police in Chula Vista felt that export
of stolen vehicles into Mexico was fueling
We believe the offenders selected these Chula Vista’s problem. As it turns out, this
particular lots because potential victims is partly true. It is true for certain lots and
would be away from their vehicles for long for certain types of vehicles. Police also
periods of time, reducing offenders’ risk that believed that border interventions, beyond
the victim would catch them stealing their the license plate cameras, would put a stop
vehicle. Not surprisingly, each of the three to the flow of stolen vehicles. Our results
trolley station lots in Chula Vista were in the prove otherwise. Border interventions will
top ten list, as trolley lot parkers are away not reduce Chula Vista’s auto theft problem,
from their vehicles for considerable amounts as the vehicles are not yet reported stolen
of time. The results of the length of time when they cross into Mexico. Closing the
parked pointed to rational choice theory in barn door (i.e. interventions at lots where
action.18 Offenders weighed risk versus auto theft concentrates rather than the border
reward, however limited or unconscious that itself) becomes the best solution for auto
process was.19 theft in cities closest (within 15 minutes) to
the Mexican border.
The greater significance of the results of the
length of time parked for Chula Vista’s Given the high auto theft rates near the
target areas soon became apparent. Vehicles border, why can’t the U.S. side of the border
11stop all vehicles before they enter Mexico that six people were repeat victims of auto
and seek to determine if the vehicle actually theft within that year in our target lots.22 A
belongs to the driver? We examined this more robust revictimization analysis, using
alternative and believe it is wholly at least a rolling 12-month period from and
unworkable. Lines of stopped vehicles into before the date of the 2001 victimization
Mexico would cause major traffic jams. On would probably result in higher findings of
the Mexican side of the border all vehicles revictimization within our target lots.23 As
are stopped before they can enter the U.S. well, if we had used this longer time frame
(except those whose owners undergo and looked at revictimization beyond our
background checks and pay for express target lots, in all parts of the City, we
passes). The wait to enter the U.S. can be as believe we would have found more
long as three hours. Our National Review significant levels of revictimization.
Subcommittee, in interviews with border
agencies, found little interest in vehicles Offender interviews
leaving our country, even if they were stolen
vehicles. Border agencies see their mission, Our Offender Subcommittee was tasked
particularly post September 11, 2001, as with offender analysis, including interviews
national security, not local vehicle theft. of arrestees from our target lots. The
Offender Subcommittee, with the assistance
Why not simply stop all Toyota trucks and of the DOJ consultant, developed a 93-item
Camrys, narrowing the search for stolen interview protocol, drawn, in part, from auto
vehicles to those at high risk? This too is theft offender interview literature.24 We
impractical. Camrys are the most sold included a substantial number of questions
vehicle in the U.S., and stops would once about theft for export.25
again cause tremendous traffic jams
blocking off parts of the major southbound The Subcommittee encountered a number of
freeway. This freeway has exits all the way obstacles. As arrest rates for auto theft
down to the border to allow vehicle entry offenders in Chula Vista were low, the pool
into neighborhoods adjacent to the freeway. of offenders for our analysis was unlikely to
Could we just stop Toyota trucks? They are produce generalizeable results. Specifically,
fairly common in San Diego County. We in our target lots, only three auto thieves
believe if stopped at the border, an auto thief were arrested in all of 2001, indicative of the
could simply say the vehicle belongs to a low risk levels offenders faced stealing from
friend of a friend, and it would take time our lots.26 Given the low rates of
(probably 30 minutes or more) to sort out apprehension in our lots, the Offender
vehicle ownership. In that time, the vehicle Subcommittee interviewed 17 auto thieves
is still not likely to be reported stolen.21 who had been apprehended for stealing
vehicles anywhere in Chula Vista in 2001.
Further Analysis They may have at some point, stolen from
our lots, if so, they were never apprehended
During the course of the project, we for it. Fifteen of the 17 were parolees, and
examined other data to build an accurate two were still in-custody for auto theft. The
picture of theft of and from vehicles in small size of this interviewed population
parking lots. This is detailed below. prevents us from drawing any firm
conclusions about auto thieves in Chula
Revictimization Vista. A more precise picture could only be
drawn from a sufficient sample of active
We examined the 2001 data for auto thieves, however, that type of research
revictimization in our target lots. We found is beyond the scope of this project. Despite
12these barriers, some interesting information
was gathered. Risk Rates of Lots
CVPD officers administered the surveys. Our Risk Rate Subcommittee made some
They found that many of the offenders liked interesting findings. The target lots with the
to target parking lots since they offered so highest volume of thefts were not
many vehicle choices in unguarded settings. necessarily those with the highest risk rate.
Many said they took orders from “higher- One of our target lots, the Swap Meet, open
ups” for specific vehicles, makes, and only two days a week experienced 42 auto
models. Many worked with a second person thefts in 2001 and two auto burglaries. We
who could act as lookout. A number said suspected that the Swap Meet would have
they would conduct surveillance, wait for the highest lot risk rate. This turned out to be
the vehicle they wanted, watch the person untrue, as some of the smaller lots, open 7
park and enter a store to ensure that the days a week, even with lower volumes of
vehicle owner would be away from their theft were much riskier. When the
vehicle for some period of time. Subcommittee took into account the volume
of cars entering and exiting these lots, the
A number of the thieves also admitted number of parking spaces in these lots, the
taking stolen vehicles into Mexico. Some average length of time parked for these lots,
targeted older Toyotas, as any old Toyota and the number of days these lots were open
ignition key opened and started the vehicle, to parking, they found that Chula Vista’s
reducing the effort27 involved in stealing trolley commuter lots had risk rates of up to
these vehicles.28 This last finding came as a ten times higher than the average of the
surprise to auto theft detectives who had other lots combined. Perhaps we should not
believed that auto thieves used shaved keys. have been so surprised as the trolley lots
Offenders picking old Toyotas didn’t even (amongst all the target lots) had the most
have to make the effort to shave an old key. favorable conditions for auto theft (a wide
The ease of stealing old Toyotas explains range of older vehicles, no regular security
their presence on our top five list.29 patrols, unfettered access, multiple exits,
vehicle owners parked for very long periods
The thieves said that parking lot cameras of time, and proximity to the freeway – two
and active security patrols were the most minutes or less by car). (See Appendix 1,
likely security precautions to deter them Figure 10)
from particular lots. Only one of our major
target lots has cameras, the Chula Vista Environmental Characteristics and
Mall. Two other smaller ones do, and this is Management Oversight of Lots
discussed later in this paper. An earlier POP
project by a CVPD sergeant at the Chula Our Environmental Subcommittee examined
Vista Mall resulted in the installation of an target lot characteristics to see if Clarke’s
extensive camera system in the Mall lots. POP Guide pinpointed characteristics that
This reduced auto theft there by 50 percent. lessened theft consistent with our findings.
Even with this reduction, the number of auto Subcommittee members also conducted lot
thefts and auto burglaries placed this lot as manager interviews. In all, they completed
one of our ten target areas (Target Area 3). 46 surveys in the 10 target areas. Fifty-four
While measures to effectively counter percent of the worst 13 lots (accounting for
parking lot auto theft go beyond cameras 300 auto thefts in 2001) had no physical
and patrols, these offenders identified two security measures in place. Forty-six percent
significant deterrence interventions of the worst 13 lots had no uniformed
suggested in the POP Guide.30 security. From the management interviews,
13Subcommittee members gleaned that most less than two minutes from the vehicle
lot managers had no idea of the number or border entry into Mexico. Using the
frequency of auto theft and auto break-in in countywide crime system, we confirmed few
their lots. For the lots with the highest vehicle crimes at the site and we conducted
volume of auto theft in Chula Vista, lot several site visits to the Mall. When the Mall
managers were uninformed about the extent added electronic ticketing-triggered gate
of the problem in their lots. Sometimes those arms, staffed exits to collect tickets, and
who owned the lots did not own the stores, extensive cameras and security patrols,
so customer complaints of theft (although vehicle crimes dropped to near zero.31 This
many customers do not bother to complain is in contrast to a mall one-half block north,
to the store, they prefer to call the police) which has none of these countermeasures.
may not have filtered back to lot owners. This second lot has an extremely high
For those lot managers who were also store number of vehicle crimes. (See Appendix 1,
managers, they were more concerned with Figure 11)
the inside of the store – managing the
business – than the parking lot. Our comparisons to lots with the
countermeasures outlined in the Guide
None of the lots in Chula Vista in our ten against those without gave weight to the
Targets possessed the full set of value of the guide in the eyes of
countermeasures advised in the Guide to subcommittee members.
reduce vehicle crime. The full set of
recommended countermeasures include an Action
electronically armed ticket entry system
with staffed exit points for ticket recovery, During the course of this analysis, we
cameras, active security, and perimeter determined that the countermeasures in the
control. However, there are lots in some Guide are highly practical solutions to
parts of the County with these vehicle crime in Chula Vista’s lots,
countermeasures. particularly those lots held by the larger lot
owners. For some of the smaller target area
Approximately 7 miles north of Chula Vista lots, where cost or lot design might preclude
in the city of San Diego there are three large some of these countermeasures,
shopping malls. One employs the array of Subcommittee members met and
countermeasures in the Guide (Horton brainstormed solutions for specific lots
Plaza), the other two -- Fashion Valley and (consistent with those outlined in the
Mission Valley Malls -- do not. Horton Guide). The analysis and the brainstorming
Plaza, where the parking is in a decked session were completed in October 2002. In
garage, had fewer than 10 auto thefts, while January 2003, Chula Vista Police began
the other two malls (a mix of flat lots and meetings with lot owners to request
garages) exceeded 150 a year in 2001. implementation of the Guide’s
countermeasures, and/or the brainstormed
We met with San Diego Police Southern suggestions developed from the analysis.
Division auto theft detectives and shared our We briefed every patrol officer, detective,
findings, as they experienced 1,500 stolen manager and command level staff on the
vehicles in a community of less than analysis results and provided specific patrol
100,000. In our discussion, we asked if there and detective strategies for reducing the
was a lot where they were surprised to find extent of vehicle crime in lots in Chula
few auto thefts. The detectives mentioned Vista. In addition, as a result of the analysis,
Las Americas Mall, located on the last street we successfully advocated for the
in San Diego, abutting Mexico. The Mall is reinstatement of a crime analyst position for
14San Diego’s Regional Auto Theft Task project.
Force. The project goal of finding more
effective responses to vehicle crime in Without committed leadership, problem-
parking lots has been met, although solving is unlikely to occur. During the
implementation (goal number two) remains. course of this project, CVPD Chief Rick
Emerson strongly advocated support for
As for the two other goals of this project, problem-solving. He actively participated in
these are addressed in the paragraphs that the project (problem selection, presentation
follow. We believe that these have been met, of analysis, presentation of analysis results
although it will be important for CVPD to to the Department, city manager, city agency
determine as time progresses whether the administrators, and the brainstorming
impact of the project lasted beyond the close session). In response to this active
of the analysis phase of the auto theft leadership, more officers have sought out
project. the Department’s Tough on Crime Analyst
and the Department’s researcher in
In determining the utility of this particular accessing information for potential POP
POP guide, one measure is its accuracy in projects. In fact, during 2002, Chief
succinctly delivering important aspects of Emerson required candidates to present
research related to the problem. We read and information from several of the POP guides
reread the guide as it provided key elements (speeding, false alarms, and misuse and
in understanding vehicle crime generally, abuse of 911) for promotion to the rank of
and vehicle crimes in parking facilities in agent, sergeant and lieutenant, spurring
particular. Initially, there were some discussion in the Department of these topics
disbelievers among the officers as to the and the research.
efficacy of lot interventions. This was
dispelled once our analysis was complete. Karin Schmerler, the Department’s research
Another measure of the Guide is whether we analyst, during her relatively short tenure in
would have been able, on our own, to CVPD, has stimulated enormous interest in
pinpoint the reason for high theft rates, low problem-solving among Department
recovery rates, and the measures needed to employees. Also, she advocated for the
turn these around. Without the Guide we Department’s participation in state and
would not have been able to accomplish this. federal problem-solving projects (such as
The Guide served as a foundation for our this one and the state-funded bullying in
work, and steered us along the way. schools grant). Karin was involved in all
phases of the analysis of this project.
In terms of whether this particular auto theft
project has improved the police Lt. Don Hunter, as coordinator, helped drive
department’s capacity to routinely problem this project within the Department, and it is
solve, the last goal, perhaps so. During the clear that he will be engaged in driving
course of the project, employees developed problem-solving more routinely in Chula
a greater awareness of all the POP guides, Vista. Lt. Hunter is extremely committed to
and of situational crime prevention, rational and knowledgeable about problem-solving.
choice theory and routine activity theory32. As a champion of problem-solving he has
More important, however, has been the been a key advocate in the Department for
leadership shown in promoting problem- more active and analytic problem solving on
solving by four CVPD employees: Chief the part of its employees. Lt. Hunter
Emerson, Karin Schmerler, Lt. Don Hunter, participated in every phase of the analysis of
and Nanci Plouffe. Each was involved in this project.
almost every stage of analysis of this
15The contribution Tough on Crime Analyst attention to research, not just analysis, and
Nanci Plouffe made to this project and in knowledge of effective and ineffective
fostering problem-solving cannot be countermeasures. The Chula Vista research
overstated. Ms. Plouffe is a premier crime analyst, a key person on the motel crime
analyst. Her analysis skills have ensured that project, supervised research on crime at area
the Department can engage in quality crime motels. Because of the work she and the
analysis. Perhaps in recognition of her CVPD conducted during this project, Ms.
extraordinary work on this auto theft project, Schmerler was enlisted to author a POP
Ms. Plouffe was selected to participate (with guide on motel crime. During the course of
only 8 others) in the first ever, problem the vehicle collision project, participants
analysis training for crime analysts offered read and discussed the Speeding in
by the Police Foundation. Ms. Plouffe Residential Areas POP guide, becoming
extracted all the data, crunched it, assisted in familiar with roadway conditions causing
its analysis, and created all the charts. speed-related crashes. In the bullying in
schools project, participants read, discussed
It is worth noting that this project, and and will be following the research outlined
others the CVPD is engaged in (crime in in the Bullying in Schools POP guide. These
budget motels, traffic collisions, bullying in all are evidence, not simply of the value of
schools), place the Chula Vista Police individual guides, but of the use these guides
Department among cutting edge agencies can be put to in spurring higher level
engaged in higher-level problem-solving. problem-solving.
Higher-level problem-solving requires
16REFERENCES
Association of Chief Police Officers (n.d.). The Secured Car Park Award Scheme. Guidelines for
Self-Assessment. London: Home Office.
Barclay, P., J. Buckley, P. Brantingham, P. Brantingham, and T. Whinn-Yates
(1996). “Preventing Auto Theft in Suburban Vancouver Commuter Lots: Effects of a Bike
Patrol.” In R. Clarke (ed.), Crime Prevention Studies, vol. 6. Monsey, NY: Criminal Justice
Press.
Clarke, R. (1997). Situational Crime Prevention: Successful Case Studies (2nd ed.). New York:
Harrow & Heston.
Clarke, R. (2001). Theft of and From Cars in Parking Facilities. Problem-Oriented Guide Series,
U.S. Department of Justice, COPS Office, available at www.usdoj.gov.
Clarke, R. and D. Cornish (1985). Modeling Offender’s Decisions: A Framework for Policy and
Research. In M. Tonry and N. Morris (eds.), Crime and Justice: An Annual Review of Research,
vol. 6. Chicago: University of Chicago Press.
Clarke, R. and H. Goldstein (2003). Theft from Cars in Center-City Parking Facilities: A Case
Study. U. S. Department of Justice, COPS Office, available at www.usdoj.gov.
Clarke, R. and D. Weisburd (1994). “Diffusion of Benefits: Observations on the Reverse of
Displacement. In R. V. Clarke (ed.), Crime Prevention Studies, vol. 2. Monsey, NY: Criminal
Justice Press.
Cohen, L. and M. Felson (1979). Social Change and Crime Rate Trends: A Routine Activity
Approach. American Sociological Review, 44:588-608.
Cornish, D. and R. Clarke (eds.) (1986). The Reasoning Criminal. Rational Choice Perspectives
on Offending. New York: Springer-Verlag.
Cornish, D. and R. Clarke (1987). Understanding Crime Displacement: An Application of
Rational Choice Theory. Criminology, 25:933-947.
Farrell, G., Sousa, W. and D. Lamm Weisel (2002). “The Time-Window Effect in the
Measurement of Repeat Victimization: A Methodology for its Examination, and an Empirical
Study.” In N. Tilley (ed.), Analysis for Crime Prevention, Crime Prevention Studies, vol. 13.
Monsey, NY: Criminal Justice Press.
Felson, M. (1998). Crime and Everyday Life (2nd ed.). Thousand Oaks, CA: Pine Forge Press.
Field, S., R. Clarke, and P. Harris (1991). “The Mexican Vehicle Market and Auto Theft in
Border Areas of the United States.” Security Journal, 2(4):205-210.
Fleming, Z., P. Brantingham, and P. Brantingham (1994). “Exploring Auto Theft in British
Columbia.” In R. Clarke (ed.) Crime Prevention Studies, vol. 3. Monsey, NY: Criminal Justice
Press.
17U.S. Department of Justice (2002). Crime in the United States: 2001 Uniform Crime Reports.
Federal Bureau of Investigation. Washington, D.C.: U.S. Department of Justice.
Light, R., C. Nee and H. Ingham (1993). Car Theft: The Offender’s Perspective. Home Office
Research Study No. 130, A Home Office Research and Planning Unit Report, London: Home
Office.
U.S. Department of Justice (2002). Crime in the United States: 2001 Uniform Crime Reports.
Federal Bureau of Investigation. Washington, D.C.: U.S. Department of Justice.
18APPENDIX I
Figure 1: Map of San Diego County
Table 1: Target Areas
2001 Total Vehicle Top 10 CFS
Target 2001 Data Crimes Location
1. East H Shopping Center 97
2. Broadway and Palomar 146 X
3. CV Mall 107 X
4. Walmart Shopping Center 48 X
5. Swap Meet 44
6. E Street Trolley and nearby motel lots 41 X
7. H Street Trolley and nearby neigh. lots 122 X
8. Southwestern College 36 X
9. All High Schools 31
10. K-Mart Shopping Center 16
Total for the City 3,368
Total for the Targets 680 6 of 10
19Figure 2: Map of Chula Vista with Target Areas
20Figure 3: San Diego County Motor Vehicle Theft Rates by City (per 1,000 residents)
Figure 4: 2001 Clearance Rates for Auto Theft for Cities in San Diego County
13%
La Mesa
12%
Carlsbad
7%
El Cajon
6%
Southern Division/SDPD
5%
National City
4%
San Diego
3%
Chula Vista
0% 2% 4% 6% 8% 10% 12% 14%
21Figure 5: 5 Vehicles Accounted for 42% of Vehicles Stolen in Target Lots
Toyota Trucks 15%
Toyota Camrys 8%
Nissan Trucks 7%
Ford Trucks 7%
Nissan Sentras 5%
Figure 6: Clusters of Make, Model and Year for Top Ten Vehicles Stolen
in San Diego County in 2001
(data from 7 San Diego County cities)
1985-1991 Toyota Camrys 29
1985-1989 Toyota Trucks
14
1989-1994 Nissan Sentras
7
1991-2000 Honda Civics 5
4
1990-1991 Honda Accords
2
1994-1997 Acura Integras
1997 Ford Trucks 2
0 5 10 15 20 25 30
Number of Times Vehicle in these Years was one of the Top
Ten Vehicles Stolen for Cities in San Diego County
22You can also read