Three Steps to Multimodal Trajectory Prediction: Modality Clustering, Classification and Synthesis
←
→
Page content transcription
If your browser does not render page correctly, please read the page content below
Three Steps to Multimodal Trajectory Prediction: Modality Clustering,
 Classification and Synthesis

 Jianhua Sun, Yuxuan Li, Hao-Shu Fang, Cewu Lu§
 Shanghai Jiao Tong University, China
 {gothic,yuxuan li,lucewu}@sjtu.edu.cn fhaoshu@gmail.com
arXiv:2103.07854v2 [cs.CV] 22 Mar 2021

 Abstract process confusing, and ii) the prediction results are not de-
 terministic which may leave potential safety risks.
 Multimodal prediction results are essential for trajec- The third line of classification frameworks [3, 25] gets
 tory prediction task as there is no single correct answer rid of the two defects by classifying the observation to
 for the future. Previous frameworks can be divided into predefined future trajectories, as the classification opera-
 three categories: regression, generation and classification tion can give probabilities and ensure determinacy. How-
 frameworks. However, these frameworks have weaknesses ever, the classification frameworks still face certain weak-
 in different aspects so that they cannot model the multi- nesses. First, the predefined trajectories are obtained by
 modal prediction task comprehensively. In this paper, we hand-crafted principles, thus it is difficult to capture com-
 present a novel insight along with a brand-new prediction prehensive representations for future behaviors. Second,
 framework by formulating multimodal prediction into three the predicted deterministic trajectories will be the same for
 steps: modality clustering, classification and synthesis, different inputs classified to a same class, which fails to
 and address the shortcomings of earlier frameworks. Ex- explore fine-grained motions for traffic agents determinis-
 haustive experiments on popular benchmarks have demon- tically. Due to these weaknesses, the performance of a clas-
 strated that our proposed method surpasses state-of-the-art sification framework lags behind state-of-the-art regression
 works even without introducing social and map informa- and generation models. Further, a highly annotated scene
 tion. Specifically, we achieve 19.2% and 20.8% improve- raster is required as the input of classifier which is difficult
 ment on ADE and FDE respectively on ETH/UCY dataset. to access in many cases.
 Our code will be made publicly available. In this paper, we aim to explore a distinct formulation
 for trajectory prediction framework to address the short-
 comings discussed above. We present the insight of Pre-
 1. Introduction diction via modality Clustering, Classification and Syn-
 thesis (PCCSNet) by solving multimodal prediction with
 Trajectory prediction [1, 7, 30, 28, 13, 9, 17, 35, 20, 6] is a classification-regression approach. In our vision, the
 one of the cornerstones of autonomous driving and robot modalities of the future are usually centralized around a
 navigation, which investigates reasonable future states of few different behaviors which can be revealed by a series of
 traffic agents for the following decision-making process. learned modality representations. We can apply a deep clus-
 Considering the uncertainty of human behaviors and the tering process on training samples and each center of clus-
 multimodal nature of the future [7, 13], one great challenge ters could represent a modality. Naturally, such a modality
 of trajectory prediction lies in predicting all possible future can be formulated into a class, and a classification network
 trajectories of high probabilities. can be adopted to distinguish and score the modalities ac-
 To tackle this problem, previous research mainly fol- cording to the observed trajectory in this manner. Finally, a
 lows three lines. The first line adds extra randomness for synthesis process is used to regress prediction results for
 regression frameworks [35, 17], while the second genera- highly probable modalities with historical states and the
 tion line [7, 13, 20, 28] models the multimodal nature by modality representations.
 learning a distribution of the future. But both lines have We propose a modular designed framework to model this
 two defects as shown in Fig. 1: i) lack of probability cor- novel insight summarized in Fig. 2. States of agents are first
 responding to each modality which may leave the decision fed into feature encoders to get deep historical and future
 representations for better clustering, classification and syn-
 § Cewu Lu is the corresponding author. thesis [2]. These deep features are clustered for modality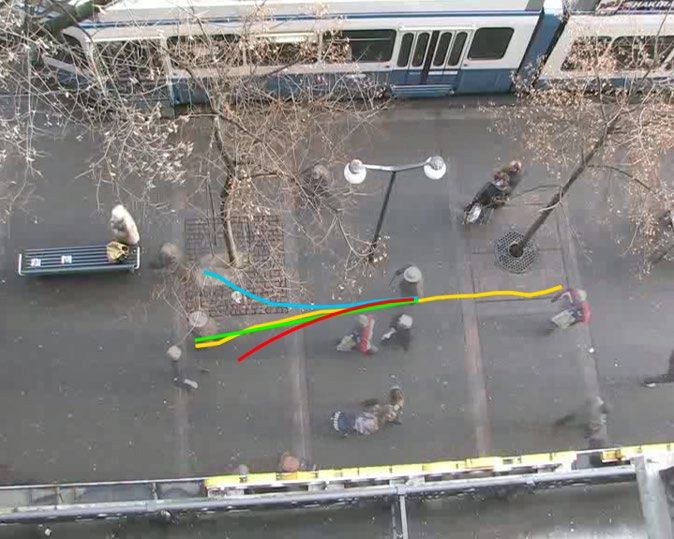
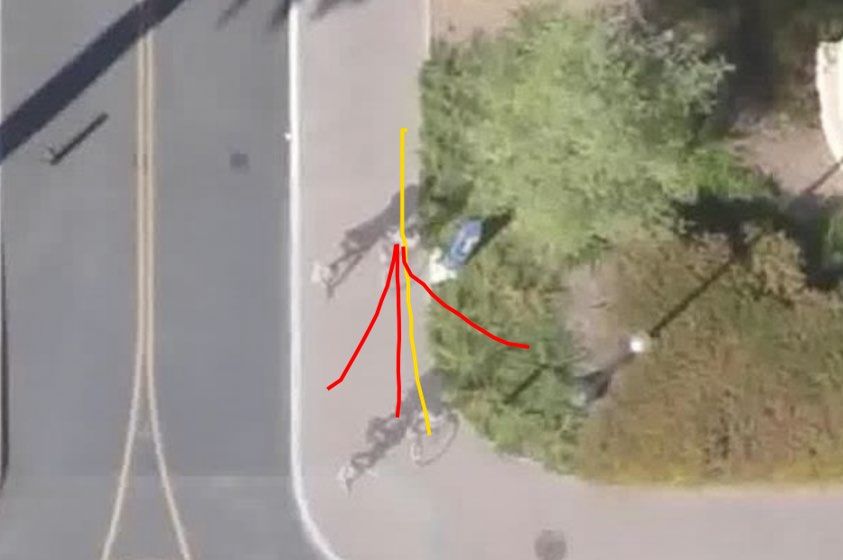
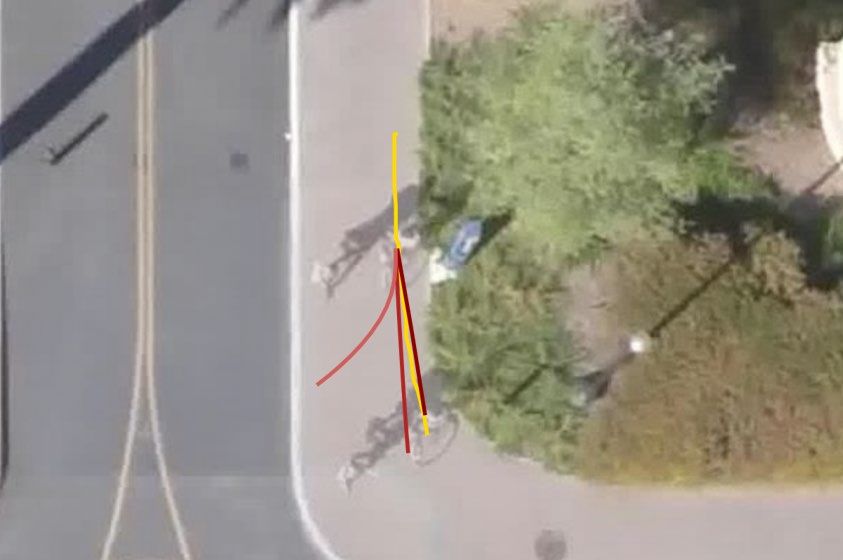
ignore the multimodality of the future and only aim at pre-
 dicting the most possible future trajectory. Recently, a great
 number of research proposes various frameworks to formu-
 late this non-functional relationship. They mainly follow
 three common practices, regression, generation and classi-
 fication.
 Regression Frameworks. Regression models [1, 18] are
 first proposed to solve unimodal prediction tasks and show
 great performance. However, these encode-decode struc-
 tures are not able to give multimodal predictions, and some
 (a) (b)
 methods address this defect by adding noise [35] or using
Figure 1. Examples of why probability and determinacy of a pre- random initialization [17]. Although multiple different pre-
diction algorithm is important, where (a) illustrates a confusing dictions can be obtained by imposing randomness on the
case without probabilistic predictions and (b) illustrates a safety model, it is difficult for randomness to accurately model the
hazard of stochastic predictions. In figure (b), the red path should multimodal nature of future.
always be predicted for safety purposes. A detailed discussion is
in Sec. 2. Generation Frameworks. Some research considers the
 multimodality of the future as a distribution, formulates
representations and used to train a classifier where the clus- trajectory prediction as a distribution fitting and sampling
ter assignments are seen as pseudo-labels. The classifier problem, and introduces generative models to solve it. DE-
will score the modalities according to historical representa- SIRE [13] first introduces stochastic model to learn the dis-
tions in test phase for probabilistic prediction. A synthesis tribution of future states, and generates diverse predictions
module is then introduced to regress pseudo future repre- by sampling plausible hypotheses from that distribution.
sentations for each modality, and finally both historical and Following this formulation, plenty of research [7, 20, 28]
synthesized future representations are decoded to get fine- aims at designing different generative structures to pursue
grained deterministic predictions. Moreover, we newly pro- more reasonable outcomes and achieve the state-of-the-art
pose a Modality Loss to enhance the capability of the clas- performance.
sifier to identify multiple highly probable future modalities.
 We conduct exhaustive experiments on multiple popular Classification Frameworks. Some research [3, 25] at-
trajectory prediction benchmarks. In these experiments, our tempts to use a classification network to solve this problem
novel prediction framework exhibits high accuracy, great by classifying on predefined artificial modalities. Multi-
robustness and adequate projections for the future. Specif- path [3] clusters a fixed set of anchor trajectories with mean
ically, we achieve 19.2% and 20.8% improvement in aver- square error distance, and classifies the input to these an-
age on ADE and FDE respectively on ETH [24]/UCY [12] chors. CoverNet [25] revises Multipath by manually de-
datasets comparing with state-of-the-art method [35]. signing anchors. Approaches under this framework face
 three main weakness. First, the predefined trajectories are
2. Background and Related Work obtained by subjectively designated clustering distance or
 manually designed anchors, thus it is difficult to capture the
 The trajectory prediction task is proposed to forecast full range of future behaviors. Second, it is hard for these
possible trajectories of an agent. It takes advantages from predefined trajectories to capture fine-grained motions. Fur-
tracking [27, 23] and human interactions [36, 34, 15], and ther, both methods require a highly annotated scene raster as
has many applications in the field of robotics and au- input for classification which is difficult to access in many
tonomous driving [8, 26, 31, 32]. Observing the multimodal cases.
nature of the future which can be interpreted as no single
correct answer for the future [7], an important point lies in Probability and Determinacy. The properties of probabil-
how to predict multiple highly probable trajectories. This ity and determinacy are important for a multimodal predic-
task is named as multimodal trajectory prediction. Note that tion approach. i) Probability. The probabilistic property of
a small part of methods [4, 16] re-formulate this task by pre- future [10] are extremely helpful to improve the effective-
dicting probabilistic maps in pixel level. We mainly discuss ness of the ensuing decision-making process. In Fig. 1 (a),
prevailing approaches that outputs multiple possible trajec- a probabilistic prediction can tell that the pedestrian is most
tories of spatial coordinate system (meters) in real world in unlikely to take the left path (on the reader’s side). There-
this paper. fore, the robot can follow the left path (on the reader’s side)
 Multimodal prediction task is non-trivial as a single input to avoid collision as far as possible. ii) Determinacy. A
may map to multiple outputs. Early works [1, 21, 33, 11] stochastic framework may leave huge potential safety risks.
 Clustering
 ······

 ······

 ( , , … )

 ∗

 Classifier

 Past ······
 Encoder

 ······
 Decoder

 Future
 Encoder

 fc fc

 Subtraction

 Concatenation
 Pseudo Future Representation Synthesis

Figure 2. Overview of our proposed prediction pipeline. The arrows in yellow are only present in training, when both historical and
future representations are concatenated and clustered for future usage. At test time, historical representations are fed into a classifier to
score different modalities. The modality representations are then processed with the historical representations to synthesize multimodal
predictions.
Fig. 1 (b) gives a common case that a bus (autonomous ve- sonable coordinate sequences Ŷ = {Ŷ1 , Ŷ2 , . . . , Ŷk } in
hicle) perceives a pedestrian at the crossroads when moving [Tobs+1 , Tobs+pred ] along with their probabilities P =
forward. A stochastic model cannot be proved to predict {p1 , p2 , . . . , pk } as output.
the trajectory in red every time. And if it fails, a traffic acci-
dent will happen. But most regression and generation mod- 3.2. Overview
els miss these two points, as equiprobable randomness is In PCCSNet, we introduce an intermediate variable
introduced. Previous approaches with classification frame- named modality representation M to formulate multimodal
works can give probabilistic and deterministic predictions, prediction framework into three steps of deep clustering,
but these frameworks fail in exploiting deep behavior rep- classification and synthesis. All of the possible modality
resentations and fine-grained motions as discussed above. representations can be obtained by clustering deep histor-
 We propose a probabilistic and deterministic framework ical representations RH and future representations RF of
in this work which can still capture deep behavior represen- training samples and gathered into a modality set M
tations and give predictions at fine-grained level. The great
differences between our proposed framework and previous RH = fH (X), RF = fF (Y ) (1)
classification frameworks will be discussed in Sec. 3.7.
 i
 M =clustering({[RH , RFi ]|i ∈ trainset})
 (2)
3. Approach ={M1 , M2 , . . . , Mn }
 In this section, we introduce a newly proposed PCCSNet where past encoder fH (·) and future encoder fF (·) are
prediction pipeline, which is illustrated in Fig. 2. Our main trained to learn better representations of historical trajectory
insight is to formulate the multimodal prediction frame- X and future trajectory Y following [2].
work as a classification-regression process. It is designed Then, through modality classification and modality syn-
to model multimodal trajectory task more comprehensively thesis, we can acquire Ŷ along with its probability P by
by addressing the shortcomings of prior frameworks.
 P = gM (RH ) (3)
3.1. Problem Definition
 Ŷ = {Ŷi = h([RH , Mi ])|i ∈ [1, n]} (4)
 Following previous works [1, 7], we assume that each
video is preprocessed by detection and tracking algorithms where gM (·) represents modality classification on M and
to obtain the spatial coordinates for each person at each h(·) represents modality synthesis. In this manner, we can
timestep. We take the coordinate sequences X in time predict probabilistic multimodal future trajectories deter-
step [1, Tobs ] as input, and predict top k multiple rea- ministically. Note that we often predict k (k < n) future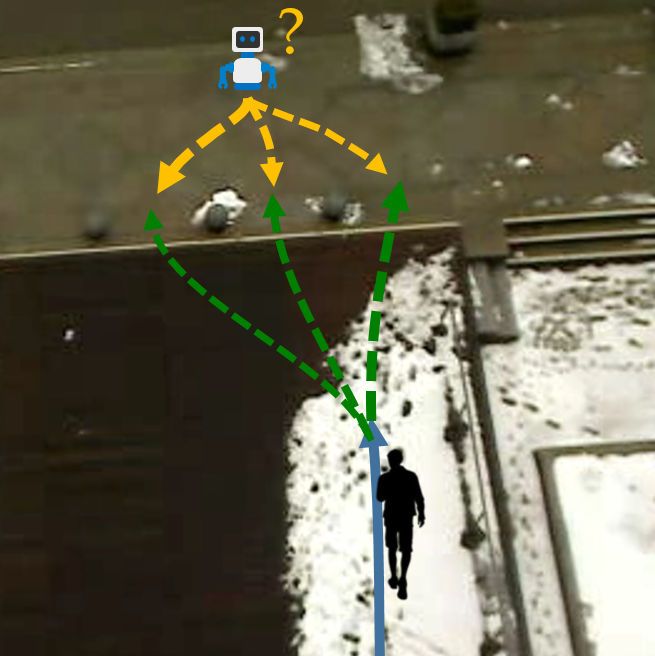
paths with the top probabilities in practical terms to reduce
the test time.
In the following sections, we will introduce how we clus-
ter and train the classification network gM (·) in Sec. 3.3. In
Sec. 3.4, we propose a novel Modality Loss to encourage
the classifier to recognize multiple reasonable futures com-
prehensively instead of just the most likely one. Finally,
we show how to synthesize one prediction result by h(·) in
Sec. 3.5.
3.3. Classification with Modality Clustering
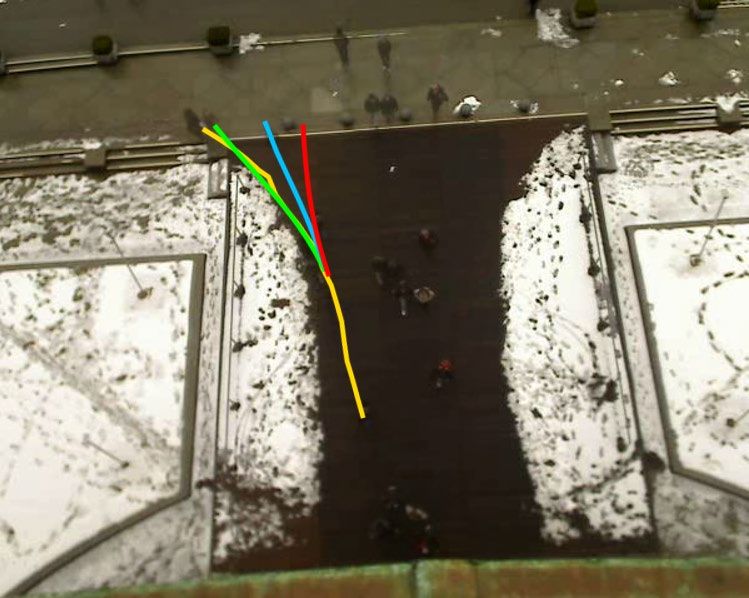
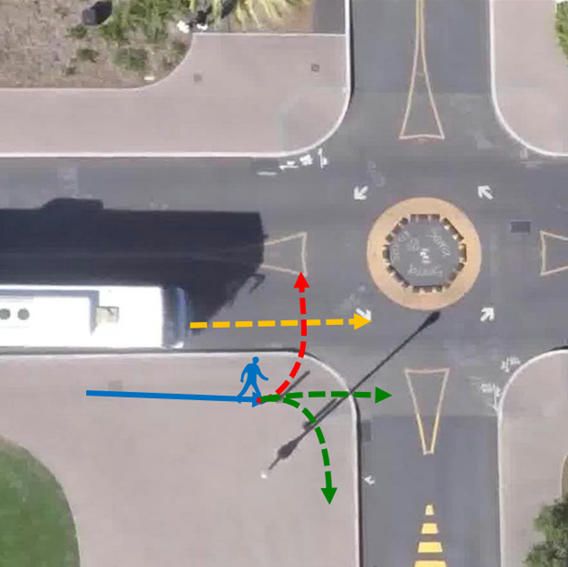
Following Eq. 2 and Eq. 3, we need to construct modality Figure 3. A schematic on how to estimate other reasonable modal-
set M and corresponding classifier gM (·). ities (in blue) for a target path (in red).
Feature Encoder. To capture better representations for our implementation, gM (·) is a three-layer MLP (Multilayer
deep clustering, classification and further synthesis proce- Perceptron) with a tanh activation. We train the classifier
dure, we first encode the historical and future trajectories by treating the cluster assignments as pseudo-labels.
for each agent. Given that a trajectory is a time series and
has a strong dependency and consistency between each time 3.4. Enhancing Diversity with Modality Loss
step according to [29], we adopt the BiLSTM architecture Samples in traditional classification tasks have only one-
as our feature encoders. class assignments (ground truth). This goes against the
Clustering. We believe that each modality of trajectory in- optimization goal of a multimodal classification task that
dicates behaviors and movements of the same kind, and in the classifier should figure out a series of futures with high
turn, we can express a modality representation M with the probabilities to happen. In this regard, we propose a sta-
average of a series of deep trajectory features, which can be tistical method to estimate reasonable and feasible pseudo
written as future modalities for a target path.
Specifically, Fig. 3 illustrates an example, where the red
i
M = AV G({[RH , RFi ]|i ∈ C}) (5) curve denotes the target path. We draw a circle o centered
on the end of its observed part with a radius r and count
where C is a cluster represented by trajectory ids. In our im-
other trajectories truncated by this circle in the entire time
plementation, we use the clustering center of C to represent
period of this scene. Then we group trajectories that have
the AV G operation, and Eq. 5 can be rewritten as
similar speeds and directions as the ground truth path. Qual-
c
M = [RH , RFc ] (6) ified paths are highlighted in blue, and can be seen as other
potential movements Y1∗ , Y2∗ , . . . , YN∗ .
c
where RH and RFc are the values of historical and future Then, the pseudo possibility of each modality is calcu-
representations in the clustering center. In this way, we cre- lated according to these potential movements by
ate a bridge between modality construction and clustering.
To generate distinct Cs, we introduce a clustering algo- |{Yi∗ |Yi∗ ∈ Mj }|
p∗j = (8)
rithm. Considering the definition of M , we use [RH i
, RFi ] N
as features for path id i and a weighted L2 distance for clus- and we define Modality Loss as
tering. Specifically, the distance is written as
1 2
LM = CrossEntropy(P, P∗ ) (9)
D = wH ||RH − RH ||2 + wF ||RF1 − RF2 ||2 (7)
where P denotes the classification result acquired from
where wH and wF represent the weight for historical repre- Eq. 3 and P∗ denotes the pseudo label acquired from Eq. 8.
sentations and future representations respectively. In this way, we can use these statistical probabilities to su-
Here we assume that the mean value and distribution of pervise the classifier, which brings great diversity to our
the training set are similar as those of the test set, which is model.
usually how it works. The modality set M we construct will
very nicely cover different kinds of future possibilities for 3.5. Prediction with Modality Synthesis
test samples, as shown in Fig. 6. So far, we have calculated each modality M and histor-
Classifier. Eq. 3 illustrates the functionality of our classi- ical representation RH for an input observed path. In this
fier. gM (·) receives the encoded feature RH of input tra- section, we will discuss how h(·) in Eq. 4 synthesizes a pre-
jectory X and outputs possibilities for each modality. In diction result for each modality.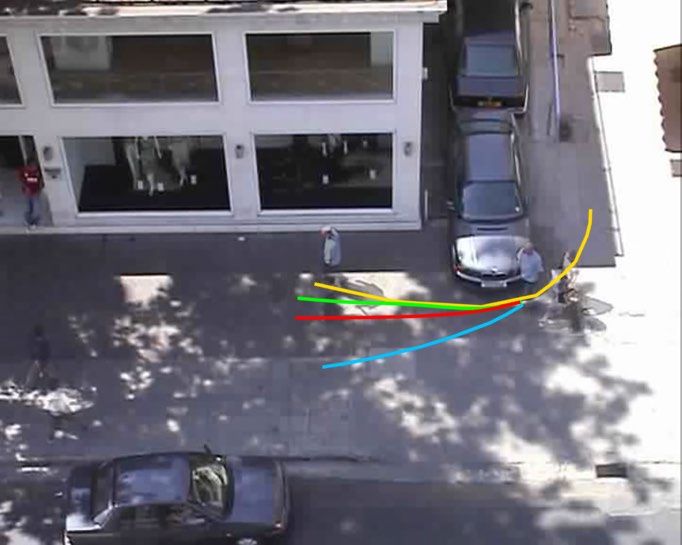
Pseudo Future Representation for Each Modality. In predicted trajectories at fine-grained level for each modal-
order to synthesize a future trajectory in line with a given ity, while the deterministic trajectories will be the same for
modality, we need a corresponding pseudo future represen- inputs classified to a same class in [3] and the prediction
tation to indicate the future trajectory propensity. We pro- space will be severely constrained.
pose a regression model to fit a pseudo future representation We only introduce historical paths as past features in this
RF∗ centered on M for given RH . paper for clarity since the highlight of this research is pre-
 A diagram of the regression is shown at the bottom of diction framework rather than ‘social or contextual infor-
 c mation’. However, it would be easy to incorporate other
Fig. 2. We first subtract RH from RH and use an MLP with
a sigmoid activation to encode the difference. After that, information into our proposed framework. Similar to Past
the encoded features are concatenated with corresponding Encoder, one can use a social/map encoder to encode these
RFc to form a new vector, which indicates the average of features and concatenate them with RH .
the future propensity as well as its bias to the input trajec-
tory. Finally, the vector is fed into a fully connected layer 4. Experiment
to extract the pseudo future representation RF∗ . Each RF∗
 4.1. Datasets
summarizes a behavior of modality M and is able to reflect
the tendency of future trajectory. Performance of our method is evaluated on popular
 For training, we only compute RF∗ of the cluster which datasets, including ETH [24]/UCY [12] Dataset and Stan-
input RH is assigned to. Corresponding RF and L2 loss are ford Drone Dataset [26]. The ETH/UCY dataset is widely
used to supervise the generation of RF∗ . used for trajectory prediction benchmark [1, 7, 17, 28],
 which consists five different sub-datasets (ETH, HOTEL,
Decoder. With historical representation RH and pseudo fu- UNIV, ZARA1 and ZARA2). The Stanford Drone Dataset
ture representation RF∗ of different modalities, we can syn- is a large-scale dataset including various agents. These tra-
thesize future trajectories using an LSTM decoder. We in- jectories are recorded by drone cameras in bird’s eye view
put h0 = [RH , RF∗ i ] and output predicted Ŷi for modality with sufficient diversity.
Mi . All modalities share the same parameters and we use In our experiments, we follow the same data prepro-
exponential L2 Loss in [29] for better performance. cessing procedure and evaluation configuration as previous
 work [35, 20]. To evaluate the accuracy of our prediction re-
3.6. Implementation Details
 sults, we use Average Displacement Error (ADE) and Final
 In our implementation, both BiLSTM encoders have a Displacement Error (FDE) as metrics. we observe historical
hidden size of 48, while the LSTM decoder has a hidden trajectories for 3.2sec (8 frames) and predict future trajecto-
size of 96. We choose the classic K-Means [19] algorithm ries for 4.8sec (12 frames) at a frame rate of 0.4. 20 samples
for clustering where the hyper-parameter K is set to 200. of the future trajectories are predicted.
For weight coefficients in Eq. 7, we let wH = wF = 0.5.
To find the qualified paths for Modality Loss as shown in
 4.2. Quantitative Evaluation
Fig. 3, we set the radius r = 1, and employ a 10% limit on
 ETH/UCY. Experimental results on ETH/UCY benchmark
speed differences ∆v and a 0.1π limit on direction differ-
 against competing methods are shown in Tab. 1, including
ences ∆θ.
 state-of-the-art STAR [35] and PECNet [20]. Note that the
 input information varies from different baselines, where P
3.7. Discussion
 denotes historical path, S denotes social information and
 Comparing with previous classification framework Mul- M denotes map information. To present the power of our
tiPath [3], our insight and approach show great differences. framework more clearly, we only use historical paths as
i) We encode deep representations for behaviors and clus- the information source. Results demonstrate that the per-
ter modalities on them. In our vision, human behaviors are formance of trajectory prediction is further elevated with
too complicated to be represented by simple coordinate se- our PCCSNet framework. We reach improvement of 19.2%
ries [3]. This deep clustering process can explore much bet- (0.05/0.26) and 20.8% (0.11/0.53) on ADE and FDE in
ter representations for modalities. Further, the idea of met- average respectively comparing with SOTA performance
ric learning is implied in this process while human behav- achieved by STAR. Notably, we achieve such improvement
ior is rather complex to be clustered by manually designed by using historical paths as the only input while STAR uses
distance [3]. ii) Our classifier does not require extra scene both paths and social information.
raster as input. Actually, our framework can work well with Our method fails comparing with PECNet on FDE on
only historical paths as input and thus our approach has a some subsets. We attribute this to the major differences
strong ability to be generalized into most prediction cases. that our method is ADE-prioritized while PECNet is FDE-
iii) A synthesis step is proposed to provide deterministically prioritized, which means that PECNet has a tendency to
Method Input ETH HOTEL UNIV ZARA1 ZARA2 AVG
 SGAN [7] P+S 0.81 / 1.52 0.72 / 1.61 0.60 / 1.26 0.34 / 0.69 0.42 / 0.84 0.58 /1.18
 Sophie [28] P+S+M 0.70 / 1.43 0.76 / 1.67 0.54 / 1.24 0.30 / 0.63 0.38 / 0.78 0.54 / 1.15
 Next [17] P+M 0.73 / 1.65 0.30 / 0.59 0.60 / 1.27 0.38 / 0.81 0.31 / 0.68 0.46 / 1.00
 Social STGCNN [22] P+S 0.64 / 1.11 0.49 / 0.85 0.44 / 0.79 0.34 / 0.53 0.30 / 0.48 0.44 / 0.75
 PECNet [20] P+S 0.54 / 0.87 0.18 / 0.24 0.35 / 0.60 0.22 / 0.39 0.17 / 0.30 0.29 / 0.48
 STAR [35] P+S 0.36 / 0.65 0.17 / 0.36 0.31 / 0.62 0.26 / 0.55 0.22 / 0.46 0.26 / 0.53
 PCCSNet P 0.28 / 0.54 0.11 / 0.19 0.29 / 0.60 0.21 / 0.44 0.15 / 0.34 0.21 / 0.42
Table 1. Comparison on ETH and UCY dataset for Tobs = 8 and Tpred = 12 (ADE/FDE), including SOTA STAR and PECNet. P denotes
historical path, S denotes social information and M denotes map information. [17] also uses pose information from AlphaPose [5, 14]. It
is worth mentioning that our approach outperforms other methods in average without using social and map information.

 Method SGAN [7] Sophie [28] PECNet [20] PCCSNet MultiPath is different from commonly used 8 [28, 20]. Our
 Input P+S P+S P+S P
 ADE 27.23 16.27 9.96 8.62
 method greatly outperforms MultiPath.
 FDE 41.44 29.38 15.88 16.16 Clustering on Deep Features. Our clustering process is ap-
Table 2. Comparison with baseline methods on SDD for Tobs = 8 plied on deep features to explore better representations for
and Tpred = 12, including SOTA PECNet. different modalities. Comparison between k-means on tra-
 jectory coordinates (KM w/o deep) and deep features (KM)
 Method minADE1 minFDE1 minADE5 in Tab. 4 proves that our deep clustering process can capture
 MultiPath [3] 28.32 58.38 17.51 modality representations effectively.
 PCCSNet 18.14 36.32 12.54
 Clustering Algorithm. We compare the performance of
Table 3. Comparison with MultiPath on SDD for Tobs = 5 and three common clustering algorithms when they are used for
Tpred = 12. minADEk and minFDEk measures the displacement constructing M in Eq. 2, including K-means (KM), hierar-
error against the closest trajectory in top k samples. chical agglomerative clustering (HAC) and Gaussian mix-
 ture model (GMM). Results in Tab. 4 show that the simple
 Method KM w/o deep KM HAC GMM
 K-means algorithm exhibits a huge advantage in speed with
 ADE 0.24 0.21 0.21 0.21
 no decline in accuracy. Therefore, we use K-means as the
 FDE 0.45 0.42 0.43 0.42
 clustering algorithm in our implementation.
 Time/min 0.6 0.7 18 90
 K in K-means. We also study the effect of different K in
Table 4. Comparison between different clustering methods on
ETH/UCY Dataset. Results are the average of five sub-datasets.
 K-means algorithm on the results, shown in Tab. 5. A larger
 K can let each modality M reveal more fine-grained rep-
 K 100 200 500 1000 resentations, yet it may cause a reduction in classification
 ADE 0.22 0.21 0.21 0.22 accuracy. We assign 200 for K in our experiments for bet-
 FDE 0.44 0.42 0.43 0.45 ter overall performance.
Table 5. Comparison between different parameter K in K-means Weights for Clustering Distance. For clustering distance
on ETH/UCY Dataset. Results are the average of five sub-datasets. as described in Eq. 7, both historical and future represen-
 tations are taken into consideration. We add weights wH
achieve a lower FDE than a lower ADE. Further, the social and wF to balance them for clustering. According to exper-
information is absent in our method. iments in Tab. 6, a proper weighting ratio near 1 : 1 will
SDD. We also report the prediction performance on SDD get much better performance. If the weight of future repre-
dataset in Tab. 2. Comparing with the SOTA framework sentation grows, the performance drops a little. And if the
PECNet, we achieve remarkable improvement of 13.5% weight of historical representation grows, the performance
(1.34/9.96) increase on ADE. There is a little FDE decline drops a lot. This reveals two facts: 1) Future features take
of 1.8% (0.28/15.88). Considering the differences we have a leading role in modality clustering. 2) Historical features
discussed above and the trade-off between huge ADE im- play a supporting role to differentiate confusing situations
provement and a minor FDE decline, we believe that our for better clustering results.
prediction results are promising. Analysis for Modality Loss. We introduce Modality Loss
 in our framework to enhance the diversity and Tab. 7 shows
4.3. Analysis
 a comprehensive analysis. After applying Modality Loss to
Comparing with MultiPath [3]. We compare with Mul- enhance the diversity, our performance is further improved.
tiPath in Tab. 3. Note that the frames of observation 5 in Some hyper-parameters will decide the scale of restrictions
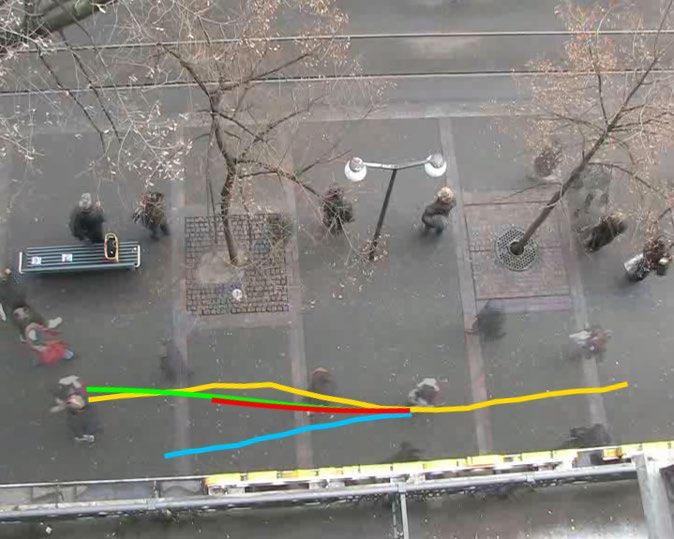
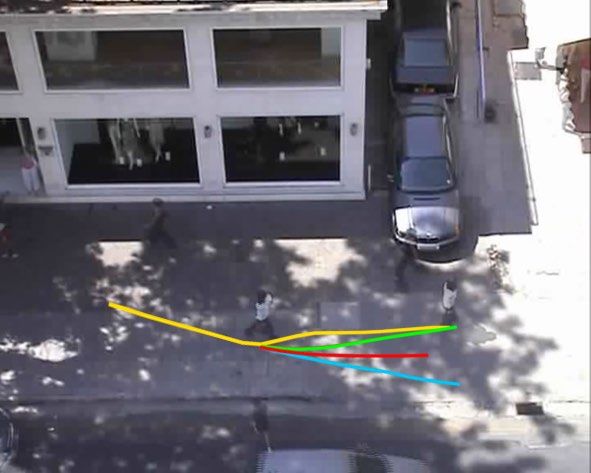
Ground Truth Ours STAR SGAN

 (a) (b) (c)

 (d) (e) (f)
Figure 4. Accuracy analysis of PCCSNet where yellow lines indicate ground truth paths and our predicted results are in green. Predictions
of two comparison models, STAR and SGAN, are denoted as blue and red. Examples are from different scenes including ZARA (a-c),
HOTEL (d,e) and ETH (f).

 (WH : WF ) 1:3 1:2 1:1 2:1 3:1 thresholds for speed ∆v and angle ∆θ. When these pa-
 ADE 0.22 0.21 0.21 0.23 0.24 rameters vary, the performance fluctuates, where speed con-
 FDE 0.43 0.42 0.42 0.47 0.49 straint is more sensitive than others.
Table 6. Comparison between different weight configurations for Contribution of Modality Synthesis. Modality synthesis
clustering distance in Eq. 7 on ETH/UCY Dataset. The results are is proposed to optimize predictions at fine-grained level.
the average of five sub-datasets. Tab. 8 shows the synthesis process brings huge improve-
 ment in accuracy.
 r/m ∆v ∆θ/π ADE FDE
 0 0 0 0.221 0.443 4.4. Qualitative Evaluation
 1 10% 0.1 0.208 0.422 Accuracy Analysis. We compare PCCSNet with other ap-
 0.5 10% 0.1 0.212 0.426 proaches on various challenging cases including turning
 2 10% 0.1 0.215 0.432 and acceleration. Predicted results of the best modality are
 1 5% 0.1 0.213 0.426 shown with different colors in Fig. 4, which illustrate that
 1 20% 0.1 0.216 0.438 our model can capture much more accurate future modali-
 1 10% 0.05 0.212 0.427 ties in terms of both speed and direction. Figure (c) and (f)
 1 10% 0.2 0.213 0.427 are two typical cases of turning. Our model predicts more
Table 7. Sensitive analysis on differet hyper-parameter configura- accurate angles with a proper speed. STAR gives a much
tions for Modality Loss on ETH/UCY Dataset. The results are the smaller angle in both cases while SGAN predicts a wrong
average of five sub-datasets. turning direction in (f). Another challenging case in figure
 (e) shows that even though PCCSNet ignores a jitter in the
 Method w/o synthesis PCCSNet ∆ future, the predictions of speed, direction and destination
 ADE 0.23 0.21 8.7% are remarkable. Both STAR and SGAN fail to estimate nei-
 FDE 0.45 0.42 6.7% ther the speed nor the destination.
Table 8. Contribution of modality synthesis on ETH/UCY. Results Multimodality with Probability. Fig. 5 demonstrates the
are the average of five sub-datasets. probabilistic property of our proposed framework. In these
 three specific scenes, not only can our model give accurate
of similar movements, including the radius of circle r, and predictions, probabilities of reasonable futures also tend to
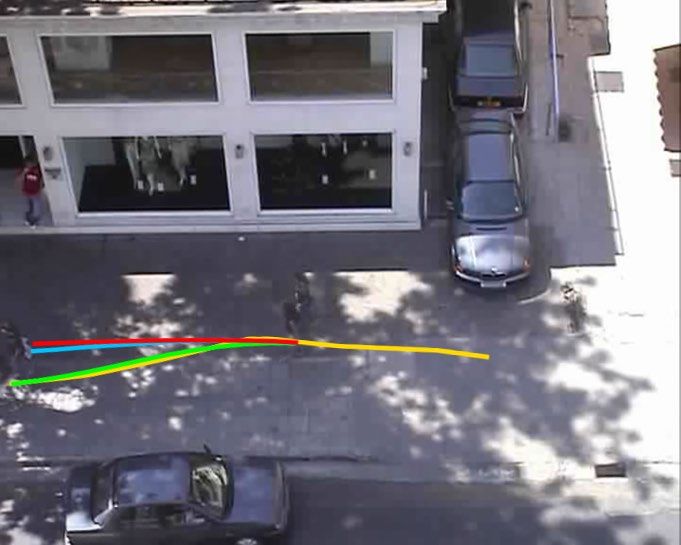
Ground Truth PECNet Ours

 PECNet

 = .
 = .
 = . %

 Ours = .
 = . %
 = . % = .
 = . = .

 = .

 (a) (b) (c)

Figure 5. Illustration of our probabilistic multimodal predictions where yellow curves indicate ground truth paths and our predicted results
are in red (darker refers to higher probability). PECNet is used for comparison and its results are denoted as the same dark red since each
result it outputs has equal probability. The probabilities of our method are marked out while they take the same value of 5% for PECNet
(1/20). We only visualize some representative trajectories for a clear view.

 remains slow whereas the bottom one begins to accelerate.
 In pair (b), the past trajectories are still linear but faster. We
 show an 180◦ turn and a straight path that may happen in
 the future. Pair (c) shows curved past trajectories unlike
 former ones. Corresponding future modalities are right and
 left turning. These cases give a strong proof that our clus-
 tering algorithm is sensitive enough to capture differences
 between potential modalities. Note that although the clus-
 tering is performed in a high dimensional space following
 (a) (b) (c) Eq. 2, the visualization is in 2D space for readability.

Figure 6. Visualization of clusters. Past trajectories are in yellow
and future ones are in various colors for a clear view. Each column
refers to a pair with similar past trajectories and different future 5. Conclusion
modalities. Values of x,y-axis are coordinates in meters.
 In this paper, we formulate the multimodal prediction
 framework into three steps of modality clustering, classifi-
be much higher than average. Therefore, our model is less
 cation and synthesis to address major weaknesses in previ-
likely to predict trajectories that are improbable while main-
 ous works and present a brand-new pipeline PCCSNet to
taining the accuracy of the best-match. However, each pre-
 solve it. Considering that the future are usually central-
diction sampled by a generative model can only be inter-
 ized around several different behaviors, we first cluster en-
preted as a average probability of k1 when taking k predic-
 coded historical and future representations to identify po-
tions. Thus, they lose probabilistic information for each
 tential behavior modalities. A classifier then is trained to
modality, which is important to the following decision-
 figure out the probability of occurrence for each modality
making process.
 given a historical path with a novel Modality Loss. Fur-
Clustering Analysis. To illustrate the effectiveness of the ther, a modality synthesis mechanism is proposed to get
clustering algorithm in exploring different potential modal- fine-grained prediction results deterministically. Exhaustive
ities, we visualize samples in some different clusters in experiments demonstrate the superiority of our elaborately
Fig. 6. Pair (a) indicates two types of possible futures that designed framework in accuracy, diversity and reasonable-
both come after a slow, linear past trajectory. The top one ness, even without introducing social and map information.
References the IEEE/CVF Conference on Computer Vision and Pattern
 Recognition, pages 10863–10872, 2019.
 [1] Alexandre Alahi, Kratarth Goel, Vignesh Ramanathan, [15] Yong-Lu Li, Liang Xu, Xinpeng Liu, Xijie Huang, Yue Xu,
 Alexandre Robicquet, Li Fei-Fei, and Silvio Savarese. So- Shiyi Wang, Hao-Shu Fang, Ze Ma, Mingyang Chen, and
 cial lstm: Human trajectory prediction in crowded spaces. In Cewu Lu. Pastanet: Toward human activity knowledge en-
 Proceedings of the IEEE conference on computer vision and gine. In CVPR, 2020.
 pattern recognition, pages 961–971, 2016. [16] Junwei Liang, Lu Jiang, Kevin Murphy, Ting Yu, and
 [2] Yoshua Bengio, Grégoire Mesnil, Yann Dauphin, and Salah Alexander Hauptmann. The garden of forking paths: To-
 Rifai. Better mixing via deep representations. In Inter- wards multi-future trajectory prediction. In Proceedings of
 national conference on machine learning, pages 552–560, the IEEE/CVF Conference on Computer Vision and Pattern
 2013. Recognition, pages 10508–10518, 2020.
 [3] Yuning Chai, Benjamin Sapp, Mayank Bansal, and Dragomir [17] Junwei Liang, Lu Jiang, Juan Carlos Niebles, Alexander G
 Anguelov. Multipath: Multiple probabilistic anchor tra- Hauptmann, and Li Fei-Fei. Peeking into the future: Predict-
 jectory hypotheses for behavior prediction. arXiv preprint ing future person activities and locations in videos. In Pro-
 arXiv:1910.05449, 2019. ceedings of the IEEE Conference on Computer Vision and
 [4] Chiho Choi and Behzad Dariush. Looking to relations for Pattern Recognition, pages 5725–5734, 2019.
 future trajectory forecast. In The IEEE International Confer- [18] Yuexin Ma, Xinge Zhu, Sibo Zhang, Ruigang Yang, Wen-
 ence on Computer Vision (ICCV), October 2019. ping Wang, and Dinesh Manocha. Trafficpredict: Trajectory
 [5] Hao-Shu Fang, Shuqin Xie, Yu-Wing Tai, and Cewu Lu. prediction for heterogeneous traffic-agents. In Proceedings
 Rmpe: Regional multi-person pose estimation. In Proceed- of the AAAI Conference on Artificial Intelligence, volume 33,
 ings of the IEEE International Conference on Computer Vi- pages 6120–6127, 2019.
 sion, pages 2334–2343, 2017. [19] James MacQueen et al. Some methods for classification
 [6] Liangji Fang, Qinhong Jiang, Jianping Shi, and Bolei Zhou. and analysis of multivariate observations. In Proceedings of
 Tpnet: Trajectory proposal network for motion prediction. the fifth Berkeley symposium on mathematical statistics and
 In Proceedings of the IEEE/CVF Conference on Computer probability, volume 1, pages 281–297. Oakland, CA, USA,
 Vision and Pattern Recognition, pages 6797–6806, 2020. 1967.
 [7] Agrim Gupta, Justin Johnson, Li Fei-Fei, Silvio Savarese, [20] Karttikeya Mangalam, Harshayu Girase, Shreyas Agarwal,
 and Alexandre Alahi. Social gan: Socially acceptable tra- Kuan-Hui Lee, Ehsan Adeli, Jitendra Malik, and Adrien
 jectories with generative adversarial networks. In Proceed- Gaidon. It is not the journey but the destination: End-
 ings of the IEEE Conference on Computer Vision and Pattern point conditioned trajectory prediction. arXiv preprint
 Recognition, pages 2255–2264, 2018. arXiv:2004.02025, 2020.
 [8] Tsubasa Hirakawa, Takayoshi Yamashita, Toru Tamaki, and [21] Ramin Mehran, Alexis Oyama, and Mubarak Shah. Ab-
 Hironobu Fujiyoshi. Survey on vision-based path predic- normal crowd behavior detection using social force model.
 tion. In International Conference on Distributed, Ambient, In 2009 IEEE Conference on Computer Vision and Pattern
 and Pervasive Interactions, pages 48–64. Springer, 2018. Recognition, pages 935–942. IEEE, 2009.
 [22] Abduallah Mohamed, Kun Qian, Mohamed Elhoseiny, and
 [9] Boris Ivanovic and Marco Pavone. The trajectron: Proba-
 Christian Claudel. Social-stgcnn: A social spatio-temporal
 bilistic multi-agent trajectory modeling with dynamic spa-
 graph convolutional neural network for human trajectory
 tiotemporal graphs. In Proceedings of the IEEE Interna-
 prediction. In Proceedings of the IEEE/CVF Conference
 tional Conference on Computer Vision, pages 2375–2384,
 on Computer Vision and Pattern Recognition, pages 14424–
 2019.
 14432, 2020.
[10] James Joyce. Bayes’ theorem. 2003.
 [23] Bo Pang, Yizhuo Li, Yifan Zhang, Muchen Li, and Cewu Lu.
[11] Kris M Kitani, Brian D Ziebart, James Andrew Bagnell, and Tubetk: Adopting tubes to track multi-object in a one-step
 Martial Hebert. Activity forecasting. In European Confer- training model. In CVPR, pages 6308–6318, 2020.
 ence on Computer Vision, pages 201–214. Springer, 2012. [24] Stefano Pellegrini, Andreas Ess, Konrad Schindler, and Luc
[12] Laura Leal-Taixé, Michele Fenzi, Alina Kuznetsova, Bodo Van Gool. You’ll never walk alone: Modeling social be-
 Rosenhahn, and Silvio Savarese. Learning an image-based havior for multi-target tracking. In 2009 IEEE 12th Inter-
 motion context for multiple people tracking. In Proceed- national Conference on Computer Vision, pages 261–268.
 ings of the IEEE Conference on Computer Vision and Pattern IEEE, 2009.
 Recognition, pages 3542–3549, 2014. [25] Tung Phan-Minh, Elena Corina Grigore, Freddy A Boulton,
[13] Namhoon Lee, Wongun Choi, Paul Vernaza, Christopher B. Oscar Beijbom, and Eric M Wolff. Covernet: Multimodal
 Choy, Philip H. S. Torr, and Manmohan Chandraker. Desire: behavior prediction using trajectory sets. In Proceedings of
 Distant future prediction in dynamic scenes with interacting the IEEE/CVF Conference on Computer Vision and Pattern
 agents. In The IEEE Conference on Computer Vision and Recognition, pages 14074–14083, 2020.
 Pattern Recognition (CVPR), July 2017. [26] Alexandre Robicquet, Amir Sadeghian, Alexandre Alahi,
[14] Jiefeng Li, Can Wang, Hao Zhu, Yihuan Mao, Hao-Shu and Silvio Savarese. Learning social etiquette: Human tra-
 Fang, and Cewu Lu. Crowdpose: Efficient crowded scenes jectory understanding in crowded scenes. In European con-
 pose estimation and a new benchmark. In Proceedings of ference on computer vision, pages 549–565. Springer, 2016.
[27] Amir Sadeghian, Alexandre Alahi, and Silvio Savarese.
 Tracking the untrackable: Learning to track multiple cues
 with long-term dependencies. In Proceedings of the IEEE
 International Conference on Computer Vision, pages 300–
 311, 2017.
[28] Amir Sadeghian, Vineet Kosaraju, Ali Sadeghian, Noriaki
 Hirose, Hamid Rezatofighi, and Silvio Savarese. Sophie:
 An attentive gan for predicting paths compliant to social and
 physical constraints. In Proceedings of the IEEE Conference
 on Computer Vision and Pattern Recognition, pages 1349–
 1358, 2019.
[29] Jianhua Sun, Qinhong Jiang, and Cewu Lu. Recursive social
 behavior graph for trajectory prediction. In Proceedings of
 the IEEE/CVF Conference on Computer Vision and Pattern
 Recognition, pages 660–669, 2020.
[30] Anirudh Vemula, Katharina Muelling, and Jean Oh. Social
 attention: Modeling attention in human crowds. In 2018
 IEEE International Conference on Robotics and Automation
 (ICRA), pages 1–7. IEEE, 2018.
[31] Hanqing Wang, Wenguan Wang, Wei Liang, Caiming Xiong,
 and Jianbing Shen. Structured scene memory for vision-
 language navigation. arXiv preprint arXiv:2103.03454,
 2021.
[32] Hanqing Wang, Wenguan Wang, Tianmin Shu, Wei Liang,
 and Jianbing Shen. Active visual information gathering for
 vision-language navigation. In European Conference on
 Computer Vision, pages 307–322. Springer, 2020.
[33] Dan Xie, Sinisa Todorovic, and Song-Chun Zhu. Inferring
 ”dark matter” and ”dark energy” from videos. In The IEEE
 International Conference on Computer Vision (ICCV), De-
 cember 2013.
[34] Kota Yamaguchi, Alexander C Berg, Luis E Ortiz, and
 Tamara L Berg. Who are you with and where are you go-
 ing? In CVPR 2011, pages 1345–1352. IEEE, 2011.
[35] Cunjun Yu, Xiao Ma, Jiawei Ren, Haiyu Zhao, and Shuai
 Yi. Spatio-temporal graph transformer networks for pedes-
 trian trajectory prediction. arXiv preprint arXiv:2005.08514,
 2020.
[36] Bolei Zhou, Xiaogang Wang, and Xiaoou Tang. Understand-
 ing collective crowd behaviors: Learning a mixture model
 of dynamic pedestrian-agents. In 2012 IEEE Conference
 on Computer Vision and Pattern Recognition, pages 2871–
 2878. IEEE, 2012.
You can also read