SNARER: New Molecular Descriptors for SNARE Proteins Classication
←
→
Page content transcription
If your browser does not render page correctly, please read the page content below
SNARER: New Molecular Descriptors for SNARE Proteins Classi cation Alessia Auriemma Citarella ( aauriemmacitarella@unisa.it ) University of Salerno Luigi Di Biasi University of Salerno Michele Risi University of Salerno Genoveffa Tortora University of Salerno Research Article Keywords: SNARE, Protein Classi cation, Machine Learning, Random Forest, AdaBoost, KNN Posted Date: July 29th, 2021 DOI: https://doi.org/10.21203/rs.3.rs-710235/v1 License: This work is licensed under a Creative Commons Attribution 4.0 International License. Read Full License
Auriemma Citarella et al.

    RESEARCH ARTICLE

SNARER: new molecular descriptors for SNARE
proteins classification
Alessia Auriemma Citarella* , Luigi Di Biasi, Michele Risi and Genoveffa Tortora
*
 Correspondence:
aauriemmacitarella@unisa.it             Abstract
Department of Computer Science,
University of Salerno, Fisciano, IT     Background: SNARE proteins play an important role in different biological
Full list of author information is      functions. This study aims to investigate the contribution of a new class of
available at the end of the article
                                        molecular descriptors (called SNARER) related to the chemical-physical
                                        properties of proteins in order to evaluate the performance of binary classifiers for
                                        SNARE proteins.
                                        Results: We constructed a SNARE proteins balanced dataset, D128, and an
                                        unbalanced one, DUNI, on which we tested and compared the performance of the
                                        new descriptors presented here in combination with the feature sets (GAAC,
                                        CTDT, CKSAAP and 188D) already present in the literature. The machine
                                        learning algorithms used were Random Forest, k-Nearest Neighbors and
                                        AdaBoost and oversampling and subsampling techniques were applied to the
                                        unbalanced dataset. The addition of the SNARER descriptors increases the
                                        precision for all considered ML algorithms. In particular, on the unbalanced DUNI
                                        dataset the accuracy increases in parallel with the increase in sensitivity while on
                                        the balanced dataset D128 the accuracy increases compared to the counterpart
                                        without the addition of SNARER descriptors, with a strong improvement in
                                        specificity. Our best result is the combination of our descriptors SNARER with
                                        CKSAAP feature on the dataset D128 with 92.3% of accuracy, 90.1% for
                                        sensitivity and 95% for specificity with the RF algorithm.
                                        Conclusions: The performed analysis has shown how the introduction of
                                        molecular descriptors linked to the chemical-physical and structural
                                        characteristics of the proteins can improve the classification performance.
                                        Additionally, it was pointed out that performance can change based on using a
                                        balanced or unbalanced dataset. The balanced nature of training can significantly
                                        improve forecast accuracy.
                                        Keywords: SNARE; Protein Classification; Machine Learning; Random Forest;
                                        AdaBoost; KNN

                                      Background
                                      SNARE (Soluble N–ethylmaleimide sensitive factor Attachment protein Receptor)
                                      is a protein superfamily involved in the molecular trafficking between the differ-
                                      ent cellular compartments [1]. This protein family includes members from yeasts to
                                      mammalian cells, evolutionarily conserved. Vesicle-mediated transport is essential
                                      for basic cellular processes, such as the secretion of proteins and hormones, the re-
                                      lease of neurotransmitters, the phagocytosis of pathogens by the immune system and
                                      the transport of molecules from one compartment of the cell to another.Vesicular
                                      transport involves membrane receptors responsible for the vescicles recognition, the
                                      activation of the membrane fusion and reorganization and the consequent release of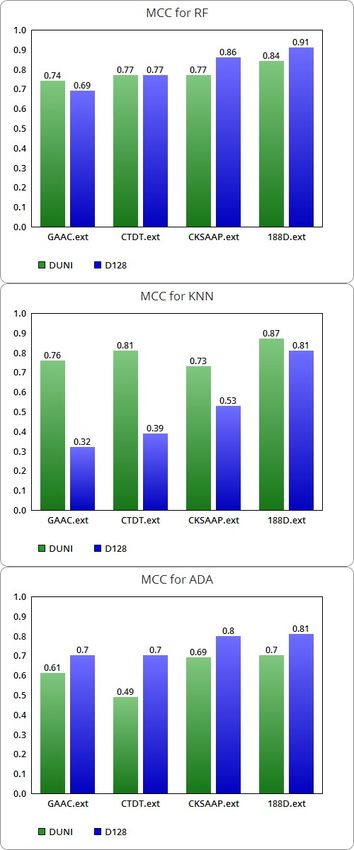
Auriemma Citarella et al.                                                                                            Page 2 of 16

                 the vesicular content in the extracellular space (exocytosis) or inside the cell (endo-
                 cytosis). Specifically, SNARE complexes mediate membrane fusion during diffusion
                 processes, providing bridging bond between SNARE proteins associated with both
                 membranes [2].
                   SNARE proteins consist of motifs of 60-70 amino acids containing hydrophobic
                 heptad repeats which form coiled-coil structures. The core of the SNARE complex
                 is represented by 4 α helix bundle, as evidenced by the available crystallographic
                 structures [3]. The center of the bundle contains 16 stacked layers which are all
                 hydrophobic, except the central layer ”0”, which is called ionic layer and which
                 contains 3 highly conserved glutamines (Q) and a conserved arginine (R) residue
                 (see Figure 1).
                   SNARE proteins were initially divided into two categories: vesicle or v-SNARE,
                 which are incorporated into the vesicle membranes, and target or t-SNARE, which
                 are associated with the target membranes. A more recent subdivision is based on
                 their structural characteristics by dividing them into R-SNARE and Q-SNARE.
                 The R-SNARE proteins contain an arginine residue (R) which contributes to the
                 formation of the complex while Q-SNARE proteins contain a glutamine residue (Q)
                 and, according to their position in the bundle of four helices, they are classified in
                 turn as Qa , Qb or Qc [4].
                   In recent years, attention to SNARE proteins has increased due to scientific studies
                 which have shown the implication of SNAREs in some neural disorders for their cru-
                 cial role in the neuronal and neurosensory release at the level of synaptic endings [5].
                 The neurotransmitters release is a temporally and spatially regulated process and
                 it occurs thousands of times per minute. In this context, SNARE complexes are
                 continuously subject to tightly regulated assembly and disassembly. Impairment
                 at any stage of this release can lead to hypo or hyperactivity of neurotransmitter
                 release causing dysfunctions which compromise the balance of synaptic commu-
                 nication. There are evidences that these substances seem to be involved in the
                 course of neurodegenerative diseases (such as Alzheimer and Parkinson), in neu-
                 rodevelopment (autism) and in psychiatric disorders (such as bipolar disorder and
                 schizophrenia as well as depression). Different studies have shown the involvement
                 of mutated or not properly regulated SNARE genes in the development of these
                 disorders [6, 7, 8, 9, 10, 11].
                   Nowadays the protein sequences collection is constantly growing. There is a need
                 to have efficient classification systems able to define the functionality of a protein

                  Figure 1 Visualization of the layers of the bundle of the fusion complex between the 4 parallel
                  α-helices of the SNARE: 7 upstream layers (layers from -1 to -7) and 8 downstream layers (layers
                  from +1 to +8) of the ionic layer (the layer 0) [4].
Auriemma Citarella et al. Page 3 of 16
based on its chemical-physical properties and to label the sequence with greater
precision. The more information we can gather about a certain protein, the better
our ability to fit it into a more complex biological framework. This is evident and
useful especially when considering a protein with an initially unknown function.
The most used approach consists in evaluating whether there are functional motifs
and domains in the protein which allow to characterize it starting from its amino
acid sequence and evaluating its belonging to a protein family in which the members
have similar three-dimensional structures, similar functions and significant sequence
similarities. Knowledge of the protein family representatives is therefore necessary to
define their role and their mechanisms in a specific physiological and pathological
biological path. High-throughput sequencing techniques generate lots of big data
belonging to different biological domains, including protein sequencing [12]. These
huge amounts of data (up to petabytes) must be computationally analyzed with ever
newer techniques for the identification of different genomic and protein regions. The
current challenge is to contribute to this post-sequencing analysis and classification
and to ensure greater precision in the available protein sequences discrimination.
The importance of the evolutionary SNAREs super-family is strictly connected to
their role in different cellular functions and different pathological conditions [13, 14],
which push researchers to deepen their recognition in the biological pathways.
Related Works
Since SNARE proteins are involved in numerous biological processes, studies have
slightly increased in recent decades in order to identify and classify these proteins
but the papers dealing with this topic are still few. In the literature there are
documents that are based on different techniques, ranging from statistical models
to the use of convolutional neural networks.
Kloepper et al. [15] have implemented a web-based interface which allows the
new sequences submission to the Hidden Markov Models (HMM) for the four main
groups of the SNARE family, in order to classify SNARE proteins based on sequence
alignment and reconstruction of the phylogenetic tree. For their study, a set of ∼150
SNARE proteins is used in conjunction with the highly conserved motif which is
the sequence pattern signature representing the family of SNARE proteins. For
SNARE proteins, this motif is an extended segment arranged in heptad repeats, a
structural motif consisting of a seven-amino-acid repeating pattern. The extraction
of HMM profiles, which allow to identify evolutionary changes in a set of correlated
sequences, returns information on the occupancy and position-specific frequency of
each amino acid in the alignment. Using this method, the authors are able to obtain
a classification accuracy of at least 95% for nineteen of the twenty HMM profiles
generated and to perform a cluster analysis based on functional subgroups.
Nguyen et al. [16] have disclosed a model with two-dimensional convolutional
network and position-specific scoring matrix profiles for the SNARE proteins iden-
tification.The authors used multiple hidden layers for their models, in particular 2D
sub-layers such as zero padding, convolutional, max pooling and fully-connected lay-
ers with different number of filters. Their model achieves a sensitivity of 76.6%, an
accuracy of 89.7% and a specificity of 93.5%.
More recently, in 2020, Guilin Li [17] has proposed an hybrid model which com-
bines the random forest algorithm with the oversampling filter and 188D featureAuriemma Citarella et al. Page 4 of 16
extraction method. His work proposes different combinations of feature extraction
methods, filtering methods and classification algorithms such as KNN, RF and Ad-
aBoost for the classification of SNARE proteins. Since those results are shown only
graphically, it is not possible to have a clear comparison with our results.
Methods
Dataset preparation
We have constructed two datasets, respectively named DUNI and D128. Both
datasets were used for the evaluation of each classifier’s robustness in unbalanced
and balanced training environment, in order to avoid learning bias into classification
training. In both datasets, SNARE proteins were downloaded from UNIPROT[1] .
For this purpose, we selected all the proteins with molecular function “SNAP re-
ceptor activity”, identified with the unique GENE Ontology [18] alphanumeric code
GO: 0005484. The dataset DUNI consists of 276 SNAREs and 806 non-SNAREs. On
this unbalanced dataset, we applied the subsampling and ovesampling techniques
used in [17]. The balanced dataset D128 is composed of 64 SNARE from UNIPROT
and 64 non-SNARE protein sequences downloaded from the PDB database[2] .
In order to create a balanced and non-redundant dataset and improve the dataset
quality, all SNARE protein sequences in FASTA format have been processed with
the CD-HIT (Cluster Database at High Identity with Tolerance)[3] program which
returns a set of non-redundant representative sequences in output. CD-HIT uses
an incremental clustering algorithm. In the first analysis, it sorts the sequences in
length descending order and creates the first cluster in which the longest sequence
is the representative one. Then the sequences are compared with the clusters rep-
resentatives. If the similarity with a representative is above a certain threshold, the
sequence will be grouped in that cluster. Alternatively, a new cluster is created with
that sequence as the representative [19]. The similarity threshold chosen was 25%.
This step is very important, since it allows the removal of sequences which exceed
the similarity threshold and that could invalidate the analysis causing unwanted
bias. Sequence similarity is measured by the similar residues percentage between
two sequences. The lower the sequence similarity, the greater the likelihood of having
representative proteins in the dataset which consequently show no redundancy [20].
Feature extraction methods
In order to analyze the data deriving from protein sequences with ML techniques,
a numerical representation is required for each amino acid in the protein. For this
reason, a series of numerical parameters are often used which act as chemical-
physical and structural descriptors of proteins. The combination of a different set of
carefully chosen descriptors increases classification efficiency and allows predicting
functional protein families [21].
So there are some feature extraction methods commonly used in machine learning.
Identifying the right features for machine learning-based protein classification is one
of the open issues in this field. The right features combination is important to ensure
greater classifier model accuracy [22].
[1]
https://www.uniprot.org/
[2]
https://www.rcsb.org/
[3]
http://weizhongli-lab.org/cd-hit/Auriemma Citarella et al. Page 5 of 16
In the literature, over the years, many indices and features of amino acids have
been identified for classification methods, such as amino acid composition (AAC),
auto-correlation functions [23] or pseudo amino acid composition (PseAAC) [24].
We chose the following four descriptors to compare our SNARER descriptors with
those currently used in the SNARE proteins classification.
• GAAC (Grouped amino acid composition) groups the 20 amino acids into
five groups based on their chemical-physical properties and calculates the
frequency for each of the five groups in a protein sequence. Specifically, the
five groups are the following: positive charge (K, R, H), negative charge (D,
E), aromatic group (F, Y, W), aliphatic group (A, G, I, L, M, V) and uncharge
(C, N, P, Q, S, T).
• CTDT (Composition/Transition/Distribution) represents the amino acid com-
position patterns distribution of a specific chemical-physical or structural
property in the protein sequence. The final T represents the transition be-
tween three types of patterns (neutral group, hydrophobic group and polar
group) of which the percentage of occurrence frequency is calculated [25].
• CKSAAP are sequence-based features which, given a sequence, count all ad-
jacent amino acid pairs, considering k-spaced amino acid pairs. Since there
are 20 amino acids, for each value of k (from 0 to 5) there are 400 possible
pairs of amino acids, for a total of 2400 features [26].
• 188D features constitute a features vector of which the first 20 represent the
frequencies of each amino acid while eight types of chemical-physical proper-
ties (such as hydrophobicity, polarizability, polarity, surface tension, etc) allow
us to calculate the remaining 168 features. In fact, for each type of property
21 features are extracted [27].
For our purpose, we have selected 24 descriptors, 19 of which come from AAindex,
i.e., the Amino Acid index database [28], on the basis of the chemical-physical,
electrical and energy charge characteristics of the SNARE proteins. They are listed
in Table 1. The others (i.e., Steric parameter, polarizability, Volume, Isoelectric
point, Helix probability, Sheet probability and Hydrophobicity) are the amino acid
parameter sets defined by Fauchere et al. [29].
Classification algorithms
Following [17], given the high reported performances, we used the same three clas-
sification algorithms in order to evaluate how accuracy varies with the SNARER
descriptors utilization. Thus, we have compared three different ML algorithms: Ad-
aBoost (ADA) K-Nearest Neighbor classifier (KNN) and Random Forest (RF).
• AdaBoost is a machine learning meta-algorithm used in binary classification.
AdaBoost is an adaptive algorithm which generates a model that is overall
better than the single weak classifiers, adapting to the weak hypothesis accu-
racy and generating one weighted majority hypothesis in which the weight of
each weak hypothesis is a function dependent of its accuracy. At each itera-
tion, a new weak classifier is sequentially added which corrects its predecessor
until a final hypothesis with a low relative error is found [30].
• KNN is a supervised learning algorithm used for predictive classification and
regression problems. The basis of the operation of this algorithm is to classifyAuriemma Citarella et al. Page 6 of 16
Table 1 The SNARER descriptors.
Code Description Source
ARGP820102 Signal sequence helical potential%
CHAM830101 The Chou-Fasman parameter of the coil conformation
CHAM830107 A parameter of charge transfer capability
CHAM830108 A parameter of charge transfer donor capability
CHOP780204 Normalized frequency of N-terminal helix
CHOP780205 Normalized frequency of C-terminal helix
EISD860101 Solvation free energy
FAUJ880108 Localized electrical effect AAindex
FAUJ880111 Positive charge
FAUJ880112 Negative charge
GUYH850101 Partition energy
JANJ780101 Average accessible surface area
KRIW790101 Side chain interaction parameter
ZIMJ680102 Bulkiness
ONEK900102 Helix formation parameters (delta delta G)
Steric parameter
Polarizability
Volume
Isoelectric point Fauchere et al. [29]
Helix probability
Sheet probability
Hydrophobicity
an object based on the similarity between the data, generally calculated by
means of the Euclidean distance. In this way the space is partitioned into
regions according to the learning objects similarity. This algorithm identifies
a collection of k objects in the training set that are the most similar to the test
object. So, a parameter k, chosen arbitrarily, allows us to identify the number
of nearest neighbors, considering the k minimum distances. The prevalence of
a certain class in this neighborhood becomes a forecast in order to assign a
label to the object [31].
• RF is a supervised learning algorithm that combines many decision trees into
one model by aggregation through bagging. The final result of the RF is
represented by the class returned by the largest number of decision trees. In
particular, the random forest algorithm learns from a random sample of data
and trains on random characteristics subsets by splitting the nodes in each
tree [32].
Training and validation sessions
All training sessions were conducted with Weka ML Platform (Waikato Environ-
ment for Knowledge Analysis), a software environment written in Java which allows
the application of machine learning and data mining algorithms [33]. In order to
speed-up analysis, an ad-hoc grid, based on the map/reduce paradigm, were used in
order to distribute the work across multiple slaves [34]. Both data sets were used as
the input for the training step for AdaBoost, KNN e RF classifiers. There were only
two possible output classes: SNARE/ NON SNARE. Then, for each training session,
we used the following cross-validation values: the range between 10 to 100 for k-fold
and between 20 to 80% for hold out. Moreover, in addition to other parameters con-
figured as in [17], we set k = 1 and Euclidean distance for the distanceFunction
of KNN; for the AdaBoost algorithm, default values are weightThreshold = 100
and numIterations = 10, whilst for RF numIterations = 100.
The complete working set was composed of four logical parts: i) DUNI non-
filtered; ii) DUNI oversampled; iii) DUNI subsampled; iv) D128 non-filtered. ForAuriemma Citarella et al. Page 7 of 16
each training session, we generated 10 k-fold variants and 7 hold out variants. Then,
for each variant we computed 100 training sessions of each of the three classifiers
for each of the four descriptors. Thus, we distributed up to 836.000 training sessions
among the distributed computing environment.
Performance measurement
We evaluated the ML models (Random Forest, AdaBoost and KNN) on the un-
balanced dataset DUNI and on the balanced dataset D128. In order to estimate
the prediction performance of the three ML algorithms, accuracy (ACC), sensitiv-
ity (SN) and specificity (SP) were used. The chosen metrics are described in the
equations below:
TP + TN
Accuracy = (1)
TN + FP + FN + TP
TP
Sensitivity = (2)
TP + FN
TN
Specif icity = (3)
TN + FP
where TP, TN, FP and FN represent the number of true positives, true negatives,
false positives and false negatives, respectively. Sensitivity is the percentage of pos-
itive entities correctly identified. Specificity measures the proportion of negative
entities that are correctly identified.
In a biological sense, having a TP in our experiment means finding that a protein
cataloged as a SNARE is recognized by the classifier as a SNARE.
The feature extraction methods were initially evaluated separately (GAAC, CK-
SAAP, CTDT and 188D) on the datasets D128 and DUNI, and subsequently these
methods were extended with the SNARER descriptors addition disclosed in this
work, here identified as extended classes ”ext”.
Results and Discussion
We used the SNARER descriptors and the three chosen ML algorithms on the
unbalanced dataset DUNI and on the balanced dataset D128.
We have first considered four feature sets (GAAC, CTDT, CSKAAP and 188D)
separately and then each one in combination with the SNARER descriptors class,
identified with “.ext”. The classification performances were evaluated with three
metrics: average accuracy (ACC), average sensibility (SN) and average speci-
ficity (SP).
Results on the unbalanced dataset DUNI
Below, we have reported the experimental results conducted on the DUNI dataset.
Related to the four protein feature extraction methods GAAC, CTDT, CKSAAP
and 188D, the average ACCs for the ML algorithms are included in a range betweenAuriemma Citarella et al. Page 8 of 16
Table 2 Performance of average ACC on the DUNI dataset.
Accuracy
RF KNN ADA
GAAC 76.1% 85.1% 77.9%
GAAC.ext 90.4% 91% 86.1%
CTDT 76.1% 83.1% 76.7%
CTDT.ext 91.5% 92.6% 81.6%
CKSAAP 91.1% 90.04% 83.7%
CKSAAP.ext 91.7% 90.02% 87.4%
188D 93.9% 94.8% 88.1%
188D.ext 94.1% 94.9% 88.7%
76% and 94.9%. In Figure 2, histograms are used for the graphical comparison of
the three ML techniques.
As shown in Table 2, the introduction of the SNARER class brings a strong im-
provement in combination with all the considered protein feature extraction meth-
ods. Overall, the best average accuracy is achieved with the KNN model and with
the 188D feature set and the SNARER class combination. This combined model
achieves also the best average SP while the best average SN is obtained with the
RF model trained using both GAAC and CTDT features separately (see Table 3).
For RF, SN decreases imperceptibly in the extended classes with the new de-
scriptors, remaining unchanged for the CKSAAP method. In contrast, for RF, SP
increases with the extended classes, notably especially for the GAAC and CTDT
extraction methods.
Figure 2 Comparison between GAAC, CTDT, CKSAAP and 188 D ACC with related extended
classes with SNARER (on DUNI dataset).Auriemma Citarella et al. Page 9 of 16
Table 3 Performance for average SN and SP on the DUNI dataset.
Sensitivity Specificity
RF KNN ADA RF KNN ADA
GAAC 99.8% 90.3% 83.6% 7% 7% 61%
GAAC.ext 97.2% 94.5% 94.8% 70.7% 80.6% 60.6%
CTDT 99.8% 89.1% 83.3% 7.1% 65.6% 57.6%
CTDT.ext 96.6% 94.6% 91.1% 76.4% 87% 54%
CKSAAP 97.8% 98% 89.9% 71.7% 66.7% 65.5%
CKSAAP.ext 97.8% 98% 92% 74% 66.7% 74%
188D 97% 96.6% 92% 85% 89.5% 76.7%
188D.ext 96.8% 96.5% 92.4% 86.3% 90.1% 78%
The SN of KNN increases significantly in the extended classes referred to GAAC
and CTDT and remains substantially unchanged for CKSAAP and 188D. The same
trend is also shown for the SP of KNN, with a slight improvement of the extended
188D class. For the AdaBoost algorithm, we observe an increase in SN, mostly for
the extended GAAC and CTDT classes, which however show a decrease in SP. The
SP ADA, instead, increases for the extended classes CKSAAP and 188D. Overall,
on the unbalanced dataset the use of extended classes with our SNARER descriptors
results in an improvement in accuracy for the GAAC, CTDT, CKSAAP and 188D
classes of all three ML models, except for KNN trained with CKSAAP. All selected
ML algorithms achieve SN greater than 83%, with the best SN of 99.8% RF achieved
by GAAC and CTDT without extension.
By introducing the SNARER class for all four feature sets, the SN settles in a
range between 91.1% of the ADA algorithm with the CTDT class and 98% of the
KNN algorithm with the extended CKSAAP class. Regarding the SP, without the
SNARER’s descriptor extension, the range extends from a minimum of 7% of RF
and KNN algorithms for the GAAC class to a maximum of 89.5% of KNN trained
with the 188D feature set. With the SNARER class addition, an SN of 54% of
ADA with CTDT feature set is obtained at a maximum of 90.1% of KNN trained
on the dataset with 188D feature set. More specifically, the KNN model using the
188D extended class with SNARER descriptors, achieves better performance in all
metrics except for SN, where the RF model trained with the GAAC features obtains
the highest value.
In conclusion, on the unbalanced DUNI dataset, the new SNARER descriptors
class guarantees an improvement in terms of ACC in combination with all four
tested features sets and a clear improvement of SN and SP of some ML tested
algorithms.
Results on the unbalanced dataset DUNI with oversampling and with subsampling
Because the dataset DUNI is unbalanced, we have adopted subsampling and over-
sampling techniques.
With the oversampling technique on the DUNI dataset, the SNARER class pro-
duces a strong improvement in accuracy, more for the extended GAAC and CTDT
classes for the three ML models RF, KNN and ADA, while the contribution to the
CKSAPP and 188D feature sets remains substantially unchanged (as shown in Ta-
ble 4). The same behavior is common to the average SN and average SP calculated
for RF, KNN and ADA (see Table 5). Applying the subsampling technique to the
DUNI dataset, we observe the same trend for SN but with a slight decrease, aroundAuriemma Citarella et al. Page 10 of 16
Table 4 Performance of the average ACC on the DUNI dataset with oversampling and subsampling.
Oversampling Subsampling
RF KNN ADA RF KNN ADA
GAAC 94.7% 96.3% 73.12% 75.2% 79.2% 72.6%
GAAC.ext 98.03% 98.44% 85.02% 91.8% 86.4% 82.6%
CTDT 93.9% 96.1% 70.4% 74.6% 78.1% 71.7%
CTDT.ext 98% 98% 86.3% 90.6% 89.7% 86.4%
CKSAAP 99.07% 98.67% 84% 93.1% 84.4% 83.5%
CKSAAP.ext 99.01% 98.6% 89.1% 79% 84.2% 87.3%
188D 98.5% 98.90% 89.5% 93.1% 95% 86.6%
188D.ext 98.5% 98.95% 89.6% 93.5% 94% 89.3%
Table 5 Performance for average SN and SP on the DUNI dataset with oversampling.
Sensitivity Specificity
RF KNN ADA RF KNN ADA
GAAC 91.9% 95% 74.9% 97.5% 97.6% 71.3%
GAAC.ext 96.6% 97.8% 88.4% 99.4% 99.1% 81.6%
CTDT 88.9% 94% 68.8 98.8% 98.2% 72%
CTDT.ext 96.4% 96.9% 78.4% 99.5% 99.2% 94.3%
CKSAAP 99% 99.2% 80.8% 99.2% 98.2% 87.2%
CKSAAP.ext 98.7% 99.1% 86.2% 99.3% 98.2% 92%
188D 97.5% 98.3% 90.2% 99.7% 99.5% 88.8%
188D.ext 97.7% 98.3% 89.4% 99.3% 99.7% 89.9%
Table 6 Performance for average SN and SP on the DUNI dataset with subsampling.
Sensitivity Specificity
RF KNN ADA RF KNN ADA
GAAC 75.7% 76.1% 73.6% 74.6% 82.2% 71.7%
GAAC.ext 88.8% 85.5% 80.8% 94.9% 87.3% 84.4%
CTDT 78.3% 76.4% 73.9% 71% 79.7% 69.6%
CTDT.ext 86.6% 88.4% 81.9% 94.6% 90.9% 90.9%
CKSAAP 90.9% 98.6% 83.3% 95.3% 70.3% 83.7%
CKSAAP.ext 76.4% 98.2% 83.7% 81.5% 70.3% 90.9%
188D 90.9% 95.3% 88% 95.3% 94.6% 85.1%
188D.ext 92% 93.1% 88.8% 94.9% 94.9% 89.9%
2% -4%, of the values when considering the extended classes CKSAAP and 188D.
The same decrease value is also present for the average SPs of the same classes (see
Table 6).
Results on the balanced dataset D128
Below we present the obtained classification results on the balanced dataset D128,
with and without the addition of the SNARER descriptors. Table 7 reports the aver-
age accuracy performances of the ML algorithms without considering the SNARER
descriptors in the balanced D128 dataset. In addition, histograms are depicted
graphically in Figure 3: RF varies from a minimum of 71.1% with the use of the
GAAC class to a maximum of 95.4% with the 188D class; KNN settles between a
minimum of 64.2% with the use of GAAC to a maximum of 90% with the 188D
Table 7 Performance of average ACC for the D128 dataset.
Accuracy
RF KNN ADA
GAAC 71.1% 64.2% 70%
GAAC.ext 84% 65.4% 84%
CTDT 73.4% 66.4% 70.3%
CTDT.ext 88% 68.7% 84.1%
CKSAAP 92.2% 72.4% 80.7%
CKSAAP.ext 92.3% 74.1% 89.4%
188D 95.4% 90% 90.2%
188D.ext 95.3% 88.6% 90%Auriemma Citarella et al. Page 11 of 16
class; ADA varies from a minimum of 70% with GAAC to a maximum of 90.2%
trained on the 188D class. Extended classes with SNARER descriptors shift these
average ACC rates. In particular, RF varies from a minimum of 84% using the
extension with GAAC to a maximum of 95.3% with the 188D class. KNN starts
from a minimum of 65.4% with the extended GAAC class and reaches a maximum
of 88.6% with the extended 188D class. ADA varies in a range between 84% with
the GAAC.ext class to a maximum of 90% with the combined class 188D.
By comparing the evaluated average ACCs, the SNARER class addition improves
the classification performance in relation to the GAAC, CKSAAP and CTDT fea-
ture extraction methods while there is a slight decrease in the average ACCs for the
188D feature extraction class. Further analysis should be conducted to understand
the reason for this decrease. In particular, the best classification results are obtained
with the RF algorithm.
With the extended feature extraction methods, we can note that for the RF
algorithm SN increases with GAAC and CTDT while it remains fundamentally
unchanged for the other two descriptor classes (see Table 8). Also SP increases
showing the same behavior. For the KNN algorithm, SN decreases for the GAAC
and CTDT classes by 3% and 1% for the 188D class while it increases by 2% for
the CKSAAP class. The SP of KNN instead increases for all classes except 188D,
with a decrease of about 2%. ADA improves in terms of SN on all extended classes
while it decreases in SP by 0.8% when applied on the extended class 188D.
Figure 3 Comparison between GAAC, CTDT, CKSAAP and 188D ACC with related extended
classes with SNARE (on D128 dataset).Auriemma Citarella et al. Page 12 of 16
Table 8 Performance for average SN and SP on the D128 dataset.
Sensitivity Specificity
RF KNN ADA RF KNN ADA
GAAC 80.1% 65.7% 74.5% 62.2% 63% 65.4%
GAAC.ext 84% 62.2% 88.6% 83.9% 69% 79.2%
CTDT 74.7% 70.4% 70% 72.2% 62.3% 70.5%
CTDT.ext 87.6% 64.7% 84.7% 88.3% 73% 83.4%
CKSAAP 89.7% 55.4% 80.2% 95% 89.4% 81.3%
CKSAAP.ext 90.1% 57% 89.5% 95% 91.2% 89.4%
188D 95.7% 89% 88.5% 95.1% 91% 92%
188D.ext 95.5% 88% 88.8% 95.1% 89.2% 91.2%
Table 9 Comparision of MCC for the DUNI and D128 datasets.
Matthews correlation coefficient
Dataset MCC RF MCC KNN MCC ADA
DUNI 0.74 0.76 0.61
GAAC.ext
D128 0.69 0.32 0.70
DUNI 0.77 0.81 0.49
CTDT.ext
D128 0.77 0.39 0.70
DUNI 0.77 0.73 0.69
CKSAAP.ext
D128 0.86 0.53 0.80
DUNI 0.84 0.87 0.70
188D.ext
D128 0.91 0.81 0.81
Comparison between the DUNI and the D128 datasets
Carrying out experiments on unbalanced datasets or balanced datasets affects the
automatic learning of the different ML algorithms. In fact, it has been observed that
when tests are performed on an unbalanced dataset, greater accuracy is achieved
since the classification of each test sample towards the majority class prevails [35].
Consequently, choosing a balanced dataset for training tests can lead to a higher
quality of classification predictions. Since the ACC calculation is sensitive to the
imbalance class in order to compare the DUNI and D128 datasets, following the
SNARER descriptors introduction, we have used the Matthews Correlation Coeffi-
cient (MCC) [36]. MCC varies in the range [−1; 1] and it is used as a classification
quality measure also in cases where the datasets have different sizes. When the MCC
value is 1, it indicates a perfect forecast. If it returns a value of -1 it represents a
perfect negative correlation while 0 means that the classifier returns only a forecast
no better than a random one.
TP × TN − FP × FN
M CC = p (4)
(T P + F P )(T P + F N )(T N + F P )(T N + F N )
In Table 9, we present the comparison between the MCC metrics for RF, KNN
and ADA trained on the DUNI and D128 datasets with the extended descriptors
classes.
The MCC (see Figure 4) of RF improves on the balanced dataset, except for a
decrease with the GAAC discriminant features and for no change on the CTDT
class. The MCC of KNN is lowered for all combined descriptors, significantly for
GAAC, CTDT and CKSAAP. In contrast, ADA’s MCC is significantly improved
in all four conditions.
Conclusion
In recent decades, following the exponential increase in data from gene sequencing,
it has become necessary to explore different ML techniques for the protein identifi-
cation, in support of traditional methods [37]. Recent studies on SNARE proteinsAuriemma Citarella et al. Page 13 of 16
Figure 4 Graphic visualization of MCC for RF,KNN and ADA algorithms.
have shown that their complexes are spoken in the release of neurotransmitters
and that their dysfunction is the basis of neurodegenerative, neural developmental
and neuropsychiatric disorders. The importance of recognizing them with increas-
ingly precision has a significant biological impact for identifying the aforementioned
pathological conditions [38]. The aim of classifying these proteins allows researchersAuriemma Citarella et al. Page 14 of 16
to understand the biological pathways in which they are involved and by increasing
their knowledge, they can improve the possible therapeutic approach.
In this work, we tested different feature extraction methods on a balanced and an
unbalanced dataset, with and without the new contribution of SNARER descrip-
tors addition, in order to examine the role of balanced and unbalanced training
in the classification of SNARE binary proteins. Consequently, we compared the
behavior of three ML algorithms (RF, KNN and ADA) on the homogeneous and
non-homogeneous datasets.
The ML models were evaluated calculating the ACC, SN and SP average values.
Our results showed that the performance of the ML algorithms, with the extension
of the SNARER descriptors to the feature sets used, improved on both datasets
in terms of average ACC. This improvement is greater for RF, KNN and ADA
algorithms with the combination of SNARER descriptors to the 188D class. In
particular, our best results on the balanced and non-redundant dataset D128 are
92.3% of ACC, 90.1% for SN and 95% for SP with the RF algorithm and with
the extended class CKSAAP.ext. By evaluating the MCC for RF, KNN and ADA
on both datasets trained with extended feature sets, the ADA algorithm benefited
from better performance applied on the balanced dataset. On the contrary, KNN
has worsened in terms of performance, reaching a higher value only for the 188D
class. Specifically, the algorithms trained on the balanced dataset produce a better
MCC, especially for RF and more for ADA, which recovers both in terms of ACC,
SP and SN in all the considered tests. KNN, on the contrary, appears to have lower
performance in terms of MCC compared to the other algorithms considered.
As future work, it is possible to extend the analysis to also identify the SNARE
proteins sub-categories based on their structural features, Q-SNAREs and R-
SNAREs. Furthermore, it would be useful to explore the use of different classes
of descriptors, also combined with each other, which can guarantee a better classi-
fication of the proteins under examination.
Abbreviations
AAC: Amino acid composition; ACC: Accuracy; ADA: Adaptive Boosting; CTDT:
Composition/Transition/Distribution; FN: false negative; FP: false positive; GAAC: Grouped amino acid
composition; KNN: K-nearest neighbors; MCC: Matthews correlation coefficient; ML: Machine Learning; SN:
sensitivity; SNARE (Soluble N–ethylmaleimide sensitive factor attachment protein receptor); RF: Random Forest;
SP: specificity; TN: true negative; TP: true positive;
Declarations
Acknowledgements
Not applicable.
Availability of data and materials
The dataset generated and analysed during the current study are available in the SNARER repository,
https://github.com/luigidibiasi/snarer. Access to the repository is public.
Ethics approval and consent to participate
Not applicable.
Competing interests
The authors declare that they have no competing interests.
Consent for publication
Not applicable.Auriemma Citarella et al. Page 15 of 16
Authors’ contributions
LDB designed the algorithm. AAC, MR and GF contributed to writing the manuscript. All authors read and
approved the final manuscript.
Funding
Not applicable.
Author details
Department of Computer Science, University of Salerno, Fisciano, IT.
References
1. Ungar, D., Hughson, F.M.: Snare protein structure and function. Annual review of cell and developmental
biology 19(1), 493–517 (2003)
2. Chen, Y.A., Scheller, R.H.: Snare-mediated membrane fusion. Nature reviews Molecular cell biology 2(2),
98–106 (2001)
3. Sutton, R.B., Fasshauer, D., Jahn, R., Brunger, A.T.: Crystal structure of a snare complex involved in synaptic
exocytosis at 2.4 å resolution. Nature 395(6700), 347–353 (1998)
4. Fasshauer, D., Sutton, R.B., Brunger, A.T., Jahn, R.: Conserved structural features of the synaptic fusion
complex: Snare proteins reclassified as q-and r-snares. Proceedings of the national academy of sciences 95(26),
15781–15786 (1998)
5. Ramakrishnan, N.A., Drescher, M.J., Drescher, D.G.: The snare complex in neuronal and sensory cells.
Molecular and Cellular Neuroscience 50(1), 58–69 (2012)
6. Yang, X., Kaeser-Woo, Y.J., Pang, Z.P., Xu, W., Südhof, T.C.: Complexin clamps asynchronous release by
blocking a secondary ca2+ sensor via its accessory α helix. Neuron 68(5), 907–920 (2010)
7. Guerini, F.R., Bolognesi, E., Chiappedi, M., Manca, S., Ghezzo, A., Agliardi, C., Sotgiu, S., Usai, S., Matteoli,
M., Clerici, M.: Snap-25 single nucleotide polymorphisms are associated with hyperactivity in autism spectrum
disorders. Pharmacological Research 64(3), 283–288 (2011)
8. Etain, B., Dumaine, A., Mathieu, F., Chevalier, F., Henry, C., Kahn, J., Deshommes, J., Bellivier, F., Leboyer,
M., Jamain, S.: A snap25 promoter variant is associated with early-onset bipolar disorder and a high expression
level in brain. Molecular Psychiatry 15(7), 748–755 (2010)
9. Nakamura, K., Anitha, A., Yamada, K., Tsujii, M., Iwayama, Y., Hattori, E., Toyota, T., Suda, S., Takei, N.,
Iwata, Y., et al.: Genetic and expression analyses reveal elevated expression of syntaxin 1a (stx1a) in high
functioning autism. International Journal of Neuropsychopharmacology 11(8), 1073–1084 (2008)
10. Garcia-Reitböck, P., Anichtchik, O., Bellucci, A., Iovino, M., Ballini, C., Fineberg, E., Ghetti, B., Della Corte,
L., Spano, P., Tofaris, G.K., et al.: Snare protein redistribution and synaptic failure in a transgenic mouse
model of parkinson’s disease. Brain 133(7), 2032–2044 (2010)
11. Smith, R., Klein, P., Koc-Schmitz, Y., Waldvogel, H.J., Faull, R.L., Brundin, P., Plomann, M., Li, J.-Y.: Loss
of snap-25 and rabphilin 3a in sensory-motor cortex in huntington’s disease. Journal of neurochemistry 103(1),
115–123 (2007)
12. Reuter, J.A., Spacek, D.V., Snyder, M.P.: High-throughput sequencing technologies. Molecular cell 58(4),
586–597 (2015)
13. Meng, J., Wang, J.: Role of snare proteins in tumourigenesis and their potential as targets for novel anti-cancer
therapeutics. Biochimica et Biophysica Acta (BBA)-Reviews on Cancer 1856(1), 1–12 (2015)
14. Honer, W.G., Falkai, P., Bayer, T.A., Xie, J., Hu, L., Li, H.-Y., Arango, V., Mann, J.J., Dwork, A.J., Trimble,
W.S.: Abnormalities of snare mechanism proteins in anterior frontal cortex in severe mental illness. Cerebral
Cortex 12(4), 349–356 (2002)
15. Kloepper, T.H., Kienle, C.N., Fasshauer, D.: An elaborate classification of snare proteins sheds light on the
conservation of the eukaryotic endomembrane system. Molecular biology of the cell 18(9), 3463–3471 (2007)
16. Le, N.Q.K., Nguyen, V.-N.: Snare-cnn: a 2d convolutional neural network architecture to identify snare proteins
from high-throughput sequencing data. PeerJ Computer Science 5, 177 (2019)
17. Li, G.: Identification of snare proteins through a novel hybrid model. IEEE Access 8, 117877–117887 (2020)
18. Consortium, G.O.: Gene ontology consortium: going forward. Nucleic acids research 43(D1), 1049–1056 (2015)
19. Li, W., Godzik, A.: Cd-hit: a fast program for clustering and comparing large sets of protein or nucleotide
sequences. Bioinformatics 22(13), 1658–1659 (2006)
20. Orengo, C.A., Jones, D.T., Thornton, J.M.: Protein superfamilles and domain superfolds. Nature 372(6507),
631–634 (1994)
21. Ong, S.A., Lin, H.H., Chen, Y.Z., Li, Z.R., Cao, Z.: Efficacy of different protein descriptors in predicting protein
functional families. Bmc Bioinformatics 8(1), 300 (2007)
22. Patil, K., Chouhan, U.: Relevance of machine learning techniques and various protein features in protein fold
classification: A review. Current Bioinformatics 14(8), 688–697 (2019)
23. Luo, R.-y., Feng, Z.-p., Liu, J.-k.: Prediction of protein structural class by amino acid and polypeptide
composition. European Journal of Biochemistry 269(17), 4219–4225 (2002)
24. Chou, K.-C.: Prediction of protein cellular attributes using pseudo-amino acid composition. Proteins: Structure,
Function, and Bioinformatics 43(3), 246–255 (2001)
25. Chen, Z., Zhao, P., Li, F., Leier, A., Marquez-Lago, T.T., Wang, Y., Webb, G.I., Smith, A.I., Daly, R.J., Chou,
K.-C., et al.: ifeature: a python package and web server for features extraction and selection from protein and
peptide sequences. Bioinformatics 34(14), 2499–2502 (2018)
26. Chen, K., Kurgan, L.A., Ruan, J.: Prediction of flexible/rigid regions from protein sequences using k-spaced
amino acid pairs. BMC structural biology 7(1), 25 (2007)
27. Cai, C., Han, L., Ji, Z.L., Chen, X., Chen, Y.Z.: Svm-prot: web-based support vector machine software for
functional classification of a protein from its primary sequence. Nucleic acids research 31(13), 3692–3697
(2003)Auriemma Citarella et al. Page 16 of 16
28. Kawashima, S., Kanehisa, M.: Aaindex: amino acid index database. Nucleic acids research 28(1), 374–374
(2000)
29. FAUCHÈRE, J.-L., Charton, M., Kier, L.B., Verloop, A., Pliska, V.: Amino acid side chain parameters for
correlation studies in biology and pharmacology. International journal of peptide and protein research 32(4),
269–278 (1988)
30. Freund, Y., Schapire, R.E.: A decision-theoretic generalization of on-line learning and an application to
boosting. Journal of computer and system sciences 55(1), 119–139 (1997)
31. Wu, X., Kumar, V., Quinlan, J.R., Ghosh, J., Yang, Q., Motoda, H., McLachlan, G.J., Ng, A., Liu, B., Philip,
S.Y., et al.: Top 10 algorithms in data mining. Knowledge and information systems 14(1), 1–37 (2008)
32. Ho, T.K.: Random decision forests. In: Proceedings of 3rd International Conference on Document Analysis and
Recognition, vol. 1, pp. 278–282 (1995). IEEE
33. WEKA, S.: The waikato environment for knowledge analysis. University of Waikato, Hamilton, New Zealand:
University of Waikato (1995)
34. Piotto, S., Di Biasi, L., Concilio, S., Castiglione, A., Cattaneo, G.: Grimd: distributed computing for chemists
and biologists. Bioinformation 10(1), 43 (2014)
35. Wei, Q., Dunbrack Jr, R.L.: The role of balanced training and testing data sets for binary classifiers in
bioinformatics. PloS one 8(7), 67863 (2013)
36. Boughorbel, S., Jarray, F., El-Anbari, M.: Optimal classifier for imbalanced data using matthews correlation
coefficient metric. PloS one 12(6), 0177678 (2017)
37. Gevaert, K., Vandekerckhove, J.: Protein identification methods in proteomics. ELECTROPHORESIS: An
International Journal 21(6), 1145–1154 (2000)
38. Chen, F., Chen, H., Chen, Y., Wei, W., Sun, Y., Zhang, L., Cui, L., Wang, Y.: Dysfunction of the snare
complex in neurological and psychiatric disorders. Pharmacological Research, 105469 (2021)You can also read