Toward 100% Carbon-Free Electricity
←
→
Page content transcription
If your browser does not render page correctly, please read the page content below

PRELIMINARY AND CONFIDENTIAL DRAFT. NOT FOR CITATION OR DISTRIBUTION.

Toward 100% Carbon-Free Electricity
HOW THE REGIONAL ELECTRICITY MARKET CAN EVOLVE TO HELP
WASHINGTON, DC ACHIEVE ITS ENERGY AND CLIMATE CHANGE GOALS

PREPARED FOR
District of Columbia Department of Energy and Environment

OCTOBER 2021
PRINCIPAL AUTHOR
Brattle Group

PREPARED BY
Kathleen Spees
Travis Carless
Sean Chew

NOTICE

This report was prepared for District of Columbia Department of Energy and Environment, in accordance with The
Brattle Group’s engagement terms, and is intended to be read and used as a whole and not in parts. The report
reflects the analyses and opinions of the authors and does not necessarily reflect those of The Brattle Group’s clients
or other consultants. There are no third party beneficiaries with respect to this report, and The Brattle Group does
not accept any liability to any third party in respect of the contents of this report or any actions taken or decisions
made as a consequence of the information set forth herein.

© 2021 The Brattle Group

Toward 100% Carbon-Free Electricity                                                                                  |i

TABLE OF CONTENTS

Executive Summary ......................................................................................................................... 1

Acronyms and Glossary ................................................................................................................ 5

      Background ................................................................................................................................ 7
      A.     The District’s Climate Change Policy Goals ..................................................................................... 7
      B.     Overview of Wholesale Electricity Markets..................................................................................... 8
      C.     Interactions Between Regional Markets and Clean Energy Policies ..................................... 9
      D.     Challenges Anticipated in Clean Energy Transition .....................................................................11

      The Minimum Offer Price Rule ........................................................................................ 12
      A. History and Status of the Minimum Offer Price Rule ................................................................. 12
      B. Implications for the District ....................................................................................................................15
      C. The Fixed Resource Requirement Alternative...............................................................................16

      Driving Investments and Operations Toward Cost-Effective Decarbonization
      ..................................................................................................................................................... 20
      A.     Marginal and Total Embedded Emissions Data ............................................................................. 21
      B.     Regional Clean Energy or Capacity Market ...................................................................................26
      C.     Carbon Pricing in the Energy Market .................................................................................................31
      D.     Advanced Clean Energy Attribute Products .................................................................................35

      Enabling Emerging Technologies’ Contribution to Grid Transition ................... 38

      Transitioning to a 100% Clean Energy Grid While Maintaining Reliability ..... 47
      A. Enhancing the Suite of Reliability Products to Reflect Changing System Needs ......... 48
      B. Energy and Ancillary Service Market Enhancements.................................................................53
      C. Seasonal Capacity Market .....................................................................................................................55

Appendix: Description of the Regional Capacity Market ............................................. 59

Toward 100% Carbon-Free Electricity                                                                                                                       | ii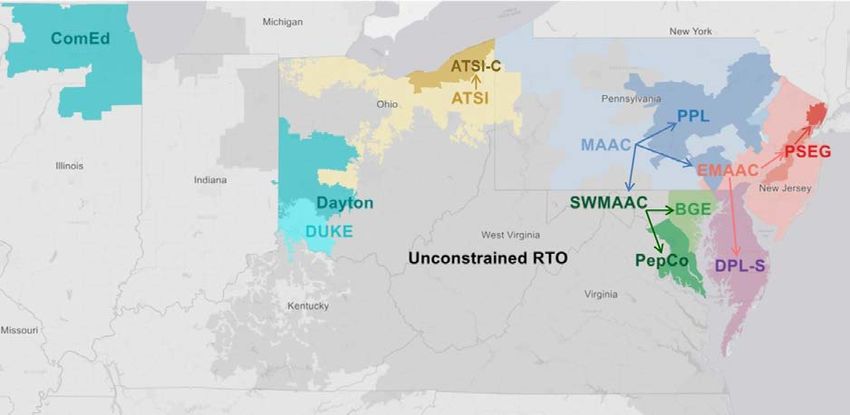
Executive Summary
    ________
Washington, DC leads the nation in its commitment to achieve a 100% renewable power supply mix by 2032 and
100% economy-wide greenhouse gas (GHG) neutrality by 2050. The District’s Clean Energy DC plan has identified
rapid elimination of GHG emissions from the power grid as a central and critical component of its decarbonization
strategy. 1 The electricity sector is the source of 55% of total District GHG emissions; reducing these emissions
through investments in energy efficiency and renewable power together make up the majority of the emissions
reductions anticipated between now and 2032. 2 A 100% clean electricity supply mix is also required to deliver GHG
reductions through electrification of transportation and building energy uses.

The broad scope of policy reforms required to achieve 100% clean energy on the District’s accelerated timeframe
will alter nearly every aspect of how electricity supply is developed, operated, and delivered to the District. The Clean
Energy DC plan includes substantial expansion of energy efficiency, demand response, local solar, and other
distributed resources. Further, deliveries of power from the bulk system must be fully decarbonized to ensure GHG
neutrality.

The District’s position within the regional electricity grid presents both opportunities and challenges with respect to
achieving rapid and affordable grid decarbonization. The opportunities derive from access to a broad interconnected
marketplace operated by PJM Interconnection that connects the District to 13 other states "see Figure 1”. This large
power market has, for the most part, delivered reliable and affordable power to the District for the past two decades.3
Access to low-cost power supply at competitive prices has been particularly important for the District, given the
limited ability (and high costs) to develop power projects locally.

                    FIGURE 1: PJM INTERCONNECTION MARKETPLACE GEOGRAPHY

                Source and Notes: PJM Interconnection or PJM is the independent entity that operates the power
                transmission system, schedules power deliveries, and operates the wholesale electricity markets across this
                regional footprint. PJM Interconnection, Territory Served.

Access to a broad marketplace will become even more important as the District aims to procure large quantities of
renewable power to be delivered through the bulk transmission system. The broad regional market creates
opportunities to access renewable resources from lower-cost regions; rely on a regionally diverse market to provide

1
     See Clean Energy DC Action Plan, August 2018.
2
     See: DC DOEE Renewable Energy in the District; Database of State Incentives for Renewables, DC Renewable Portfolio
     Standard; and DC Public Service Commission, Renewable Energy Portfolio Standard (RPS) Report.
3
     PJM estimates that participation in the regional marketplace has delivered $3.2-4.0 billion per year in cost savings to
     consumers across its footprint covering 13 states and Washington, DC. These savings arise from the use of competitive
     market signals to attract investment in the resources needed for summer peak needs and to source energy from the lowest-
     cost resources available, subject to transmission constraints. See PJM Value Proposition.

Toward 100% Carbon-Free Electricity                                                                                           |1
balancing services that will compensate for renewable resources’ intermittency; and maximize use of the
transmission system. Participating in the regional marketplace also offers greater opportunities to coordinate
decarbonization policies with other states across the PJM region pursuing their own commitments to clean energy
including New Jersey at 100% economy-wide clean energy by 2050, Maryland at 50% renewable by 2040, Delaware
at 40% renewable by 2035, Virginia at 100% renewable by 2045/2050, and Illinois at 100% clean energy by 2045. 4

The transition to a 100% renewable supply mix will also face several challenges in the context of the PJM
marketplace. Most fundamentally, the PJM markets have been designed to maintain reliability at least cost, without
distinguishing between clean and fossil resources. Without reform, this indifference to GHG emissions and clean
energy policy requirements could continue to incentivize market participants to build and operate fossil plants, an
outcome that is misaligned with clean energy policy goals. The clean energy transition will require new approaches
to maintaining reliability, setting prices, and enabling the participation of emerging technologies. Finally, the
wholesale markets must manage amongst the diverse policies of the District and 13 different states, some of which
have no renewable or carbon policies.

Seeing both the challenges and opportunities presented by participation in the PJM marketplace, the DC Department
of Energy and Environment (DOEE) has posed the following question:

         Study Question: How might the PJM electricity markets evolve to help
         Washington, DC achieve its energy and climate change goals?

This study comes at a unique moment in the evolution of the PJM electricity markets. Several years of debate
regarding the conflict between markets and clean energy policies is coming to a conclusion as PJM’s proposal to
repeal the controversial Minimum Offer Price Rule (MOPR) comes into effect.5 In 2019, the Federal Energy Regulatory
Commission (FERC) ordered PJM to expand the MOPR under the flawed theory that it was needed to maintain
reliability and competitive prices in PJM’s capacity market. 6 The MOPR was intended to “correct” for the price-
suppressive impacts of out-of-market subsidies by restoring capacity market prices to the level that would have
prevailed in the absence of the subsidies. The effect of MOPR was to exclude policy-driven resources, such as new
renewables developed to meet DC’s renewable standard, from clearing in the capacity market. If the MOPR had not
been repealed, we estimate that it could have excluded approximately 394 MW of unforced capacity (UCAP) from DC
policy resources from clearing the PJM capacity market by 2030, at a cost of approximately $34 million per year to
consumers in the District. To mitigate these costs, Washington, DC would also have the option to exit the capacity
market entirely under the Fixed Resource Requirement (FRR) alternative, though doing so would introduce a number
of risks and forfeit the benefits historically achieved through full capacity market participation. With the repeal of
MOPR now in effect, it can be relegated to the status of an unfortunate, but short-lived, detour in the evolution of the
wholesale marketplace.

We anticipate that the next phase of electricity market reform efforts will be much more productive. In response to
requests from the Organization of PJM States, Inc. and market stakeholders, PJM management and Board of
Directors have adopted a strategic priority to “facilitate pursuit of policy-maker and consumer decarbonization
objectives by establishing ourselves as a trusted, unbiased policy adviser & driving consensus for at-scale, market-

4
    See PJM-Environmental Information System “Comparison of Renewable Portfolio Standards (RPS) Programs in PJM States,”
    and “Landmark Ill. climate bill passes in boon for nuclear, renewables,” E&E News Energy Wire.
5
    See PJM Interconnection “Revisions to Application of Minimum Offer Price Rule” filed before the Federal Energy Regulatory
    Commission July 30, 2021 in Docket No. ER 21-2582-000. PJM’s proposed repeal has taken effect as of September 29,
    2021, though there is a continued possibility of appeal, see Federal Energy Regulatory Commission, Notice of Filing Taking
    Effect by Operation of Law, September 29, 2021, Docket No. ER21-2582-000.
6
    The Reliability Pricing Model (RPM) is PJM’s capacity market. The capacity market is a three-year forward market within
    which PJM procures commitments from enough supply resources (generators, batteries, demand response, and energy
    efficiency) to ensure that it can reliably meet anticipated peak demand on the system, even after accounting for uncertainties
    such as weather and resource unavailability.

Toward 100% Carbon-Free Electricity                                                                                            |2
based solutions where possible.” 7 To that end, PJM is supporting a series of stakeholder discussions and market
design initiatives aimed at addressing policy priorities and enabling clean energy transition. 8 Supporting reliable,
affordable access to the renewable power that will fulfill Washington, DC’s 100% renewable power mandate should
be incorporated as a priority in these PJM reform efforts given the scale and pace of the District’s climate change
policy goals.

In this study, we review a range of opportunities for the PJM wholesale markets to evolve to better support and
advance the District’s policy goals, as oriented to address the following challenges:

•   Redirecting market incentives to achieve policy goals, rather than maintaining the traditional approach of
    assuming that the markets must remain indifferent to policy goals,
•   Enabling new technologies to participate in all markets and support innovative solutions for the clean grid,
    and
•   Maintaining reliability as the grid advances from relying primarily on traditional fossil plants to meet energy
    and other reliability services to one that must rely primarily on intermittent renewables, distributed resources,
    batteries, and other emerging resource types.

Table 1 provides a summary of reforms that could advance Washington, DC’s policy goals; in the body of this report
we provide a more comprehensive discussion of each potential reform, how it would support the District’s policy
goals, and the status of ongoing reform efforts. In some cases, particularly in the context of reliability needs, these
reforms are squarely in the purview of PJM to address and implement. However, in many other cases achieving a
meaningful solution to support policy goals will require deeper engagement and partnership between PJM and
policymakers. For example, the most impactful advances in carbon pricing or regional clean attribute markets would
require PJM to develop a regional market framework for coordinating amongst policies, while the District and each
state would set the policy parameters to be reflected through the markets. The need for solutions that cross
organizational and jurisdictional boundaries could pose a potential barrier to implementation across some of these
reforms.

These reforms build on the regional scope and economic principles that have delivered substantial benefits to
consumers across the PJM region for many years. Taken as a whole, they represent an ambitious scope that would
substantially revise the operations and resource investments governed by the PJM marketplace, redirecting these
incentives toward supporting the reliable, affordable, and 100% renewable power supply required by the District.
Despite the magnitude and complexity of these reforms, there is urgency to pursue them quickly if they are to provide
meaningful support through the District’s rapid renewable deployments over the coming decade.

7
    See Organization of PJM States, Inc Letter to PJM, January 8, 2021; and PJM Interconnection, PJM Strategy – Powering
    Our Future, p. 10.
8
    See PJM Interconnection, Capacity Market Reform Scope: Beyond MOPR, May 13, 2021.

Toward 100% Carbon-Free Electricity                                                                                  |3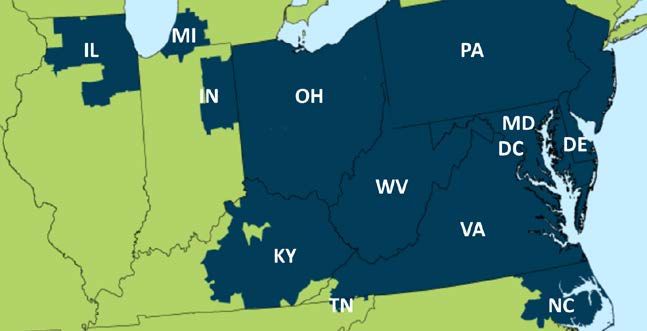
TABLE 1. OPPORTUNITIES TO ADVANCE PJM MARKETS TO SUPPORT CLEAN ENERGY
                                     TRANSITION

    Challenge                             Opportunities to Support Clean Energy Transition

Driving                • Marginal and Total Embedded Emissions Data: Utilize PJM’s granular data of grid operations to
Investments and          address information gaps identified in the Clean Energy DC plan, and provide the District with the
Operations Toward        high-quality data needed to support policymaking, contracting, GHG accounting, and other market
Cost-Effective           design enhancements
Decarbonization        • Regional Clean Energy or Capacity Market: Introduce a broad PJM-wide marketplace for the
                         procurement of clean energy attributes on behalf of governments, companies, and consumers
                       • Carbon Pricing: Review opportunities to achieve carbon reductions through enhanced carbon
                         pricing, such as by addressing carbon “leakage” from the Regional Greenhouse Gas Initiative
                         (RGGI) market, enabling non-RGGI jurisdictions such as the District to express a carbon price (even
                         if there are no local fossil plants), and/or by introducing a PJM-wide carbon pricing mechanism
                       • Enhanced Clean Attribute Products: Examine the limitations that the Clean Energy DC plan has
                         identified with the traditional REC product definition, using these as the basis to develop the next
                         generation of REC products that improve accountability and incentives relative to GHG objectives
Enabling Emerging      • Fully Enable All Emerging Technologies: Utilize needs-based, technology-neutral product
Technologies’            definitions for all electricity markets. Ensure that all resource types that notionally could provide a
Contribution to          certain type of grid service are enabled to do so, are able to participate in price
Grid Transition          formation/dispatch, and face the minimum possible barriers to entry. Ensure that control room
                         operators have the opportunity to gain experience relying on each emerging resource type to
                         provide essential grid services (even if they are not yet commercially viable)
                       • Retail Structures: Even if wholesale markets fully enable distributed resources, additional
                         reforms may be needed in retail rates and retail access rules to accommodate a comprehensive
                         suite of resource types and business models
Maintaining            • Ancillary Service Reforms: Analyze the need for new types or greater quantities of operating
Reliability in the       reserves or other grid reliability services to maintain operational reliability as the grid becomes
Transition to a          more dependent on renewables, batteries, demand response, and distributed resources
100% Clean Energy      • Energy and Ancillary Price Formation: Continue reforms aimed at supporting efficient price
Grid                     formation that properly values balancing services and fully integrates emerging resources into
                         price formation (thus limiting or preventing out-of-market reliance on fossil resources)
                       • Accuracy of Supply and Demand Accounting for Reliability Needs: Use effective load carrying
                         capability (ELCC) or similar approaches to accurately measure reliability contribution of all
                         resources including intermittent, energy-limited, and fuel-supply-constrained resources; ensure
                         that PJM and distribution utility load forecasts fully reflect demand side resources such as energy
                         efficiency, distributed generation, energy storage, and updated building codes
                       • Flexible Capacity Requirements: If the above reforms would not provide sufficient assurance
                         that resources will be available to meet system flexibility needs, consider adopting flexible
                         capacity requirements
                       • Seasonal Capacity Market Design: Assess winter reliability needs and enhance seasonal
                         capacity market to fully enable and remunerate seasonal resources

Toward 100% Carbon-Free Electricity                                                                                            |4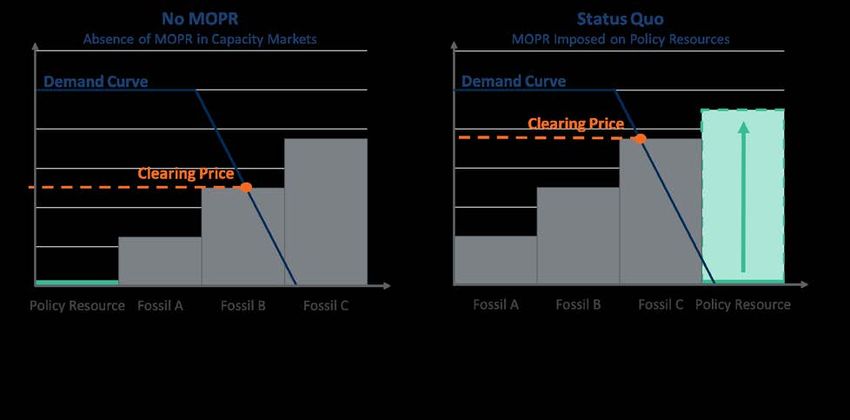
Acronyms and Glossary
 BRA          Base Residual Auction. The annual auction conducted by PJM to procure capacity supply.
 CEAC         Clean Energy Attribute Credit. The attribute of a resource being a clean energy resource (whether renewable
              or nuclear) that can be unbundled and separately sold to signify the production of 1 MWh of clean energy
              produced.
 DER          Distributed Energy Resources. Electricity resources located at distributed locations within the electric
              distribution system.
 DOEE         Department of Energy and Environment. Agency responsible for administration and oversight of energy and
              environmental programs in the District.
 DSO          Distribution System Operator. Under one proposed model for the industry, the DSO would be the entity
              responsible for scheduling the operations of DERs.
 ELCC         Effective Load Carrying Capability. The statistically-estimated reliable quantity of capacity that can be
              delivered by a certain resource type such as renewables or batteries, after accounting for factors including
              weather, resource variability, and correlations with consumption patterns.
 FCEM         Forward Clean Energy Market. A proposed regional marketplace for large-scale procurement of clean power
              supply resources.
 FERC         Federal Energy Regulatory Commission. The US Federal government agency responsible for the regulation of
              inter-regional energy markets, including the PJM regional marketplace.
 FIT          Feed-in-Tariff. A policy incentive for clean energy resources awarded based on the quantity of energy produced.
 FRR          Fixed Resource Requirement. A rule within the PJM capacity market that allows some utilities or policymakers
              to exit from the capacity market and procure their own capacity supply needs.
 GHG          Greenhouse Gas. Air pollutants that increase the net level of heat absorbed and retained by the atmosphere,
              thus contributing to the greenhouse effect and climate change.
 ICCM         Integrated Clean Capacity Market. A proposed regional marketplace for procurement of both capacity needs
              and large-scale clean power supply needs.
 IMM          Independent Market Monitor. An independent entity responsible for reviewing the competitiveness and
              efficiency of the wholesale electricity market, and reporting findings to the public and government authorities.
 ISO          Independent System Operator. An entity such as PJM responsible for scheduling the transmission system and
              operating regional markets (used synonymously with RTO).
 kW           Kilowatt. A unit of power consumption or production, equal to 1/1000th of one MW.
 LDA          Locational Deliverability Area. A pricing zone within the PJM capacity market.
 LME          Locational Marginal Emissions. The incremental air pollution emissions caused by consuming additional
              energy (or avoided by producing additional energy) at a given place in the grid at a given point in time, in units
              of tons per MWh.
 LSE          Load Serving Entity. Entity that is financially responsible for paying PJM for power on behalf of end-use
              customers, usually a retail electricity provider or regulated utility.
 MAAC         Mid-Atlantic Area Council. A region of the PJM capacity market spanning across the District, Maryland,
              Delaware, New Jersey, and portions of Pennsylvania.
 MOPR         Minimum Offer Price Rule. A rule within PJM’s capacity market that can in some cases require that a capacity
              resource offer its supply only at or above a defined price level.
 MW           Megawatt. A unit of power consumption or production, equal to 1000 kW.
 MWh          Megawatt Hours. A unit of energy consumption or production, equal to 1 MW continuously produced for one
              hour.

Toward 100% Carbon-Free Electricity                                                                                          |5
ORDC         Operating Reserve Demand Curve. A representation of the ISO’s willingness to pay to procure operating
              reserves, or standby power, to maintain readiness and availability to respond to system emergencies and
              manage variability in net demand.
 PEPCO        Potomac Electric Power Company. The distribution utility serving the District of Columbia.
 PJM          PJM Interconnection. The RTO responsible for scheduling the transmission system and operating the regional
              wholesale markets serving the District and all or parts of 13 states.
 PTC          Production Tax Credit. A federal tax incentive awarded to renewable resources.
 REC          Renewable Energy Credit. A clean energy attribute produced from a renewable supply resource.
 RGGI         Regional Greenhouse Gas Initiative. An organization that operations a regional cap-and-trade program that
              limits emissions from power plants within Connecticut, Delaware, Maine, Maryland, Massachusetts, New
              Hampshire, New Jersey, New York, Rhode Island, Vermont, and Virginia.
 RPM          Reliability Pricing Model. PJM’s capacity market.
 RPS          Renewable Portfolio Standard. A law requiring that a certain percentage of all power delivered to consumers
              must be produced by qualified renewable power supply.
 RTO          Regional Transmission Organization. An entity such as PJM responsible for scheduling the transmission
              system and operating regional markets (used synonymously with ISO).
 SWMAAC       South West Mid-Atlantic Area Council. A region of the PJM service territory that includes the District and
              portions of Maryland.
 UCAP         Unforced Capacity. The capacity value of a resource after accounting for expected unavailability.
 VRR          Variable Resource Requirement. The administrative demand curve within the PJM capacity market.
 ZEC          Zero Emissions Credit. A clean energy attribute produced from a nuclear power plant.

Toward 100% Carbon-Free Electricity                                                                                   |6
Background
The Government of the District of Columbia has put forward the most ambitious clean energy goal in the US. Effective
March 22, 2019, the Clean Energy DC Omnibus Amendments Act of 2018 increased the District’s Renewable Portfolio
Standard from 50% to 100% by 2032, enabling DC to become the first state, district, or territory in the US to achieve
a 100% RPS. However, the District’s power deliveries are coordinated by the PJM Interconnection (PJM) wholesale
power market, which has historically prioritized providing low-cost, reliable generation without consideration for
policy resources intended to reduce carbon emissions.

While a low-cost, high reliability approach suited the needs of Washington, DC in the past, maintaining the
indifference to carbon emissions may become increasingly at odds with Washington, DC’s goals for a clean energy
future. For example, PJM wholesale market incentives, have attracted large-scale investments in over 35,000 MW
of new natural gas-fired plants into the PJM region since the 2015/16 delivery year, while at the same time providing
insufficient incentives to attract new renewable supply or to retain some nuclear resources. 9 This pattern of market-
driven investments and retirements is not consistent with a least-cost pathway to meeting the District and states’
clean energy goals. The task in this study is to briefly describe the impacts of the now-repealed MOPR on the
District’s ratepayers, review the challenges in the wholesale markets that may be posed through the District’s
expedited transition to a renewable supply mix, and examine opportunities for changing the market design to better
support this transition.

A.         The District’s Climate Change Policy Goals
The District of Columbia has set an ambitious mandate of shifting its supply of electricity to 100% renewables by
2032. The District enacted its first RPS in 2005 with subsequent legislation increasing the RPS to 20% by 2020
under the Clean and Affordable Energy Act of 2008, to 50% by 2032 under the Renewable Portfolio Standard
Expansion Amendment Act of 2016, and finally to 100% by 2032 under the Clean Energy DC Omnibus Amendment
Act of 2018. In most recent legislation, the Clean Energy DC Omnibus Amendment Act of 2018 includes provisions
that increase the RPS requirement to 100% from Tier 1 resources, and increase the solar energy carve-out to 5.5%
by 2032 and 10% by 2041. 10 Figure 2 summarizes the generation mix of renewable resources that are likely to
contribute to the District’s RPS requirement of 100% and a 5.5% solar carve out by 2032. 11

9
     PJM Interconnection, L.L.C., “2022/2023 RPM Base Residual Auction Results,” Table 8.
10
     Tier 1 resources include solar, wind, biomass, methane, geothermal, ocean, fuel cell, and wastewater used as heat source
     or sink resources. The legislation requires renewable energy to originate from the PJM region, though existing renewable
     resources outside of the PJM region that have been certified for the RPS program will remain eligible until January 1, 2029.
     “Renewable Energy Portfolio Standards: A Report for Compliance Year 2020,” Public Service Commission of the District of
     Columbia, May 3, 2021.
11
     Note the solar carve out increases to 10% in 2041, as reported in D.C. Law 22-257, “CleanEnergy DC Omnibus Amendment
     Act of 2018”, April 30 2021.

Toward 100% Carbon-Free Electricity                                                                                           |7
FIGURE 2: CLEAN GENERATION TO MEET THE DISTRICT RPS BY 2032
Clean Energy meeting Retail Load (GWh) 12,000
Annual Energy Demand
10,000 Tier 1 Other
Tier 1 Out of DC Solar
8,000
6,000
Tier 1 Out of DC Wind
4,000
2,000
0 DC Local Solar Carve Out
2020 2021 2022 2023 2024 2025 2026 2027 2028 2029 2030 2031 2032
Sources and Notes: Annual Energy Demand is based on available 2019 historical retail load from Form EIA-861, with projections based on PJM’s
Load Forecast Report, January 2020, Table E-1. Clean Energy Mandates reflect D.C. Law 22-257, CleanEnergy DC Omnibus Amendment Act of
2018, compiled from PJM Environmental Information Services, “Comparison of Renewable Portfolio Standards (RPS) Programs in PJM States,”
April 30, 2021. Proportion of clean energy generation used to meet annual RPS requirements are based on historical proportion of RECs retired
as reported by the Public Service Commission of District of Columbia, “Renewable Energy Portfolio Standards: A Report for Compliance Year
2019,” April 30, 2021.
B. Overview of Wholesale Electricity Markets
Retail markets involve the sales of electricity to consumers, while wholesale markets typically involve the sales of
electricity among electric utilities and electricity traders before it is eventually sold to consumers. Much of the
wholesale market relies upon competitive market forces to set prices, while other prices are based on the service
provider’s cost of service. FERC authorizes jurisdictional entities to sell at market-based rates, or reviews and
authorizes cost-based rates. In competitive markets, prices reflect the factors driving supply and demand – the
physical fundamentals. Where rates are set based on costs, market fundamentals matter as well because changes
in supply and demand will affect consumers by influencing the cost and reliability of electricity. Supply incorporates
generation and transmission, which must be adequate to meet all customers’ demand simultaneously,
instantaneously and reliably. Consequently, key supply factors that affect power prices include fuel costs, capital
costs, transmission capacity and constraints, and the operating characteristics of power plants. Likewise, changes
in demand can affect prices. An example of this interaction is serving peak load on a hot summer day where less-
efficient, more-expensive power plants must be activated and consequently drive-up prices.
Power pools are multilateral arrangements with members ceding operational control over their generating units and
transmission facilities to a common operator. Members provide incremental cost data about their units and system
status data to the operator. The operator then runs an energy management system that uses the unit cost data to
optimize the overall unit commitment and economic dispatch. 12
12
Adapted from FERC’s Energy Primer, published April 2020.
Toward 100% Carbon-Free Electricity |8C. Interactions Between Regional Markets and Clean Energy
Policies
The generation portion of Washington, DC customer electricity bills reflects competitive wholesale market prices,
primarily for energy, but also for ancillary services, and capacity. The energy market is conducted on a day-ahead
and real-time basis, using a region-wide optimization to determine the lowest-cost resources that should be utilized
to produce and deliver energy to consumers, subject to transmission constraints. Prices are set, and re-set, every
five minutes across approximately 10,000 distinct points in the transmission grid that reflects the incremental cost
of meeting electricity needs at each location and each point in time. This granular approach to pricing and resource
optimization is becoming increasingly valuable in the context of increasing renewable resource development, as it
provides the ability to effectively manage the uncertainties and variability associated with wind and solar energy
production.
The ancillary services markets procure a suite of market products utilized to manage additional grid reliability and
balancing needs, beyond what can be supported in the energy market alone. One category of ancillary services,
contingency reserves, represent a set of resources that must stand ready to quickly turn on or ramp up in their power
output in response to sudden unexpected power plant or transmission outages. Another type, regulation reserves,
are tasked with continuously reacting to small imbalances in supply and demand on a granular timeframe below the
5-minute timeframe of the energy market. Together, these markets contribute only a small fraction of the total cost
of producing electricity, but nevertheless have a major role in ensuring system reliability and have a substantial
influence on price formation and resource incentives.
PJM’s capacity market is a centralized competitive auction mechanism for ensuring adequate electricity supply
regionally and by location across the PJM footprint. The Base Residual Auction (BRA) is conducted three years prior
to delivery and procures enough capacity resources to meet the Reliability Requirements (or projected peak demand
plus an uncertainty reserve margin), using an administrative demand curve to express the willingness to pay for
capacity at and above the requirement as illustrated in Figure 3. Generation, demand response, and storage
resources across PJM offer their qualified capacity at a price, with these offers aggregated into a resource supply
curve. Then the auction selects the lowest-cost resources to take on a capacity supply obligation in exchange for a
payment at the auction clearing price. Three years later, in the delivery period, the costs of capacity procurements
are allocated to load-serving entities (LSEs) and passed along to customers in proportion to their peak electricity
consumption. See the Appendix for a more complete discussion of the capacity market design.
FIGURE 3: ILLUSTRATIVE PJM CAPACITY SUPPLY AND DEMAND CURVES
Notes: Illustrative, not drawn to scale. See 2022/2023 RPM Base Residual Auction Planning Parameters for specific demand curve parameters.
Toward 100% Carbon-Free Electricity |9These three types of PJM markets are all derived from an overarching design objective: to meet consumers’ energy
needs reliably at the lowest possible cost. Though the markets operate at different timescales to meet different
types of reliability requirements, they all provide a signal that reflects system needs and aim to fulfill that need at
the lowest possible cost. The markets further incorporate the aim to enable all resources and suppliers to compete
on a level playing field to serve these defined system needs. Together, the revenues that a generator, demand
response provider, or battery resource could earn from these markets determine the total incentive to invest in a
certain technology type and so will shape the mix of resources toward those that offer the most value to the system
as a whole.
The District and 10 of 13 PJM states have established RPS programs to support clean energy goals; four (soon to be
five) states are members of the Regional Greenhouse Gas Initiative (RGGI) carbon cap-and-trade market. 13 These
policy mandates are not directly reflected within the PJM markets, but there are strong interactions between these
policy structures and the interconnected regional marketplace.
Although much more is needed to fully decarbonize the power supply, it should be noted that the broad PJM market
already offers a number of benefits that can be built upon for enabling grid transition. Wholesale electricity markets
provide a ready marketplace where clean energy resources can sell energy, capacity, and (if relevant) ancillary
services at a fair price. A share or even the majority of the resources’ investment costs can be paid for through
participating in the wholesale markets, thus reducing the net cost of clean energy policy programs. For example,
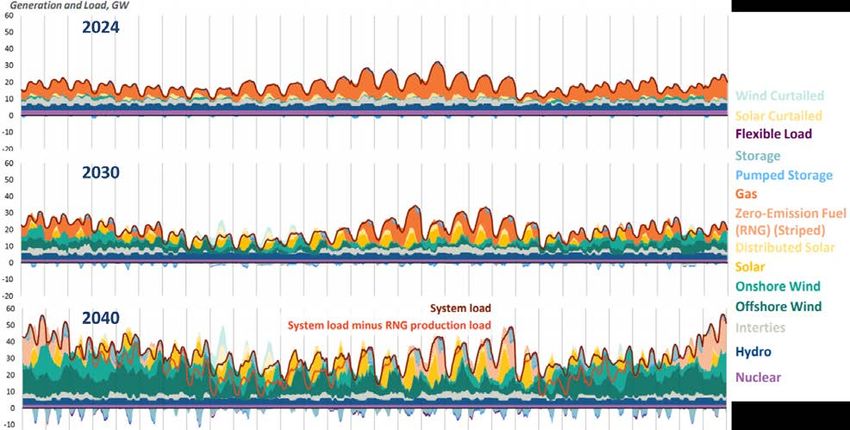
Figure 4 illustrates the approximate share of total resource revenues that various clean energy resources earn from
the wholesale capacity and energy markets. Offshore wind, onshore wind, and solar earn anywhere from 20% to
60% of their revenues from the wholesale markets, thus requiring customers to pay only the remainder through
RECs as incremental costs for pursuing clean energy goals. Amongst clean energy resources, the wholesale markets
can also provide signals for the most opportunistic location to site the renewable supply and shift incentives toward
renewables that have more capacity/reliability value (as long as policy and contract structures expose the sellers to
these wholesale market incentives).
FIGURE 4: REVENUE STREAMS AVAILABLE TO CLEAN ENERGY RESOURCES
100%
Share of Revenues (% of Total)
80%
Renewable
Energy Credits
60%
Capacity Market
Energy Market
40%
20%
0%
Offshore Wind Onshore Wind Solar Nuclear
Sources and Notes: Approximate revenue streams informed by data in “2022-2023 BRA Default MOPR Floor Offer Prices for New Entry Capacity
Resources with State Subsidy,” PJM Interconnection, and “CONE and ACR Values – Preliminary,” Monitoring Analytics, accessed February 9, 2021.
The wholesale markets further offer balancing services to complement the output profiles of intermittent resources
and maintain reliability, creating opportunities to integrate higher volumes of renewables even under a traditional
design (though reforms will be needed to support the current pace of transition). 14 The “network access” approach
13
“Comparison of Renewable Portfolio Standards (RPS) Programs in PJM States,” Environmental Information Services, PJM
Interconnection LLC, August 2020. RGGI states include VA, MD, DE, NJ, and soon PA. RPS programs include 52.5×2030
NJ; 52.5×2030 MD; 100×2032 DC; 18×2020 PA; 40×2035 DE; 50x2040 IL; 8.5×2026 OH; 12.5×2021 NC; 15×2021 MI;
100x2045/50 VA; 10×2025 IN; none in WV, KY, TN. Most states have additional clean energy policy support programs
beyond RPS including for GHG reductions, or support for nuclear, battery, DR, EE or other clean energy resources.
14
See PJM Interconnection, “Reliability & Renewable Integration Study,” May 4, 2021.
Toward 100% Carbon-Free Electricity | 10to ensuring transmission sufficiency ensures that clean energy resources across the PJM system are simultaneously
deliverable to load centers. The District and several states including Maryland, Delaware, and New Jersey allow
RECs to be purchased across state lines to help meet their clean energy goals and access lower-cost clean energy.15
For states participating in RGGI, the carbon prices imposed on fossil fuel resources are incorporated into the supply
cost considered by PJM, making higher-emitting resources appear more expensive, causing them to operate less
and reduce their emissions. These features of the broad regional marketplace can substantially reduce the costs of
meeting decarbonization goals, particularly where the markets and policy structures are designed in complementary
ways.
State policies to support clean energy resources also impact the wholesale markets, primarily by displacing fossil
resources and driving lower prices in the energy and capacity markets. Most clean energy resources have zero
variable or fuel cost and so offer into the energy market at a zero or negative price, thus incrementally reducing
wholesale energy prices. In the capacity market, additions of clean energy resources also tend to reduce capacity
prices and displace other types of supply. Renewable resources do not displace fossil capacity on a one-for-one MW
basis, however. They tend to have lower capacity ratings, given their intermittency and lower average availability to
meet peak system needs.16
D. Challenges Anticipated in Clean Energy Transition
The rules of PJM and other regions’ power markets were developed at a time when the resource mix was dominated
by large central power stations, fossil fuel resources, and when state clean energy goals were modest. Consequently,
to some extent, the market design is a product of the assumptions and resource mix relevant at that time, many of
which are no longer valid.
Looking ahead, a new market design aligned with a
decarbonized energy grid would assume that clean energy Power markets were developed at a
resources including renewables, distributed generation, time when the system was dominated
batteries, nuclear, hydro, and demand response will by large, central power systems. To
increasingly dominate the resource mix. Consumers and
PJM must be able to rely on these emerging resources to some extent, the current market design
fulfill increasing shares and eventually 100% of all is a product of the assumptions and
reliability needs, at least within those sub-regions serving resource mix at the time, but that are no
jurisdictions that choose to adopt 100% clean electricity longer relevant.
mandates. A market designed in alignment with this future
could still use many features of the current PJM marketplace, including the approach to rely on technology-neutral
product designs, competitive markets for procuring the needed reliability and energy products, minimizing barriers
to entry, maintaining transparency in market parameters and pricing, and robust monitoring and mitigation.
However, many other aspects of the capacity market and other wholesale power markets may need to evolve to
match the needs of the grid in transition, including:
• Redirecting market incentives to achieve policy goals, rather than maintaining the traditional approach of
assuming that the markets must remain indifferent to policy goals,
• Enabling new technologies to participate in all markets so as to support innovative solutions for the clean grid,
and
15
“State RPS Fulfillment,” Monitoring Analytics, October 2019.
16
The capacity value of intermittent and energy limited resources tends to decline further as penetration levels of a particular
resource type grows. See, for example, PJM Interconnection “How Effective Load Carrying Capability (“ELCC”) Accreditation
Works,” April 20, 2021.
Toward 100% Carbon-Free Electricity | 11• Re-evaluating and refining reliability needs in consideration of a different anticipated set of resource
capabilities, system uncertainties, and resource mix that will be available to serve these reliability needs.
Policymakers and customers demand the clean power grid needed to address the crisis of climate change. The
transition to a clean energy future must happen, and will happen, with or without a working wholesale power market.
But the transition to clean energy can be faster, better, more reliable, and more affordable if the power markets are
reformed to focus incentives toward achieving policy goals.
The Minimum Offer Price Rule
The PJM Minimum Offer Price Rule (MOPR) has been the focus of a contentious debate across the PJM region for
several years, escalating to an unsustainable point in December 2019 when the FERC ordered PJM to expand the
rule so expansively as to exclude essentially all new (and some existing) clean policy resources from participation in
the PJM capacity market.17 Anticipating excess costs and interference with achieving their policy goals, commissions,
legislators, and other policymakers across the footprint expressed intent to exit the PJM capacity market if the rule
were not repealed. 18 This study was initiated, in part, as a means to inform Washington, DC policymakers about the
potential costs of MOPR and describe the process that would be utilized if the District would choose to exit the PJM
capacity market under the Fixed Resource Requirement (FRR). We find that if the MOPR were kept in place it could
apply to approximately 394 UCAP MW of the District’s policy resources by 2030, imposing approximately $34 million
per year in excess costs on electricity consumers in the District. Exiting the PJM market under FRR in concept could
be utilized to mitigate these costs, but would pose implementation risks and result in the loss of economic benefits
from participating in the regional PJM marketplace.
As of September 2021, the expansive MOPR has been repealed. 19 The revised MOPR approach relegates the rule to
a much narrower role designed to address instances of intentional market manipulation (not to interfere with or undo
the effects of policy mandates). 20 The repeal is in effect as of the 2023/24 capacity auction.
A. History and Status of the Minimum Offer Price Rule
Originally, the MOPR was designed as a mechanism to protect the capacity market from the exercise of buyer-side
market power. Specifically, schemes where large net buyers or their contractual counterparties could offer a small
amount of uneconomic supply into the market below cost in order to artificially suppress market-clearing prices.21
By taking a loss on that small sell position, a large net buyer could then benefit from low prices on a much larger
buy-side position in the market. The MOPR was originally intended to ensure that entities with the incentive and
ability to engage in manipulative price suppression would be unable to do so by requiring their capacity market offers
to reflect their full costs. Uneconomic new resources sponsored by large net buyers would fail to clear (or would set
the prices at a higher level) and prevent the entity from achieving the benefits of manipulative price suppression.
17
Calpine Corporation et al. v. PJM Interconnection, L.L.C, 169 FERC ¶ 61,239 (December 19, 2019).
18
The utility serving most of Virginia’s demand did exit the capacity market via FRR, and formal investigations of exiting via
FRR have been pursued in Maryland, New Jersey, and Illinois. See also See PJM Interconnection, Revisions to Application
of Minimum Offer Price Rule, filed before the Federal Energy Regulatory Commission July 30, 2021, Docket No. ER21-2582-
000, pp. 12-13.
19
See PJM Interconnection “Revisions to Application of Minimum Offer Price Rule” filed before the Federal Energy Regulatory
Commission July 30, 2021 in Docket No. ER 21-2582-000. PJM’s proposed repeal has taken effect as of September 29,
2021, though there is a continued possibility of appeal, see Federal Energy Regulatory Commission, Notice of Filing Taking
Effect by Operation of Law, September 29, 2021, Docket No. ER21-2582-000.
20
See PJM Interconnection, Revisions to Application of Minimum Offer Price Rule, filed before the Federal Energy Regulatory
Commission July 30, 2021, Docket No. ER21-2582-000.
21
A “net” buyer is one whose purchases are larger than their sales. If an entity has a large net buyer position, they would
have the incentive to suppress capacity prices in order to secure power at lower total costs.
Toward 100% Carbon-Free Electricity | 12Symmetrical rules are imposed on large net sellers of capacity in order to prevent them from exercising economic
or physical withholding.
In December 2019, the FERC issued an order expanding the scope of MOPR to apply to new or existing resources
that receive state subsides, such as RECs and zero emissions credits (ZECs). 22 Exemptions would apply only to
existing resources that have previously cleared an auction or new resources that had an interconnection agreement
prior to the December 2019 order. The rationale for the expanded MOPR was accepted by the FERC as of the
December 2019 order. At the time, the FERC’s rationale for having expanded MOPR to policy-supported resources
was to “protect” prices in the competitive market from being suppressed by state-sponsored resource planning
decisions. State policy support will tend to attract incremental clean energy supply, displace generation that would
otherwise be built (or allow additional aging plants to retire), and reduce prevailing capacity market prices. Under
the FERC’s theory as of the December 2019 order, these lower prices amount to an artificial suppression of market
prices; applying an expanded MOPR “corrects” market prices to the higher level that would prevail absent states’
policies. 23
The theory utilized to advance the expanded MOPR is based on faulty economics and inconsistent logic. Instead,
state policies aim to address the market’s failure to recognize environmental externalities, such as carbon and other
air pollutants emitted in the production of electricity. Renewable energy credits and other forms of support for
carbon-free generation technologies is a rational attempt to recognize the value of the environmental externalities. 24
While the policy support these resources receive does reduce their net cost of providing capacity, the intent of clean
energy incentives is not to affect wholesale market prices, but to incent the transition to cleaner sources of electricity.
The “competitive” cost of providing capacity for these policy resources can be low, or even zero, as they are primarily
developed for other reasons other than for earning capacity payments. Imposing a price floor on such resources and
ignoring the capacity value they provide distorts the market, rather than correcting it. Excluding policy resources
causes the market to procure more capacity than needed and improperly raises prices above the level corresponding
to actual supply and demand conditions.
Figure 5 illustrates the impact of MOPR on the ability of policy resources to clear the capacity market. The “No MOPR”
scenario on the left illustrates clearing outcomes if all capacity resources are allowed to offer at their preferred offer
price. Many policy resources would prefer offer at a near-zero price, especially if they would be developed regardless
of the capacity revenues they receive. Fossil plants and other capacity resources’ competitive offer prices would
typically reflect the payments needed to cover their net avoidable going-forward costs (that is, economic costs they
will incur as a result of providing capacity in the delivery year that they would not otherwise incur). Clearing prices
are set at the intersection of supply and demand, as illustrated on the left panel of Figure 5.
The right-hand panel, however, illustrates the application of MOPR to a policy resource. The MOPR raises the offer
price of the policy resource relative to the No MOPR scenario and reorders the capacity market offer supply curve.
As the MOPR level exceeds the capacity clearing price, the policy resource does not clear, and the market’s
incremental capacity need is met by fossil resource C at higher price.
22
Federal Energy Regulatory Commission (FERC), “Calpine Corporation et al. v. PJM Interconnection, L.L.C., Order Establishing
Just and Reasonable Rate,” 169 FERC ¶ 61,239 (issued December 19, 2019).
23
Calpine Corporation et al. v. PJM Interconnection, L.L.C, 169 FERC ¶ 61,239 (December 19, 2019).
24
For a comprehensive discussion of the uneconomic basis of the MOPR, see Spees and Newell, “The Economic Impacts of
Buyer-Side Mitigation in New York ISO Capacity Market,” filed before the Federal Energy Regulatory Commission on
November 18, 2020, Docket No. EL21-7-000.
Toward 100% Carbon-Free Electricity | 13FIGURE 5: IMPACT OF MOPR TO EXCLUDE POLICY RESOURCES AND INCREASE CAPACITY
MARKET PRICES
Overall, applying MOPR to policy-supported resources in the District can be expected to lead to the following
undesirable effects:
• Limiting the ability for clean energy resources to generate revenue and interfere with the District’s 100% by
2032 RPS.
• Retaining uneconomic high volumes of capacity supply that is unnecessary for reliability.
• Hinder the District’s transition to relying entirely on renewable resources by retaining aging fossil plants within
the capacity market.
• Causing higher market clearing prices exceeding the level corresponding to actual supply conditions and causing
a large wealth transfer from customers to incumbent suppliers.
• Driving an unsustainable market as these distortions become larger over time under the District’s statutory
mandate to achieve 100% renewable electricity by 2032.
All of these challenges are amplified by the fact that several other states across the PJM region have made similarly
strong commitments to clean energy including New Jersey at 100% clean by 2050, Maryland at 100% clean by
2040, Virginia at 100% renewable by 2045/2050, and Illinois at 100% clean energy by 2045. 25 The expanded MOPR
ruling initiated extensive rehearing requests and compliance filings. As a result, there have been significant delays
to the PJM capacity auction schedule; the planning year 2022/23 auction that was originally scheduled for spring
2019 was rescheduled for mid-2021 26 Auctions for the subsequent planning years will be conducted on a
compressed schedule approximately every six months until the market resumes its normal schedule with a May
25
See PJM-Environmental Information System “Comparison of Renewable Portfolio Standards (RPS) Programs in PJM States,”
and “Landmark Ill. climate bill passes in boon for nuclear, renewables,” E&E News Energy Wire.
26
See the PJM capacity market schedule in Pete Langbein, “Update on Base Residual Auction Schedule,” PJM Interconnection,
L.L.C., November 19, 2020.
Toward 100% Carbon-Free Electricity | 142024 auction for the delivery year 2027/28. As of last month, PJM’s proposal to repeal MOPR has taken effect, so
these uneconomic outcomes will be eliminated from the PJM markets prior to the 2023/24 capacity auction. 27
B. Implications for the District
The 2019 MOPR expansion ordered by the FERC imposes an offer price floor on new resources that could gain policy
support or utility investments within District of Columbia. Specifically, subsidized resources that either did not clear
the BRA previously or signed interconnection agreements after the order are subject to the MOPR. Because the
District set ambitious RPS targets by 2032, a large volume of resources will need to be developed to meet these
needs and thus would be subject to the MOPR as summarized in Figure 6. Note that the quantity of resources subject
to MOPR is reported in units of derated UCAP MW that are used within the capacity market, a value that is
substantially below the nameplate capacity rating of the resources that will be needed to meet the District’s
renewable mandates. The majority of in-city solar resources used to meet the solar carve out will not be subject to
MOPR, because they are accounted for as demand reductions (rather than supply resources) and so are not
individually tracked or mitigated in the capacity market.
FIGURE 6: DISTRICT OF COLUMBIA POLICY RESOURCES AT RISK OF NOT CLEARING BECAUSE
OF MOPR
500
DC Policy Resources Subject to MOPR (UCAP MW)
450 DC Solar
400 Tier 1 Out of
DC Solar
350
300
250
200
Tier 1 Out of
150 DC Wind
100
50
0
2020 2021 2022 2023 2024 2025 2026 2027 2028 2029 2030 2031 2032
Sources and Notes: Brattle analysis based on RPS specified in D.C. Law 22-257, CleanEnergy DC Omnibus Amendment Act of 2018, compiled by
PJM Environmental Information Services, “Comparison of Renewable Portfolio Standards (RPS) Programs in PJM States,” April 30, 2021. Solar and
Wind capacity is inclusive of the approximate 154 GWh of PEPCO contracts currently in RFP phase, as proposed by PEPCO in Formal Case No.
1017. UCAP Capacities are calculated based on assumed capacity values from PJM Interconnection, “Preliminary ELCC Results,” April 30, 2021.
The increasing UCAP MW of capacity subject to MOPR manifests itself in approximately $30 million of customer
costs annually. Specifically, our analysis indicates that MOPR will cost customers approximately $39 million in costs
in 2025 and $34 million in $2030. Costs associated with bilateral contracts increase with MOPR because renewable
generators are less likely to clear with the price floor in effect. Because fewer renewable generators clear, those
generators forego capacity revenues and therefore contract costs rise. Capacity costs increase for renewable
generators with the MOPR because fewer resources clear when MOPR is in effect, raising capacity costs.
27
See PJM Interconnection “Revisions to Application of Minimum Offer Price Rule” filed before the Federal Energy Regulatory
Commission July 30, 2021 in Docket No. ER 21-2582-000. PJM’s proposed repeal has taken effect as of September 29,
2021, though there is a continued possibility of appeal, see Federal Energy Regulatory Commission, Notice of Filing Taking
Effect by Operation of Law, September 29, 2021, Docket No. ER21-2582-000.
Toward 100% Carbon-Free Electricity | 15FIGURE 7: CUSTOMER COSTS IMPOSED BY MOPR
$250
Customer Costs ($ millions per year)
$207
$200 $180
$39 Status Quo Costs
$64
$34 Costs Below
$150 $74
$53 Status Quo
$56 Contract Costs
$100
$143
$50 $115 $106 $89 Capacity Costs
$0
MOPR NO MOPR MOPR No MOPR
2025 2030
Sources and Notes: Analysis based on PJM clearing prices previously published from The Brattle Group, “Alternative Resource Adequacy Structures
for New Jersey,” May 25th 2021, Load forecast data from PJM Interconnection, “PJM Load Forecast Report January 2021,” May 25th 2021, and
PJM Interconnection, “2022-2023 RPM Base Residual Auction Planning Parameters,” May 25th 2021.
C. The Fixed Resource Requirement Alternative
As one approach available for reconciling concerns with MOPR or the resource mix, the District could with draw from
participation in the PJM capacity market and utilize the Fixed Resource Requirement (FRR) alternative to meeting
capacity needs. Under the FRR alternative, the District would take control over the capacity supply mix serving
Washington, DC consumers and utilize its own chosen approach to meeting resource adequacy needs. Procured
resources would be submitted to PJM three years before delivery as the state’s FRR plan for meeting total and
locational capacity requirements. Once FRR is selected, the District would be required to continue using FRR to meet
capacity needs for a minimum of five years. The FRR alternative is not a single design option, but instead an open-
ended opportunity for the District to determine any and all features of how capacity needs could be met. The open-
ended nature of the FRR alternative is an opportunity and a challenge in that the District would need to develop its
own, new approach to meeting resource adequacy needs, or else could engage with other leading clean energy
states to develop a multi-state FRR approach to meeting capacity needs in alignment with policy requirements.
FRR DESCRIPTION AND PROCEDURES
Since its inception, the PJM capacity market has included provisions for the FRR alternative that can be utilized by
any qualified entities that wish to procure capacity outside the PJM capacity market on behalf of their customers.
The FRR was originally designed to fit the needs of vertically integrated utilities that conduct resource planning and
that do not wish to have uncertainty in the quantity of capacity requirements that can be produced by the sloped
demand curve.
Though not originally intended for this purpose, the District can elect to exercise the FRR alternative to limit the
impact of the expanded MOPR on District policy resources, and/or to allow the District (rather than capacity market
pricing signals) to determine its capacity supply mix. The FRR construct requires that a sufficient capacity resources
be procured to meet total and location-specific capacity requirements and remains agnostic as to how the resources
Toward 100% Carbon-Free Electricity | 16You can also read