Towards a regional mapping of vine water status based on crowdsourcing observations - OENO One
←
→
Page content transcription
If your browser does not render page correctly, please read the page content below
DOI:10.20870/oeno-one.2022.56.2.5442 OPEN ACCESS ORIGINAL RESEARCH ARTICLE Towards a regional mapping of vine water status based on crowdsourcing observations Léo Pichon1*, Guilhem Brunel1, Yulin Zhang1 and Bruno Tisseyre1 1 ITAP, Institut Agro Montpellier, INRAE, University of Montpellier, Montpellier, France This article is published in cooperation with Terclim 2022 (XIVth International Terroir Congress and 2nd ClimWine Symposium), 3-8 July 2022, Bordeaux, France. ABSTRACT *correspondence: Monitoring vine water status is a major challenge for vineyard management because it influences leo.pichon@supagro.fr both yield and harvest quality. It is also a challenge at the regional scale for identifying periods of Guest associate editor: high-water restriction or zones regularly impacted by water stress and changes of these impacts Philippe Vivin over the years. This information is interesting for defining collective strategies, anticipating harvest logistic issues or applying for irrigation authorisation. At this spatial scale, existing tools and methods for monitoring vine water status are few and often require strong assumptions and/or parameters to be defined exhaustively (e.g. water balance model). This paper proposes Received: to consider a collaborative collection of observations by winegrowers and wine industry 28 February 2022 stakeholders (crowdsourcing) as an interesting alternative. Indeed, it allows the collection of a Accepted: large number of field observations while pooling the collection effort. However, the feasibility 21 April 2022 of such a project and its interest in monitoring vine water status at regional scale has never been Published: tested. 24 June 2022 The objective of the article is to explore the possibility of making a regional map of vine water status based on crowdsourcing observations. It is based on the free mobile application ApeX-Vigne, which allows the collection of observations of vine shoot growth. This information is easy to collect and can be considered, under certain conditions, as a proxy for vine water status. Nearly 5,000 observations were collected by winegrowers and wine industry stakeholders during This article is published under 2019, 2020 and 2021 seasons. Vine shoot growth maps were derived from this dataset at regional the Creative Commons scale and its ability to monitor temporal evolution of these maps was studied. This article also licence (CC BY 4.0). proposes an analysis of the factors that favoured the number of observations collected. These Use of all or part of the content results open up new perspectives for monitoring vine water status at the regional scale, they also of this article must mention provide references for other crowdsourcing projects in viticulture. the authors, the year of publication, the title, the name of the journal, the volume, the pages KEYWORDS: citizen science, crowdsensing, decision support, precision viticulture, smartphone, and the DOI in compliance with spatial analysis, Vitis vinifera the information given above. OENO One | By the International Viticulture and Enology Society 2022 | volume 56–2 | 279

Leo Pichon et al.

 INTRODUCTION in biodiversity monitoring for the collection of observations
 on fauna (Prudic et al., 2017) and flora (Marcenò et al.,
Water restriction is a major issue in viticulture as it influences 2021) by enthusiastic amateurs. In this case, participants
vegetative growth (Pellegrino et al., 2005), yield (Medrano contribute mainly for altruistic or collectivist motivations,
et al., 2003) and grape quality (van Leeuwen et al., 2009). i.e. to be of service to others (e.g. scientists) or to serve the
Its impact on vineyard performance depends on its intensity, interest of a group (e.g. the botanist community) (Batson
duration and period of occurrence (Mirás-Avalos and Silva et al., 2002). In agriculture this type of project is less
Araujo, 2021). Monitoring vine water status allows this developed but initiatives are emerging (Minet et al., 2017).
water restriction to be characterised. Therefore, it plays a Participants are often professionals who collect observations
particularly important role in vineyard management and as part of their daily activity. In this case, the motivations
decision support. Consequently, numerous tools have been are rather egoist, i.e. the participants contribute to answer a
developed to measure or estimate vine water status at field question they have or to serve their own interests (Batson
level (Rienth and Scholasch, 2019). et al., 2002). The collaborative collection project is in this
At regional scale, monitoring vine water status makes it case, only an unintended consequence of their individual
possible to understand and anticipate the major trends at action.
work. It allows the organisations that support growers to The potential of crowdsourcing projects in collecting a
identify periods of high-water restriction or zones regularly significant amount of observations at a regional scale seem
impacted. At this scale, monitoring vine water status allows to meet the challenges of monitoring vine water status at
cooperative wineries, producers' unions or chambers of this spatial scale. Nevertheless, this approach has never been
agriculture to set up a collective strategy, to anticipate tested. Beyond this potential, the capacity of a crowdsourcing
harvest logistic issues, to apply for irrigation authorisation or project to motivate enough stakeholders in the wine industry
to define sectors for which irrigation equipment must be set to participate is unknown. The capacity of the collected
up in priority. In some cases, this monitoring can also be used observations to describe the spatial and temporal evolution
to broadcast generic and often free advice to the winegrowers of vine water status at different regional scales despite the
of a territory (Bécart et al., 2020). Finally, vine water status diversity of cultivars or agricultural practices is not known
is one of the major determinants of terroir effect (Willwerth either. Therefore, the objective of this article is to explore
and Reynolds, 2020). However, effects of climate change the potential of crowdsourcing observations to carry out
have important consequences on vine water status (Mosedale temporal and spatial monitoring of vine water status at
et al., 2016) and should modify our knowledge of vineyard different regional scales. This article also aims to verify
terroirs. It is therefore necessary to have tools to describe whether an egoist motivation of participants is sufficient to
vine water status at regional scale and its change over the ensure this monitoring.
time as objectively as possible (Brillante et al., 2020).
Tools available to monitor vine water status at a scale larger MATERIALS AND METHODS
than the field (i.e. regional scale) are mainly based on the
measurement of environmental factors that may influence 1. Collection of crowdsourcing observations
water status such as soil or meteorology (Bramley et al., 2020). The approach was tested with a crowdsourcing project called
In some cases, these data are also used to feed mechanistic ApeX-Vigne. Participants were stakeholders of the wine
models in order to predict plant behaviour (Naulleau et al., industry (winegrowers and advisors). Observations about
2022). Remote sensing can also be complementary to these vine water status were made using a method based on the
approaches (Laroche-Pinel et al., 2021) as it allows for large- measurement of vine shoot growth. They were collected
scale measurement of vine characteristics that can be related using a mobile application. The following sections present
to plant water status (Pagay and Kidman, 2019). However, the observation method and the mobile application.
the weakness of all these methods lies in the fact that they
are not based on direct measurements of the plant. Therefore, 1.1. Monitoring vine water status with shoot growth
they require strong assumptions to be made and present a observations
significant amount of uncertainty that can be detrimental for Observations were collected using vine shoot growth
decision support (Dell'Acqua et al., 2018). Moreover, these observation method described by Martinez-De-Toda et al.
methods require to estimate parameters that are difficult to (2010). Hereafter is a short description of the approach.
measure exhaustively at this spatial scale (e.g. soil water The reader will find more details on its implementation in the
holding capacity). context of southern France in Pichon et al. (2021).
Crowdsourcing offers interesting opportunities to collect in Pellegrino et al. (2005) demonstrated that when water access
situ observations at regional scale (Simoes and Peterson, becomes a limiting factor, vine shoot growth slows down
2018). This approach consists in carrying out a complex task and then stops. Martinez-De-Toda et al. (2010) proposed an
(i.e. collecting observations on an entire region) by relying operational method based on this principle by demonstrating
on a community of contributors who carry out simpler unit that observations of vine shoot growth were correlated
tasks (i.e. collecting observations on a single field) and pool with stem water potential, a reference measurement of vine
their results (Brabham, 2008). Crowdsourcing is widely used water status. The method of vine shoot growth observation

280 | volume 56–2 | 2022 OENO One | By the International Viticulture and Enology Society

consists in observing 50 apexes (i.e. vine shoot tips) and A more detailed description of the application's technical classifying them according to three levels: i) full growth features can be found in Brunel et al. (2019). (FG), ii) moderate growth (MG) and iii) stopped growth ApeX-Vigne has two main screens for collecting an (SG). Observations are summarized by an index S calculated observation (Figure 1.a) and interpreting the corresponding using the equation proposed by Martinez-De-Toda et al. vine water status (Figure 1.c). When the user starts a new (2010) (Eq.1). observation, he chooses a field and then observes and classifies Equation 1: each apex by clicking on one of the three corresponding buttons (Figure 1.a). Then, the user can calculate iG-Apex where wFG, wMG, wFG, correspond to the proportions of index in order to interpret the observation (Figure 1.c). full growth, moderate growth and stopped growth apexes respectively and SFG, SMG, SSG, correspond to coefficients ApeX-Vigne application records the date and position assigned to each of these growth levels. In the south of for each observation. The position is determined using France, the French Technical Institute of Vine and Wine the smartphone's GNSS receiver. The collected data is (Institut Français de la Vigne et du Vin – IFV) recommends automatically synchronised with a central database when the smartphone has a 3G signal (or better) or a Wi-Fi connection. that growers set these coefficients to respectively 1, 0.5 and In the event that an observation is collected in an area without 0 to define the index of Growing Apex (iG-Apex) (Payan, network coverage, it is stored on the smartphone and then 2020). These coefficients were considered to be the most synchronised when a network connection is available. When adapted to the context of this study. users download the application, they explicitly give their To better characterise the water status of their vineyards, consent for their observations to be used in research projects. users generally carry out weekly monitoring of vine shoot The data analysed in this article correspond to observations growth during the summer period. iG-Apex is generally close from the centralised database that were collected during to 1 around full bloom and then decreases down to 0 around the three seasons 2019, 2020 and 2021. Only observations veraison, as water restriction increases. collected during the summer period (June, July and August in our conditions) were taken into account. It was considered 1.2. ApeX-Vigne mobile application that observations collected outside this period did not ApeX-Vine is a free mobile application that facilitates the correspond to a monitoring of vine water status and could be observation, calculation and interpretation of iG-Apex index. classified as outliers. Within the summer period of time, all This application is hybrid, which offers the possibility to collected observations were therefore considered as relevant. deploy it on several platforms. It is currently only available on the Android platform via the Google Play Store (https:// 1.3. Participation strategy play.google.com/store/apps/details?id=ag.GB.apex&hl=fr Identified participants were the stakeholders of wine industry last seen 23/02/2022). It was officially launched in June 2019. who contribute as part of their professional activity. From the FIGURE 1. Presentation of the ApeX-Vigne mobile application: (b) Main process for collecting and synchronizing observations using (a) the input screen and (c) the summary screen. OENO One | By the International Viticulture and Enology Society 2022 | volume 56–2 | 281
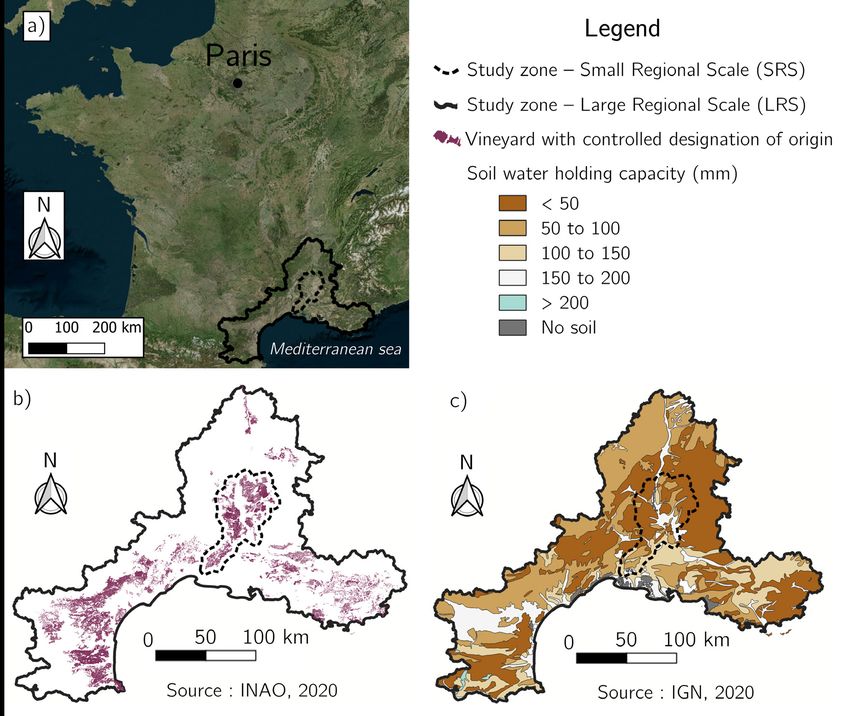
Leo Pichon et al. crowdsourcing projects in agriculture as described by Minet The approach was tested in southern France where two study et al. (2017), it was hypothesised that egoist motivation zones were defined (Figure 2.a): was the most appropriate to foster the contribution of The Large Regional Scale (LRS) study zone covers an area these potential participants. It was also hypothesised that of approximately 49,500 km2 encompassing the vineyards monitoring water constraint was a strong issue for them. of the Languedoc, Provence and Côtes du Rhône wine Therefore, ApeX-Vigne application was designed to activate regions. Its shape has been defined on the basis of nine this lever by giving them access to a free and simple tool French administrative departments. The area encompasses for assessing and monitoring vine water status of their own 57 different controlled designation of origin with > 300,000 fields. ha of vineyards and > 26,000 winegrowers (Agreste, 2020) (Figure 2.b). The soils of the region are diverse and the According to Rechenberger et al. (2015), a simple data majority of them have a low water holding capacity (Figure collection process favours the collection of a large number of 2.c). observations. The iG-Apex approach was chosen in this study The Small Regional Scale (SRS) study zone covers an area for this purpose, as it is simple to collect and to interpret. of approximately 4,750 km2, encompassing the vineyards For the communication about ApeX-Vigne mobile application, of several wine regions, including two main controlled emphasis was placed on the interest of this tool to answer designation of origin: Côtes du Rhône and Costières de to the individual challenges of wine sector's stakeholders. Nîmes. Its shape has been defined from a 5 km buffer around Information on the application was disseminated during the controlled designation of origin (Figure 2.b). Most technical days and in the specialised press. of the soils have a low water holding capacity (< 50 mm) (Figure 2.c). 2. Study zones The two study scales illustrate two different regional scales 2.1. Characteristics of the study zones at which the wine industry stakeholders monitor vine water FIGURE 2. Presentation of Small Regional Scale (SRS) and Large Regional Scale (LRS) study zones: (a) location of the study zones in France, (b) location of vineyards having a controlled designation of origin over the study zones (INAO, 2020) and (c) soil water holding capacity (in mm) over the study zones (IGN, 2020). 282 | volume 56–2 | 2022 OENO One | By the International Viticulture and Enology Society
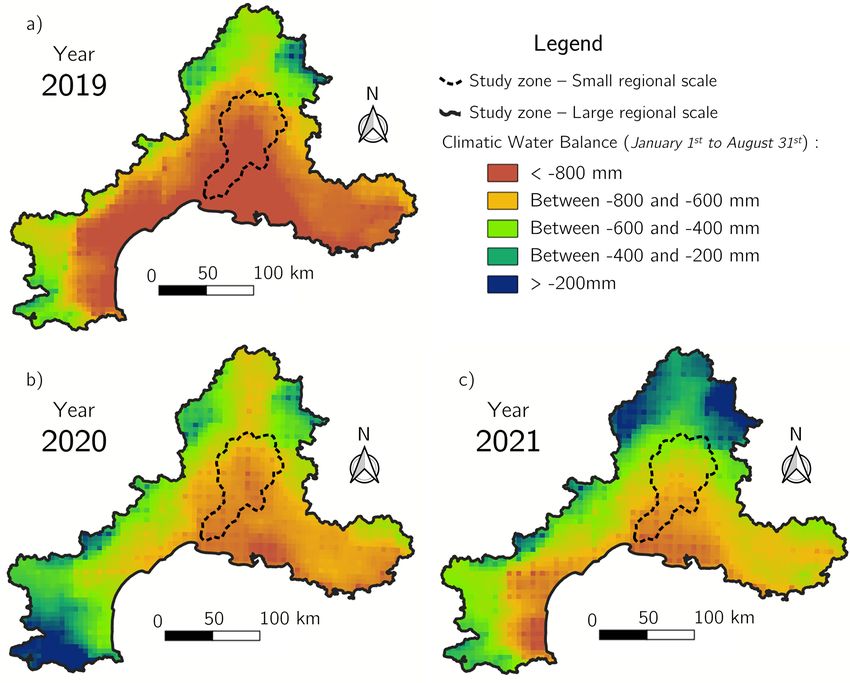
status and take decisions. For LRS, the main involved At the LRS scale, CWB values showed a large magnitude
stakeholder is generally the administration (i.e. state, region, of variation as well as spatial patterns over the three years
etc.) which seeks for example to define land use policies or studied (Figure 3). 2019 was a particularly dry year. CWB was
the research for climate change monitoring issues. For SRS, closed to -800 mm for the majority of the LRS (Figure 3.a).
pedoclimatic and socio-economic conditions are often more
 2020 was a less dry year with contrasting CWB values
homogeneous and the wine industry is often more organised
 between north and south of the LRS study zone (Figure 3.b).
(e.g. controlled designation of origin syndicate). In this case,
 2021 was a moderately dry year with a CWB gradient
vine water status is often monitored to ensure a collective use
 that decreases when approaching the Mediterranean coast
of water resource and possibly to justify irrigation requests.
 (Figure 3.c).
2.2. Climatic conditions LRS and SRS study zones are of interest because they are
Both LRS and SRS study zones are located in a located in regions with many vineyards and winegrowers.
Mediterranean climate with a high annual water deficit. They encompass a wide diversity of soils and socio-economic
The Climatic Water Balance index (CWB) is a simple but contexts. Their Mediterranean climate corresponds to that of
synthetic index to characterise the drought of a region or a many other vineyards in the world (California, South Africa,
vintage (Bandoc and Pravalie, 2015). It corresponds to the Southern Australia, etc.). Finally, low CWB values indicate
sum of daily precipitation minus the sum of daily potential that water resources are limited and therefore that monitoring
evapotranspiration. When integrated over a period of time, vine water status in time and space is a major issue in these
it represents the water deficit (or excess) of a region. In this regions both at LRS and SRS.
study, the drought of a given year was assessed by integrating
this index from January 1st to August 31st from SAFRAN 3. Approach to assess potential of
 crowdsourcing observations
weather data provided by Météo France on an 8x8km grid
(Météo France, 2022). 3.1. Characterisation of temporal dynamic

FIGURE 3. Climatic Water Balance (Bandoc and Pravalie, 2015) over the study zones calculated from January 1st
to August 31st for (a) 2019, (b) 2020 and (c) 2021 seasons.

OENO One | By the International Viticulture and Enology Society 2022 | volume 56–2 | 283
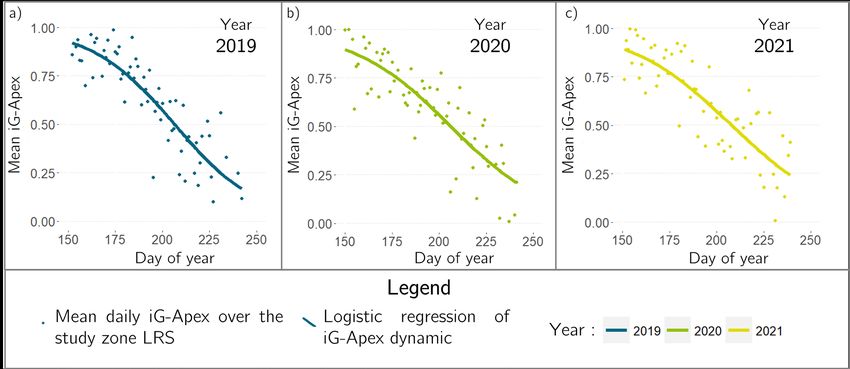
Leo Pichon et al. The ability of crowdsourcing data to characterise the RESULTS temporal dynamics of vine water status at the scale of LRS study zone was assessed by studying the evolution of the 1. Participants contributions daily mean value of iG-Apex. This evolution was modelled During each of the 2019 to 2021 seasons, between 1,000 and by a logistic regression often used in the literature to describe 2,000 observations were collected on the LRS study zone. the relationship between vegetative growth and vine water Contributors were between 60 and 90 depending on the season status (Lebon et al., 2006). This logistic regression was based and they collected observations on several hundred different on the following sigmoid function (Eq. 2): fields (Table 1). The number of observations collected during Equation 2: the first season (1,849 observations) increased slightly in 2020 (2,072 observations) and then decreased the following Where α is the inflection point and is the slope at year (1,294 observations). The number of users decreased inflexion point. The Root Mean Square Error (RMSE) was slightly between 2019 and 2021 from 87 to 65. Apart from used to assess the quality of the logistic regression. the launch year (2019) when the ApeX-Vigne application probably benefited from a curiosity effect, the annual number 3.2. Mapping and characterisation of spatial structure of new users remained relatively stable between 2020 and dynamic 2021, at around 50 (Table 1). On the other hand, the number When it comes to the description and measure of the spatial of people who collected observations even though they had variability, many indicators have been proposed in the already collected them the previous year decreased between literature (Leroux and Tisseyre, 2019). In this study, testing 2020 and 2021 (23 versus 15). if and how crowdsourcing data was spatially organised was The number of fields on which observations have been performed with a classical geostatistic approach aiming collected went from 1,659 in 2019 to 582 in 2021. However, at characterising the spatial auto-correlation of the data the number of fields on which temporal monitoring (temporal through a semi-variogram analysis (Leroux and Tisseyre, series of observations) has been carried out is 10 times higher 2019). Provided stationarity assumptions are verified, this in 2021 than in 2019 (158 versus 12). The rate of fields on approach provides a decomposition of the variance in two which only a single observation was collected also decreased components: i) random variance or nugget effect (c0) and ii) from 89.6 % in 2019 to only 48.3 % in 2021. spatially structured variance or the partial Sill (c1). These two components are derived from a semi-variogram model fitted The ApeX-Vigne application is used by stakeholders of the to the observed data. This approach was used at both scales, wine industry. The important share of new users compared to LRS and SRS and the proportion corresponding of variance people who use the application several years in a row can be corresponding to a spatial phenomenon was derived from interpreted by the profile of participants. In experimentation the ratio inspired by the Cambardella index (Cambardella or observation networks, tasks of regular observation of the et al., 1994). Finally, semi-variogram models were used to vineyard are often entrusted to seasonal workers or trainees. interpolate iG-Apex observations by kriging (Willwerth and These people install the application and then use it during one season. The following season, a new trainee or seasonal Reynolds, 2020). worker carries out the observations and then installs the 3.3 Tools and software application. Then, they are considered as a new user by the Analyses and graphs were performed using R 3.6.0 (R Core ApeX-Vigne application although same fields are monitored over two subsequent years. Team, 2022). Semi-variograms were fitted with gstat package using REML (Pebesma, 2004) and maps were produced using These results also show that users have changed the way Qgis 3.16.16-Hannover (QGIS Development Team, 2022). they use the mobile application between the launch season in TABLE 1. Figures on observations collected with ApeX-Vigne mobile application during 2019 to 2021 seasons over the Large Regional Scale (LRS) study zone. Year 2019 2020 2021 Total number of observations 1,849 2,072 1,294 Total number of users, including 87 70 65 New users 87 47 50 Users of previous years 0 23 15 Total number of fields, including 1,659 1,445 582 Fields with only 1 observation 1,486 1,168 281 Fields with temporal series of observations 12 143 158 284 | volume 56–2 | 2022 OENO One | By the International Viticulture and Enology Society

FIGURE 4. Evolution of mean iG-Apex during the season over the LRS study zone during years (a) 2019,(b) 2020
and (c) 2021.

FIGURE 5. Location of observations collected with ApeX-Vigne mobile application during 2019 to 2021 seasons:
a) overview of the Large Regional Scale (LRS) study zone and b) zoom on a location with particularly high density
of observations.

2019 and the 2021 season. Their use seems to have evolved 2. Evolution of vine water status at Large
from exploratory use aiming at just testing the potential Regional Scale: general trends
of the application to a more regular use with fewer fields The pooling of crowdsourcing observations allows average
observed but with a real monitoring based on time series of iG-Apex values to be studied across the entire LRS study
 zone for the three years of the study. Whatever the year
observations throughout the season. This evolution highlights
 under consideration, average iG-Apex values were close to
how ApeX-Vigne application is adopted and used in a more 1 around day 150 and then gradually decreased to values
rational way by stakeholders of the wine industry. close to 0 around days 225 to 250 (Figure 4). This trend

OENO One | By the International Viticulture and Enology Society 2022 | volume 56–2 | 285

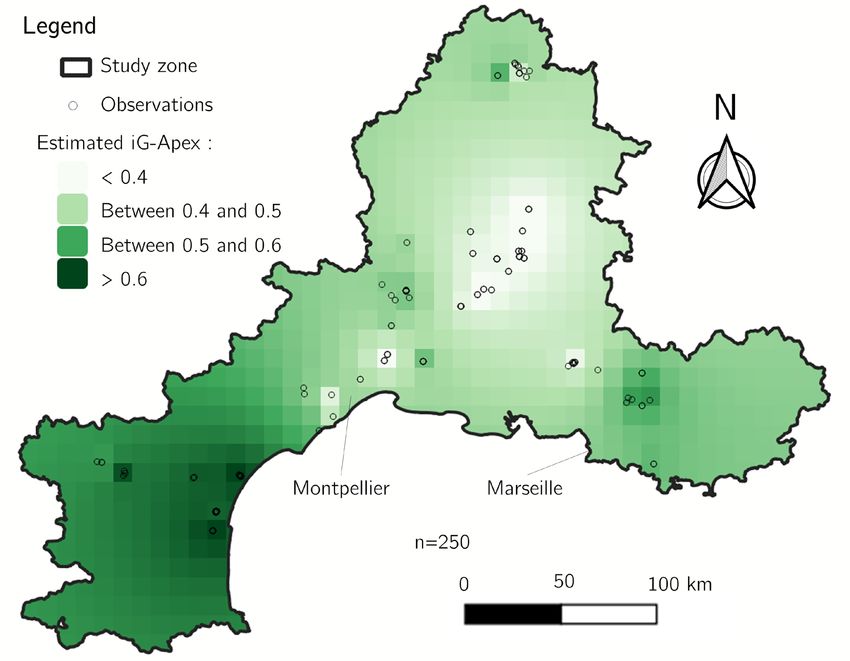
Leo Pichon et al.

of generalised cessation of shoot growth across the LRS 4. Mapping vine water status at Large
study zone was observed in all three years studied. Given Regional Scale
the Mediterranean climate, this trend can be explained by The relatively dense spatial distribution of collected
a progressive installation of water restriction becoming observations makes it possible to produce interpolated
gradually a limiting factor of shoot growth. The dynamics of maps of iG-Apex at the scale of the LRS study zone for a
this cessation of shoot growth is relatively well modelled by given date. For example, during week 29 of year 2020, 250
a logistic regression with RMSE ranging from 1.20*10-1 to observations were collected. The rest of the analysis focuses
1.33*10-1 for the three years. on this example because many observations were collected
The slope at inflexion point is lower in 2021 than in 2019 that week. Note however that similar results were observed
( = 3.67*10-2 versus 4.49*10-2). These results can be in 2019 (194) and 2021 (157 observations).
interpreted in relation to the maps of CWB (Figure 3).
 Table 2 presents the results for these two years for illustrative
In 2019, CWB was more negative overall than in 2021
 purposes. The semi-variograms model of iG-Apex values
illustrating a more severe drought. This may have led to a
 observed over the week 29 of year 2020 shows that the
quicker cessation of shoot growth in the LRS study zone than
 nugget effect (c0) was 1.94*10-2 and the spatially structured
in 2021, resulting in higher slope at inflexion point.
 variance (c1) was 8.83*10-2 (Table 2). 82 % of the variability
3. Spatial repartition at Large Regional Scale observed at this date was therefore not random but strongly
of crowdsourcing ApeX-Vigne observations organised spatially which highlights the relevance to map
Geolocation of crowdsourcing observations allows the iG-Apex at the LRS scale.
general description of these trends at the scale of the LRS The spatial organisation of iG-Apex values is confirmed by
study zone to be complemented by a spatial analysis. the analysis of the kriged map at the scale of the LRS study
Observations were collected throughout the LRS study zone zone (Figure 6). To facilitate the visualisation of iG-Apex
during the three studied seasons (Figure 5.a). Comparison of spatial organisation, this kriged map is represented over the
the map of collected observations with the map of vineyards whole LRS study zone. However, interpretation should be
within controlled designation of origin areas (Figure 2.b) done considering that an estimation of iG-Apex only makes
indicates that observations were found in most vineyards of sense in areas where vineyards are present.
the LRS study zone. The density of observations is highest in
the southern part of the LRS (i.e. close to the Mediterranean The imprecision associated to these estimates is of the nugget
Sea). Particularly high densities of observations occurred effect’s order (c0 = 1.94*10-2) close to the observations and
locally in several sectors of the LRS study zone. In some of sill’s order (c1+ c0 = 1.07*10-1) for estimates at a distance
cases, this density has been observed every year (e.g. of any observation higher than the range (~ 100 km). On
sector near Montpellier). In other cases, the high density week 29 of year 2020, the central zone shows iG-Apex
was observed only for one year (e.g. sector near Marseille) values globally lower than 0.4 while the South-western zone
(Figure 5.b). These high-density areas often correspond to shows higher iG-Apex values, in some cases above 0.6. The
a geographical unit as is the case for example in figure 5.b. map highlights several gradients of iG-Apex values among
All observations in the dense zone were collected within the which the South-Western vs North eastern one is the most
same controlled designation of origin area. This result can significant. Considering the CWB map for the year 2020
be interpreted by a local dynamic supported by the farmers (Figure 3.b), there is a correspondence between zones with
or the controlled designation of origin syndicate that favours the lowest iG-Apex values in week 29 and the lowest CWB
participation in this specific zone. in 2020.

TABLE 2. Parameters from the semi-variogram model TABLE 3. Parameters from the semi-variogram model
resulting from iG-Apex observations collected with ApeX- derived from iG-Apex observations collected with
Vigne mobile application over the Large Regional Scale ApeX-Vigne mobile application over the Small Regional
(LRS) study zone during week 29 of years 2019, 2020 Scale (SRS) study zone during weeks 25 and 29 of year
and 2021. 2020.

 Spatially structured c1 Spatially c1
 Nugget effect Nugget
 Year variance Number of structured
 (c0) (c1+ c0) Week effect (c1+ c0)
 (c1) observations variance
 (c0)
 (c1)
 2019 1.00*10-2 3.29*10-1 97 %
 25 145 2.02*10-2 3.91*10-2 66 %
 2020 1.94*10-2 8.83*10-2 82 %
 29 61 1.69*10-2 1.83*10-2 48 %
 2021 1.25*10-2 2.10*10-1 94 %

286 | volume 56–2 | 2022 OENO One | By the International Viticulture and Enology Society
FIGURE 6. Kriged iG-Apex values over the Large Regional Scale (LRS) study zone. Map made from observations
collected with ApeX-Vigne mobile application during week 29 of year 2020.

FIGURE 7. Example of interpolated iG-Apex maps over the Small Regional Scale (SRS) study zone made from
observations collected with ApeX-Vigne mobile application during (a) week 25 and (b) week 29 for year 2020.

These results show the potential of crowdsourced iG-Apex at The semi-variograms model of iG-Apex values show that the
the scale of the LRS to highlight spatial variability. The high nugget effect (c0) was 2.02*10-2 in week 25 and 1.69*10-2 in
density of observations collected in certain areas makes it week 29. The spatially structured variance (c1) was 3.91*10-2
possible to consider going further by producing maps of this and 1.83*10-2 respectively. The share of spatially structured
same index at smaller spatial scales. variance thus decreased from 66 % in week 25 to 48 % in
 week 29.
5. Mapping vine water status at Small These results are confirmed by the two corresponding
Regional Scale maps. In some regions of the SRS study zone, observations
At the SRS study zone scale, 145 observations were collected were collected in week 25 but not in week 29 (Figure 7).
in week 25 and 61 in week 29 of year 2020 (Table 3). Spatial organisation of iG-Apex values is generally weaker

OENO One | By the International Viticulture and Enology Society 2022 | volume 56–2 | 287
Leo Pichon et al. than maps of the LRS study zone. At this scale, values of to be considered, however, is the spatial dispersion of iG-Apex which differed significantly from those of their the contributions. Indeed, in the (extreme) case where all neighbourhood are clearly highlighted. These differences contributions are concentrated in a small area of the LRS, the may be due to specificities of the considered field (cultivar, resulting map would be of poor relevance over zones where farming practices, etc.) or to outliers. Given the information no contributions are made. The approach therefore assumes collected with the mobile application, it is difficult to analyse that the contributions are distributed in a regular or random further these results. However, it is worth mentioning that manner over the study area. Crowdsourcing observations despite the small number of observations available at this from ApeX-Vigne application also allow to collect spatially scale of work, it is possible to identify spatial phenomena, structured information and to produce interpolated iG-Apex temporal dynamics and also surprising observations. maps at this scale. Observations collected in the SRS study zone can also be interpolated but are less spatially structured. DISCUSSION At this scale, the quality of collected data seems to be too limited to describe satisfactorily vine water status. This issue Firstly, this study shows that egoist motivation implemented of quality of crowdsourcing data has already been widely in the ApeX-Vigne project has made it possible to collect addressed in the literature (Goodchild and Li, 2012). In the between 1,000 and 2,000 observations per year in the LRS case of this study, the quality of the data could be influenced study zone. This motivation factor was adequate to collect by several factors with a different impact depending on the observations in all the wine-producing regions of the study spatial scale considered: zone. The use of the mobile application by wine industry stakeholders has evolved over the three years studied. It is Other factors than water constraint may have influenced therefore likely that the motivations have also evolved over the vine shoot growth. This is the case, for example, for time. For example, in 2021, the CWB was globally higher cultivar and rootstock (Bota et al., 2016), cover cropping than the two previous years indicating a globally lower water (Delpuech and Metay, 2018) or farming practices (Reynolds, stress. The monitoring of vine water status was therefore 2010). In the ApeX-Vigne data, this information about the less important for the wine industry stakeholders than in the field was unknown. This uncertainty may potentially limit previous years. It seems reasonable to hypothesise that the the ability of iG-Apex to correctly describe vine water status. egoist motivation lever was less powerful in 2021, resulting However, the results of this study showed that despite this in a lower number of observations collected. This limitation limitation, collected observations allowed the mapping and of egoist motivation in crowdsourcing projects has already the identification of major trends in the evolution of vine been observed and described in the literature (Batson et water status at LRS. At SRS, the potential of these data is also al., 2002). One way of limiting this versatility is to activate important but the spatially structured part of the variance in other motivational levers. Altruism and collectivism are iG-Apex observations is lower. This study does not allow to particularly interesting because they promote participation explain whether this result is due to too few observations or and commitment over time (Asingizwe et al., 2020). In this to a too strong impact of other factors influencing vine shoot case, what motivates the participant to contribute is the desire growth at this scale. Future research should be conducted to belong to a group and to carry out a task collectively. This specifically at the SRS to answer this question. lever seems interesting to explore for the future of the ApeX- Vigne project and more broadly for crowdsourcing projects It is possible that outliers may have been collected into the in viticulture. It is likely that it cannot be activated in the same ApeX-Vigne application. The purpose of this study was not way at the SRS, where there is often an identified and coherent to identify these outliers but it can be considered that their collective (e.g. cooperative, controlled designation of origin number was relatively low. In the literature, crowdsourcing syndicate, etc.), as at the LRS scale, where the collectives are projects generally have around 1 to 3 % of outliers (Mehdipoor larger and less formally structured in the wine industry (e.g. et al., 2015). However, maps at the SRS have highlighted administrative region). Considering crowdsourced iG-Apex observations having attribute values different from their values are relevant to be monitored at this scale in relation to neighbourhood. These observations deserve special attention vine water restriction, future research should be conducted on because they may correspond to outliers to be eliminated the implementation of this lever and its capacity to reinforce (i.e. malicious operators, data entry or location errors, etc.) the quantity and quality of crowdsourcing data collected. but they may also correspond to surprising observations Secondly, results of this study show that observations (Senaratne et al., 2016) due for example, to different (and collected by crowdsourcing using ApeX-Vigne application maybe interesting) agricultural practices. The development allow to characterize the cessation of growth trend at of methods to automatically identify these observations is an the LRS study zone scale. The number of observations interesting area to explore. Some authors have, for example, collected over the study period seems to be large enough to used the autocorrelation of the phenomenon studied to characterise this trend despite variations in the density and identify these observations (Simoes and Peterson, 2018). location of observations over time. Considering a similar This approach seems interesting to explore in the case of contribution and even if the location changes from year ApeX-Vigne data, given the spatial structure of soil and to year, this result shows that relevant maps at this spatial climatic conditions that may influence vine water status at scale can be obtained from one year to another. A limitation regional scale (Ruffault et al., 2013). 288 | volume 56–2 | 2022 OENO One | By the International Viticulture and Enology Society
Results showed that observations were collected over the who financially supported this work in the framework of the entire LRS study zone. The higher density of observations crowd-viti project (repere project). The ApeX-Vigne project in the south of this study zone can be explained by a lower was part of the DATI project, supported by the French CWB in this area, which leads to a higher overall water National Research Agency under the Horizon 2020 PRIMA restriction and therefore a higher need for its monitoring. Program (ANR-21-PRIM-0001). This influence of the studied phenomenon on the spatial and temporal distribution of observations is relatively classic in crowdsourcing projects (Sullivan et al., 2009). At the SRS, the number and spatial distribution of observations varies REFERENCES between weeks 25 and 29. This phenomenon illustrates the Agreste, Recensement agricole (Census of Agriculture). (2020). Consulted difficulty of maintaining a large number of observations and on 23/02/2022. https://www.agreste.agriculture.gouv.fr/ spatial completeness throughout the season at this scale. It Asingizwe, D., Marijn Poortvliet, P., Koenraadt, C. J. M., van Vliet, A. J. H., raises the question of the motivation of participants to collect Ingabire, C. M., Mutesa, L., & Leeuwis, C. (2020). Why (not) participate observations and to keep on contributing over time. This in citizen science? Motivational factors and barriers to participate in a issue is central to crowdsourcing projects (Asingizwe et al., citizen science program for malaria control in Rwanda. PLoS ONE, 15(8 2020) and deserves to be studied in detail. August 2020). https://doi.org/10.1371/journal.pone.0237396 Bandoc, G., & Pravalie, R. (2015). Climatic water balance dynamics over Finally, these results illustrate the potential of this the last five decades in Romania ’ s most arid region, Dobrogea. Journal crowdsourcing project to characterise and spatialize a of Geographical Sciences, 25(11), 1307–1327. https://doi.org/10.1007/ vineyard characteristic at this scale. According to Brillante s11442-015-1236-1 et al. (2020), this characterisation is a major challenge because Batson, C. D., Ahmad, N., & Tsang, J. A. (2002). Four motives for climate change will modify our knowledge and understanding community involvement. Journal of Social Issues, 58(3), 429–445. of vineyards at regional scale. According to these authors, https://doi.org/10.1111/1540-4560.00269 it is necessary to build objective means to describe the Bécart, V., Vernière, A., Leonet, A., & Lacroix, R. (2020). Le journal du heterogeneity of vineyards at these spatial scales. To meet stress hydrique des côtes du Rhône. https://www.syndicat-cotesdurhone. this challenge, the potential of crowdsourcing data collected com/liste-articles/referentiel-stress-hydrique by the ApeX-Vigne application seems to be complementary Bota, J., Tomás, M., Flexas, J., Medrano, H., & Escalona, J. M. (2016). to other existing approaches such as meteorological data Differences among grapevine cultivars in their stomatal behavior (Bramley et al., 2020), remote sensing (Laroche-Pinel et al., and water use efficiency under progressive water stress. Agricultural 2021) or modelling (Naulleau et al., 2022). Water Management, 164(August), 91–99. https://doi.org/10.1016/j. agwat.2015.07.016 CONCLUSION Brabham, D. C. (2008). Crowdsourcing as a model for problem solving: An introduction and cases. Convergence, 14(1), 75–90. https://doi. ApeX-Vigne mobile application has been developed to org/10.1177/1354856507084420 collect data on vine water status by making observations on Bramley, R. G. V., Ouzman, J., & Trought, M. C. T. (2020). Making vine shoot growth. This application allows the gathering, sense of a sense of place: Precision viticulture approaches to the analysis geolocation and pooling of these observations. It makes it of terroir at different scales. Oeno One, 54(4), 903–917. https://doi. possible to consider a collaborative collection of observations org/10.20870/oeno-one.2020.54.4.3858 (crowdsourcing) at a regional scale. This study explored Brillante, L., Bonfante, A., Bramley, R. G. V, Tardaguila, J., & Priori, S. the potential of crowdsourcing observations collected by (2020). Unbiased scientific approaches to the study of terroir are needed! ApeX-Vigne application for temporal and spatial monitoring Frontiers in Earth Science, 8(November), 8–11. https://doi.org/10.3389/ of vine water status at two regional scales. It also tested feart.2020.539377 the hypothesis that an egoist motivation of participants is Brunel, G., Pichon, L., Taylor, J., & Tisseyre, B. (2019). Easy water sufficient to ensure this monitoring. According to the results, stress detection system for vineyard irrigation management. In Precision the amount of collected data was large enough to describe Agriculture 2019 - Papers Presented at the 12th European Conference on the trend of cessation of vine shoot growth at a large regional Precision Agriculture, ECPA 2019. https://doi.org/10.3920/978-90-8686- 888-9_115 scale during the three studied years. At this spatial scale, it was also possible to spatialize and to capture the spatial Cambardella, C. A., Moorman, T. B., Novak, J. M., Parkin, T. B., Karlen, structure of an index that may be linked, in Mediterranean D. L., Turco, R. F., et al., (1994). Field-scale variability of soil properties in central Iowa soils. Soil Science Society of America Journal, 58, 1501– conditions, to vine water status. At a smaller regional scale, 1511. https://doi.org/10.2136/sssaj1994.03615995005800050033x crowdsourcing data has stronger limitations. Motivation of participants by other levers than only selfish ones seem to be Dell’Acqua, F., Iannelli, G. C., Torres, M. A., & Martina, M. L. V. (2018). A novel strategy for very-large-scale cash-crop mapping in the context of an avenue to explore. weather-related risk assessment, combining global satellite multispectral datasets, environmental constraints, and in situ acquisition of geospatial ACKNOWLEDGEMENTS data. Sensors (Switzerland), 18(2). https://doi.org/10.3390/s18020591 Delpuech, X., & Metay, A. (2018). Adapting cover crop soil coverage The authors would like to thank the “Institut Français de to soil depth to limit competition for water in a Mediterranean vineyard. la Vigne et du Vin” for their involvement throughout the European Journal of Agronomy, 97, 60–69. https://doi.org/10.1016/j. project ApeX-Vigne. We also thank the Occitanie region eja.2018.04.013 OENO One | By the International Viticulture and Enology Society 2022 | volume 56–2 | 289
Leo Pichon et al.

Goodchild, M. F., & Li, L. (2012). Assuring the quality of volunteered Pellegrino, A., Lebon, E., Simonneau, T., & Wery, J. (2005). Towards a
geographic information. Spatial Statistics, 1, 110–120. https://doi. simple indicator of water stress in grapevine (vitis vinifera L.) based on
org/10.1016/j.spasta.2012.03.002 the differential sensitivities of vegetative growth components. Australian
Laroche-Pinel, E., Duthoit, S., Albughdadi, M., Costard, A. D., Rousseau, Journal of Grape and Wine Research, 11(3), 306–315. https://doi.
J., Chéret, V., & Clenet, H. (2021). Towards vine water status monitoring org/10.1111/j.1755-0238.2005.tb00030.x
on a large scale using sentinel-2 images. Remote Sensing, 13(9), 1–21.
https://doi.org/10.3390/rs13091837 Pichon, L., Brunel, G., Payan, J. C., Taylor, J., Bellon-Maurel, V., &
 Tisseyre, B. (2021). ApeX-Vigne: experiences in monitoring vine water
Lebon, E., Pellegrino, A., Louarn, G., & Lecoeur, J. (2006). Branch status from within-field to regional scales using crowdsourcing data from
development controls leaf area dynamics in grapevine (Vitis vinifera)
 a free mobile phone application. Precision Agriculture, (22), 608–626.
growing in drying soil. Annals of Botany, 98(1), 175–185. https://doi.
org/10.1093/aob/mcl085 https://doi.org/10.1007/s11119-021-09797-9

Leroux, C., & Tisseyre, B. (2019). How to measure and report within-field Prudic, K. L., McFarland, K. P., Oliver, J. C., Hutchinson, R. A., Long,
variability: a review of common indicators and their sensitivity. Precision E. C., Kerr, J. T., & Larrivée, M. (2017). eButterfly: Leveraging massive
Agriculture, 20(3), 562-590. https://doi.org/10.1007/s11119-018-9598-x online citizen science for butterfly consevation. Insects, 8(2), 53. https://
Marcenò, C., Padullés Cubino, J., Chytrý, M., Genduso, E., Gristina, A. doi.org/10.3390/insects8020053
S., La Rosa, A., Salemi, D., Pasta, S. & Guarino, R. (2021). Plant hunting: QGIS Development Team (2022). QGIS Geographic Information System.
exploring the behaviour of amateur botanists in the field. Biodiversity and Open Source Geospatial Foundation. URL http://qgis.osgeo.org
Conservation, (11/2021). https://doi.org/10.1007/s10531-021-02248-x
 R Core Team (2022). R: A language and environment for statistical
Martinez-De-Toda, F., Balda, P. & Oliveira, M. (2010). Estimation
of Vineyard water status (vitis Vinifera L. Cv. Tempranillo) from the computing. R Foundation for Statistical Computing, Vienna, Austria.
developmental stage of the shoot tips. Journal International Des Sciences ISBN 3–900051–07–0, URL: http://www.R-project.org
de La Vigne et Du Vin, 44(4), 201–6. https://doi.org/10.20870/oeno-
 Rechenberger, T., Jung, V. M. E., Schmidt, N., & Rosenkranz, C. (2015).
one.2010.44.4.1476
 Utilizing the Crowd – A Literature Review on Factors influencing
Medrano, H., Escalona, J. M., Cifre, J., Bota, J., & Flexas, J. (2003). A Crowdsourcing Initiative Success. In PACIS 2015 Proceedings. 250
ten-year study on the physiology of two Spanish grapevine cultivars under (p. 250). http://aisel.aisnet.org/pacis2015%0Ahttp://aisel.aisnet.org/
field conditions: Effects of water availability from leaf photosynthesis to
 pacis2015/250
grape yield and quality. Functional Plant Biology, 30(6), 607–619. https://
doi.org/10.1071/FP02110 Reynolds,A. G. (2010). Viticultural and vineyard management practices and
Mehdipoor, H., Zurita-milla, R., Rosemartin, A., Gerst, K. L., & Weltzin, their effects on grape and wine quality. Managing Wine Quality: Viticulture
J. F. (2015). Developing a Workflow to Identify Inconsistencies in and Wine Quality. https://doi.org/10.1533/9781845699284.3.365
Volunteered Geographic Information : A Phenological Case Study. PLoS
 Rienth, M., & Scholasch, T. (2019). State-of-the-art of tools and methods
ONE, 10(10), 1–14. https://doi.org/10.1371/journal.pone.0140811
 to assess vine water status. Oeno One, 53(4), 619–637. https://doi.
Météo France (French Institute of Meteorology and Climatology) (2022). org/10.20870/oeno-one.2019.53.4.2403
Consulted on 16/01/2022: https://meteofrance.com/
 Ruffault, J., Martin-StPaul, N. K., Rambal, S., & Mouillot, F. (2013).
Minet, J., Curnel, Y., Gobin, A., Goffart, J. P., Mélard, F., Tychon, B.,
 Differential regional responses in drought length, intensity and timing to
et al., (2017). Crowdsourcing for agricultural applications: A review
of uses and opportunities for a farmsourcing approach. Computers and recent climate changes in a Mediterranean forested ecosystem. Climatic
Electronics in Agriculture, 142(A), 126–138. https://doi.org/10.1016/j. Change, 117(1–2), 103–117. https://doi.org/10.1007/s10584-012-0559-5
compag.2017.08.026
 Senaratne, H., Mobasheri, A., Ali, A. L., & Capineri, C. (2016). A Review
Mirás-Avalos, J. M., & Silva Araujo, E. (2021). Optimization of Vineyard of Volunteered Geographic Information Quality Assessment Methods.
Water Management : Challenges , strategies and perspectives. Water, International Journal of Geographical Information Science, 31(1), 139–
13(6), 746. https://doi.org/10.3390/w13060746 167. https://doi.org/10.1080/13658816.2016.1189556
Mosedale, J. R., Abernethy, K. E., Smart, R. E., Wilson, R. J., & Maclean,
 Simoes, M., & Peterson, A. T. (2018). Utility and limitations of climate-
I. M. D. (2016). Climate change impacts and adaptive strategies: lessons
from the grapevine. Global Change Biology, 22(11), 3814–3828. https:// matching approaches in detecting different types of spatial errors in
doi.org/10.1111/gcb.13406 biodiversity data. Insect Conservation and Diversity, 11, 407–414. https://
 doi.org/10.1111/icad.12288
Naulleau, A., Gary, C., Prévot, L., Berteloot, V., Fabre, J.-C., Crevoisier,
D., et al., (2022). Participatory modeling to assess the impacts of climate Sullivan, B. L., Wood, C. L., Iliff, M. J., Bonney, R. E., Fink, D., &
change in a Mediterranean vineyard watershed. Environmental Modelling Kelling, S. (2009). eBird : A citizen-based bird observation network in
& Software, 150(June 2021), 105342. https://doi.org/10.1016/j. the biological sciences. Biological Conservation, 142(10), 2282–2292.
envsoft.2022.105342 https://doi.org/10.1016/j.biocon.2009.05.006
Pagay, V., & Kidman, C. M. (2019). Evaluating Remotely-Sensed
 van Leeuwen, C., Tregoat, O., Choné, X., Bois, B., Pernet, D., &
Grapevine (Vitis vinifera L.) Water Stress Responses across a Viticultural
Region. Agronomy, 9(11). https://doi.org/10.3390/agronomy9110682 Gaudillére, J. P. (2009). Vine water status is a key factor in grape ripening
 and vintage quality for red bordeaux wine. How can it be assessed for
Payan, J. C. (2020). Peut-on réduire la sensibilité au changement vineyard management purposes? Journal International des Sciences
climatique sans irriguer ? (Can sensitivity to climate change be reduced
 de la Vigne et du Vin, 43(3), 121–134. https://doi.org/10.20870/oeno-
without irrigation?). Entretiens de la vigne et du vin – Languedoc
Roussillon 2020 - February 13th – Narbonne one.2009.43.3.798

Pebesma, E. J. (2004). Multivariable geostatistics in S: the gstat package. Willwerth, J. J., & Reynolds, A. G. (2020). Spatial variability in Ontario
Computers & Geosciences, 30, 683–691. https://doi.org/10.1016/j. Riesling Vineyards : I . Soil, vine water status and vine performance. Oeno
cageo.2004.03.012 One, 54(2), 327–349. https://doi.org/10.20870/oeno-one.2020.54.2.2401.

290 | volume 56–2 | 2022 OENO One | By the International Viticulture and Enology Society
You can also read