TRA 001A Luton Local Plan: 2015 Pre-submission Transport Evidence
←
→
Page content transcription
If your browser does not render page correctly, please read the page content below

Transportation   Luton Borough Council   April 2016

TRA 001A Luton Local Plan:
2015 Pre-submission
Transport Evidence
Prepared by:          ...........................................................   Checked by:        .....................................................................
                      Scott Millard (Graduate Consultant)                                              Kit Tang (Principal Consultant)

Approved by:          ...........................................................
                      Ian Burrows (Regional Director)

  Rev No                                                 Comments                                            Checked               Approved                  Date
                                                                                                               by                     by
      1         Draft – Issued for comments                                                                    KT                                       28/04/2016
      2         Final – following LBC comments                                                                 KT                       IOB             29/04/2016
      3

AECOM House, 63-77 Victoria Street, St Albans, Hertfordshire, AL1 3ER
Telephone: 01727 535000 Website: http://www.aecom.com

Job No 60247699                                  Reference                                                                           Date Created: April 2016

This document has been prepared by AECOM Limited for the sole use of our client (the “Client”) and in accordance with
generally accepted consultancy principles, the budget for fees and the terms of reference agreed between AECOM
Limited and the Client. Any information provided by third parties and referred to herein has not been checked or verified
by AECOM Limited, unless otherwise expressly stated in the document. No third party may rely upon this document
without the prior and express written agreement of AECOM Limited.

p:\uksta1-tp-planning\projects\transport planning - c beds model management and maintenance contract\09 - reports\lutonlocalplan\updated luton local
plan\lutonlocalplanevidencebase_29042016.docx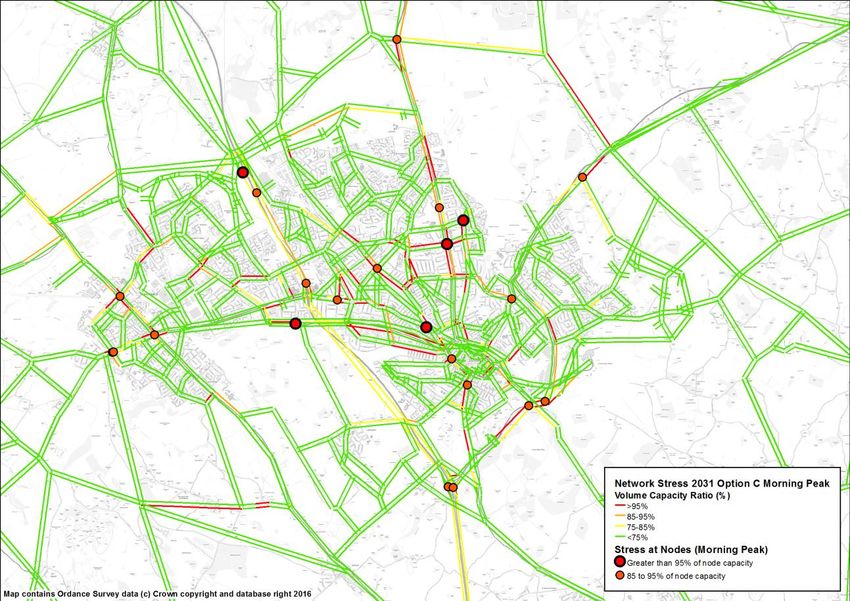
Table of Contents

1          Introduction................................................................................................................................................................ 2

2          Local Plan Options..................................................................................................................................................... 4

3          Planning Data............................................................................................................................................................. 7

4          Assignment Results ................................................................................................................................................. 11

5          Summary and Conclusions...................................................................................................................................... 30

Figure 1: Volume over capacity in Luton in 2016 Option A in the Morning Peak ................................................................ 13
Figure 2: Volume over capacity in Luton in 2016 Option A (Alternative) in the Morning Peak............................................ 13
Figure 3: Volume over capacity in Luton in 2016 Option A in the Evening Peak................................................................. 14
Figure 4: Volume over capacity in Luton in 2016 Option A (Alternative) in the Evening Peak ............................................ 14
Figure 5: Volume over capacity in Luton in 2021 Option B in the Morning Peak ................................................................ 16
Figure 6: Volume over capacity in Luton in 2021 Option C in the Morning Peak ................................................................ 16
Figure 7: Volume over capacity in Luton in 2021 Option B in the Evening Peak................................................................. 17
Figure 8: Volume over capacity in Luton in 2021 Option C in the Evening Peak................................................................. 17
Figure 9: Volume over capacity in Luton in 2031 Option B in the Morning Peak ................................................................ 20
Figure 10: Volume over capacity in Luton in 2031 Option C in the Morning Peak .............................................................. 20
Figure 11: Volume over capacity in Luton in 2031 Option C (Alternative) in the Morning Peak .......................................... 21
Figure 12: Volume over capacity in Luton in 2031 Option B in the Evening Peak............................................................... 21
Figure 13: Volume over capacity in Luton in 2031 Option C in the Evening Peak ............................................................... 22
Figure 14: Volume over capacity in Luton in 2031 Option C (Alternative) in the Evening Peak .......................................... 22
Figure 15: Junction Mitigation Location ............................................................................................................................... 23
Figure 16: Volume over capacity in Luton in 2031 Option C With Junction Mitigation in the Morning Peak ...................... 26
Figure 17: Volume over capacity in Luton in 2031 Option C With Junction Mitigation in the Evening Peak ...................... 26

Table 1: Summary of option tests and modelled years ..........................................................................................................4
Table 2: Additional Dwellings 2011-2031................................................................................................................................7
Table 3: Additional Jobs 2011-2031........................................................................................................................................7
Table 4: Transport Infrastructure Schemes............................................................................................................................9
Table 5: Highway Network Statistics for Luton (2016) ......................................................................................................... 11
Table 6: Highway Network Statistics for Luton (2021) ......................................................................................................... 15
Table 7: Highway Network Statistics for Luton (2031) ......................................................................................................... 18
Table 8: Description of Mitigation Options ........................................................................................................................... 24
Table 9: Highway Network Statistics for Luton (2031 Option C (with Mitigations)) ............................................................. 25
Table 10: Existing Mitigation Performance........................................................................................................................... 27
Table 11: Additional Junction Mitigations ............................................................................................................................ 27
1. Introduction
AECOM 2015 Pre-submission Transport Evidence for Luton Local Plan 2
Capabilities on project:
Transportation
1 Introduction
1.1 The Central Bedfordshire and Luton Transport Model (CBLTM) is a multi-modal model used in assessing the
impacts of transport schemes and developments proposed for both Luton and Central Bedfordshire. The
highway assignment model of the CBLTM has been enhanced in 2013 to provide improved model
performance and coverage in and around Luton to enable the assessment of impacts of transport schemes
and developments proposed for both Luton and Central Bedfordshire. This enhanced version of the
transport model has been used for the initial assessment of the Luton Local Plan as detailed within this
report.
1.2 Luton Borough Council (LBC) has commissioned AECOM to undertake transport modelling tests of the
proposed Luton Local Plan, for a number of options and forecast years. To summarise the uses and context
of the modelling:
These tests should only be used for the assessment of the Local Plan;
Results will provide an indicative, high level, strategic assessment; and
There has been assessment of potential further mitigations required in order to alleviate congestion
and delays as a result of proposed growth.
1.3 The purpose of these tests is to provide evidence identifying the junctions and roads where congestion may
occur in the future as a result of proposed developments.
1.4 This report explains the inputs into the Local Plan model runs and the out-turn results in comparison to
different levels of development. The structure of this report after this introduction is as follows:
Section 2 - Summarises the Local Plan options considered,
Section 3 - Outlines the planning and infrastructure data which underpins the modelling tests,
Section 4 - Summarises the assignment results of the model tests,
Section 5 - Presents the conclusions of the testing.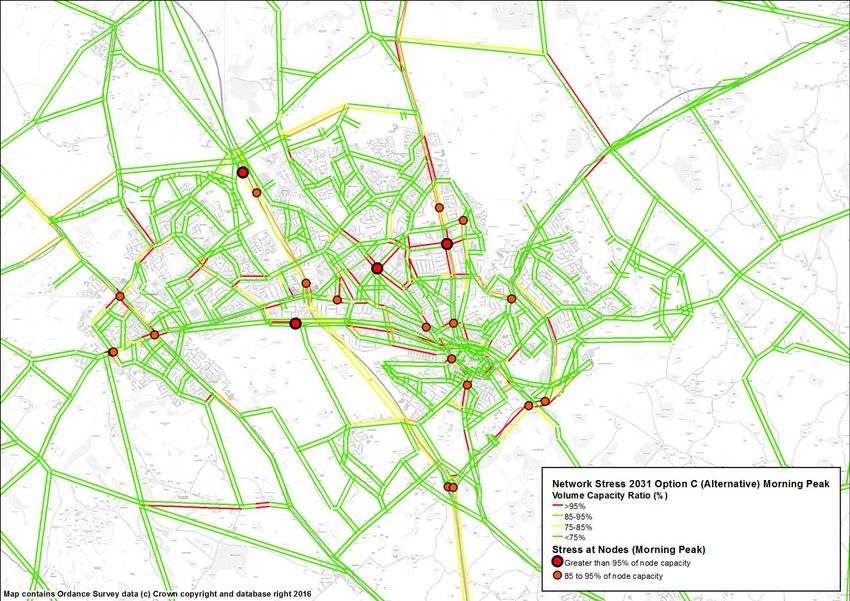
2. Local Plan Options
AECOM 2015 Pre-submission Transport Evidence for Luton Local Plan 4
Capabilities on project:
Transportation
2 Local Plan Options
2.1 AECOM has undertaken a range of transport modelling tests of the proposed Luton Local Plan, for a number
of options and forecast years. This section sets out the forecast years considered and the options tested.
Forecast Years
2.2 Three forecast years were considered, namely 2016, 2021 and 2031. 2016 was chosen as it is 5 years into
the 2011 to2031 planning cycle and key committed infrastructure (Luton Town centre & Junction 10a) will be
complete within this time horizon. Table 1 summarises the options tested by forecast year.
2.3 LBC required the assessment of several options across the forecast years, which included all the
infrastructure and development proposed in line with the Local Plan in the corresponding years. The
prioritisation of potential schemes was considered, alongside how they are linked with development
proposals, to ensure adequate evidence is in place to identify appropriate funding which may be required,
along with the likely timing of this.
2.4 The purpose of the Local Plan tests is to provide supporting transport evidence covering the provision of
growth and linked infrastructure.. The tests were used to identify the junctions and roads where congestion
may occur in the future as a result of proposed developments and will be used to inform the development of
potential transport solutions.
2.5 The option tests and their respective forecast years are summarised in Table 1.
Table 1: Summary of option tests and modelled years
Option 2016 2021 2031
A
A (Alternative)
B
C
C (Alternative)
C (with Mitigations)
Options Summary
2.6 An overview of the options considered is summarised below. The options outlined contain incremental
growth, with Option A representing the committed baseline.
Option A
2.7 Option A (Reference Case) includes committed developments only. LBC have provided the uncertainty log
1
which provided the location and quantum of the committed developments . The committed growth includes
1,766 dwellings within Luton.
Option A (Alternative)
2.8 A sensitivity test of Option A for 2016 was also undertaken. This alternative option will assume an amended
highway network scenario only (i.e. without the Woodside Link and A5-M1 Link). All other infrastructure and
development planning data will remain consistent with Option A, as shown in Table 2, Table 3 and Table 4.
1 Provided by Keith Dove, via email, on the 8 October 2015
AECOM 2015 Pre-submission Transport Evidence for Luton Local Plan 5
Capabilities on project:
Transportation
Option B
2.9 Option B is to identify locations of congestion on the modelled network as a result of proposed developments
in the Borough, with the aim of highlighting any ‘show stoppers’ or pinch points which are likely to require
significant mitigations. Commitment to developments was provided by LBC as part of the Central
Bedfordshire and Luton Development and Infrastructure Uncertainty Log and shows a total of 5,814
dwellings within Luton.
Option C
2.10 Option C considers proposed developments in the Borough (i.e. as Option B) plus known proposed
development sites in adjacent Local Authority areas. These planning assumptions applied to the 2021 and
2031 forecast years.
North of Luton - although no application received, 1,067 and 3,211 dwellings are in the housing strategy
for 2021 and 2031 respectively;
North Hertfordshire - currently modelled to TEMPRO/ NTEM growth, more detail growth for Wandon End
and Brick Kiln developments to the East of Luton has been specified to include 5,500 dwellings for 2031.
Option C (Alternative)
2.11 A sensitivity test of Option C was also undertaken. This alternative assumed a lower level of development at
the East of Luton site with 2,100 dwellings in 2031, instead of 5,500 dwellings included in Option C. All other
development will remain consistent with Option C, as shown in Table 2, Table 3 and Table 4.
Option C (with Mitigations)
2.12 Upon the results of the above Option C tests, a mitigation test of Option C was undertaken. The aim of the
junction mitigations is to alleviate congestion issues that may result from the additional growth. The
mitigations previously identified and modelled by AECOM from previous studies will be incorporated into this
option.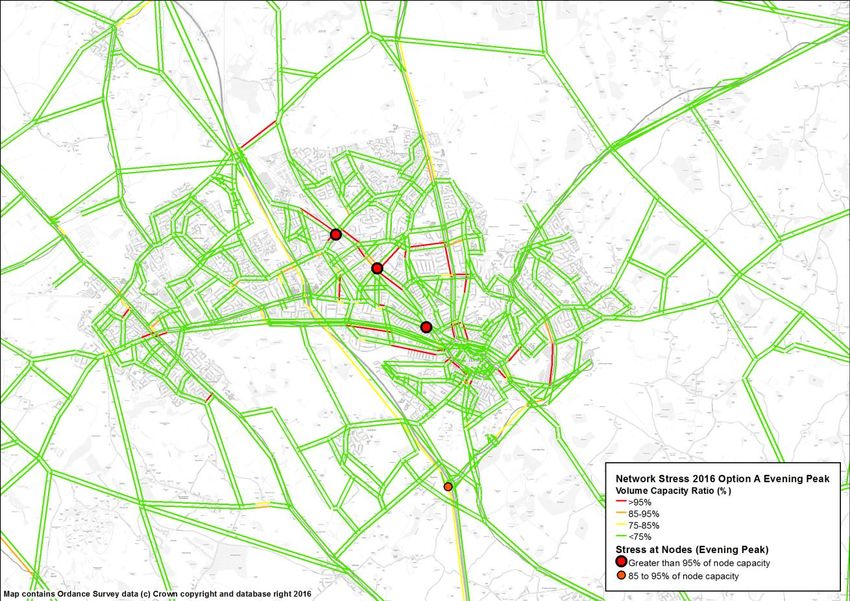
3. Planning and
   Infrastructure Data
AECOM                                                    2015 Pre-submission Transport Evidence for Luton Local Plan                                         7

 Capabilities on project:
 Transportation

   3               Planning Data

 Households and Employment
 3.1   Forecast year planning data summarised in Table 2 for Luton is based on the 2015 Uncertainty
       Development Log, plus demand from past completions from 2011/12 to 2014/15 and future completions at
       ‘small’ sites between 2015/16 and 2019/202. Outside of Luton, growth is based on the 2015 Uncertainty Log
       for Central Bedfordshire and other known levels of growth for adjacent authorities. The additional dwellings
       from 2011 to each forecast year and option are set out in Table 2 and the additional jobs from 2011 to each
       forecast year and option are set out in Table 3.
Table 2: Additional Dwellings 2011-2031
                                                                  2016                              2021                              2031
 Area              Site                                Option A          Option A                                                               Option C
                                                                                         Option B          Option C     Option B   Option C
                                                                       (Alternative)                                                          (Alternative)
    Luton

                   Luton dwellings                       1,766            1,766            3,099            3,099        6,905      6,905        6,905

                   Leighton Buzzard East                    -                -             840               840         2,500      2,500        2,500

                   North of Luton Extension                 -                -               -              1,067          -        3,211        3,211
    Central Beds

                   Houghton Regis North 1                   -                -             800               800         2,800      2,800        2,800

                   Houghton Regis North 2                   -                -             630               630         1,930      1,930        1,930
                   Early release sites at Kestrel
                                                            -                -             1,000            1,000        1,000      1,000        1,000
                   Way and East Bidwell
  North
  Herts

                   East of Luton Extension                  -                -               -                -            -        5,500        2,100

                   Totals                                1,766            1,766            6,369            7,436       15,135     23,846        20,446

Table 3: Additional Jobs 2011-2031
                                                                  2016                              2021                              2031
    Area             Site                              Option A          Option A                                                               Option C
                                                                                         Option B          Option C     Option B   Option C
                                                                       (Alternative)                                                          (Alternative)
                     Butterfield Green                      -                -               -                -          4,013      4,013        4,013

                     Jct 10a                                -                -               -                -          1,728      1,728        1,728

                     Century Pk                             -                -               -                -          2,599      2,599        2,599

    LBC              Power Ct                               -                -               -                -          2,074      2,074        2,074

                     Napier Pk                              -                -               -                -          3,016      3,016        3,016

                     Station Quarter                        -                -               -                -           623        623          623

                     Luton Airport                          -                -               -                -          5,050      5,050        5,050

                     North of Luton Extension               -                -               -              2,500          -        3,250        3,250
                     Houghton Regis North 1                 -                -             1,628            1,628        2,961      2,961        2,961
    CBC
                     Houghton Regis North 2                 -                -             550               550          550        550          550

                     East Leighton Buzzard                  -                -             800               800         2,400      2,400        2,400

                     Totals                                 -                -             2,978            5,478       25,014     28,264        28,264

 2 Confirmed by Jack Kelley, via email, on the 21 January 2016
AECOM 2015 Pre-submission Transport Evidence for Luton Local Plan 8
Capabilities on project:
Transportation
3.2 Planning data, in terms of housing, population and employment, is established in the existing version of
CBLTM. The residential site data provided as part of the latest CBLTM development Uncertainty Log will be
incorporated into the model to ensure that the quantum and spatial distribution of housing growth is
representative of current plans.
3.3 There are 127 proposed development sites in total covering Luton. Each development site was located
spatially within the model and the developments grouped together at a zonal level.
3.4 The level of certainty of development sites was provided by LBC during October 2015 as part of the updated
Uncertainty Log and defines the difference between those options anticipated to be modelled. In addition,
Option C includes developments in neighbouring authorities. The detail of this is specified above in Table 2
and Table 3.
3.5 Trip generation and attraction was calculated and attributed to the updated zone system, in line with the
projections of growth. Since the purpose of the tests is to assess development proposals in line with the
proposed Local Plan, the total growth will be retained and no overall constraint against TEMPRO/ NTEM will
be undertaken.
3.6 The assumption for future growth outside of Luton will be in line with latest growth projections. This covers
growth within the Central Bedfordshire as well as external traffic growth (i.e. growth generated externally, but
passing through the modelled area).
Airport Demand
3.7 Existing highway demand for the airport would already be included in the model whilst future planned growth
has been based on the 2028 traffic demand forecasts produced for Luton Airport3. The Airport planning
application was predicted on the airport reaching 18 million passengers per annum by 2028, although based
on the passenger increases in 2014 to 2015, it is anticipated this could be achieved by 2021. Based on this,
LBC have advised that the 2028 airport demand is to be used for both the 2021 and 2031 forecast year
options4. The data has been applied to the matrix following the furness methodology.
Transport Infrastructure Schemes
3.8 The modelled representation of committed and proposed infrastructure schemes has been considered in
detail during the preparation and running of the Local Plan tests. The infrastructure included is shown in
Table 4.
3.9 Some of the allocation of Central Bedfordshire schemes into the Luton Local Plan options will be dependent
on the developments. For example, the North of Luton extension distributor roads are dependent to the
North of Luton development; and the Houghton Regis North 2 Development distributor roads, Woodside Link
and Poynters Road scheme (see Table 4 overleaf) are dependent to the Houghton Regis North
Development.
3.10 The definition of the network schemes have been provided by LBC.
3.11 The Luton Airport Parkway Bus-Loop scheme, which has been included in previous Local Plan tests
5
undertaken in 2013 , has been excluded from the scheme list for the 2031 options for this study as LBC has
6
advised that this scheme is now unlikely to be implemented .
3 London Luton Airport Planning Application – Transport Assessment, URS, November 2012
4 Confirmed by Keith Dove, via email, on the 8 March 2016
5 Luton Local Plan; Initial Transport Evidence Base, 2013
6 Confirmed by Keith Dove, via email, on the 23 February 2016AECOM 2015 Pre-submission Transport Evidence for Luton Local Plan 9
Capabilities on project:
Transportation
Table 4: Transport Infrastructure Schemes
2016 2016 2021 2021 2031 2031
Area Scheme Option A Option C and C
Option A Option B Option C Option B
(Alternative) (Alternative)
Bedford Western Bypass Phase 1
Bedford
C+E
Bedford Western Bypass Phase 2
A421 Dualling
M1 J10a
C+E
HA
M1 J10-13
Morrisons Houghton Regis
Central Beds and
Luton C+E
Luton & Dunstable Guided Busway
Luton Town Centre
Luton Parkway Northern Access
Luton 20mph
A5 - M1 Link
Woodside Link
Poynters Road Scheme (20mph speed limit
Central Bedfordshire Proposed
and HGV ban)
Networks
Connection to WSL from Parkside Drive
Access to Early Release Kestrel Way
Access Road to Distribution Centre
HRDC development access over CBC land
Houghton Regis North Development 2 -
Distributor Road
East Leighton Distributor Road
Leighton Buzzard Town Centre Schemes
Luton North Bypass*
North of Luton Extension Distributor Roads
Dunstable Road Pinch Points
Luton Proposed
Airport Link to Century Park
Dualling of Airport Access Road
A505 - Airport Bypass
Airport Junction Mitigation
Luton Airport Parkway Bus-Loop
* Luton North Bypass is in addition to the distributor road for the North of Luton Development4. Assignment Results
AECOM                                                   2015 Pre-submission Transport Evidence for Luton Local Plan                        11

Capabilities on project:
Transportation

  4                   Assignment Results

4.1                   This section presents the results of the model assignments, by year.

2016 Option A and 2016 Option A (Alternative)

4.2                   The assignment results for the morning and evening peak for 2016 Option A and Option A (Alternative) are
                      presented below.
4.3                   Table 5 shows the key highway network statistics for 2016 Option A and Option A (Alternative). On average
                      the vehicle delay time was 14% greater in Option A (Alternative) due to the absence of the A5-M1 Link.
Table 5: Highway Network Statistics for Luton (2016)
                                                                                    Highway Network Statistics          Difference (%)
                                                                               2016 Option A           2016 Option A      2016 Op A
                                                                                                        (Alternative)   (Alternative) vs
                                                                                                                          2016 Op A
                            Vehicle Distance (veh-km)                             192,621                 188,663             -2
                            Road Distance (km)                                       344                     343               0
       Morning Peak

                            Free Flow Vehicle Time (veh-hours)                      3,686                  3,660              -1
                            Assigned Vehicle Time (veh-hours)                       4,727                  4,731               0
                            Vehicle Delay Time (veh-hours)                          1,041                  1,071              +3
                            Vehicle Queued End of Hour (PCUs)                        760                     855             +12
                            Speed (kph)                                              41                      40               -2
                            Vehicle Distance (veh-km)                            205,977                 202,332              -2
                            Road Distance (km)                                      344                     343                0
       Evening Peak

                            Free Flow Vehicle Time (veh-hours)                     3,795                   3,773              -1
                            Assigned Vehicle Time (veh-hours)                      4,946                   4,965               0
                            Vehicle Delay Time (veh-hours)                         1,151                   1,192              +4
                            Vehicle Queued End of Hour (PCUs)                       790                     877              +11
                            Speed (kph)                                              42                      41               -2
4.4                   Figure 1 to Figure 4 show the ’volume over capacity’ ratio (i.e. network stress) for the morning and evening
                      peak for both Option A and Option A (Alternative). Only the most severely congested junctions are shown to
                      be ‘stressed’ on the plots and the stress on the individual links should be considered in parallel to that at
                      individual junctions.
4.5                   The modelling shows that 2016 options experience congestion on the main routes into Luton Town Centre in
                      both the morning and evening peak. Typically the A6, Hatters Way and Leagrave Road are the congestion
                      hotspots. Airport Way also experiences vehicle capacity issues and this is more apparent in the evening
                      peak period.
AECOM 2015 Pre-submission Transport Evidence for Luton Local Plan 12
Capabilities on project:
Transportation
4.6 For Option A (Alternative), the absence of the A5-M1 Link has an impact on the link stress within Houghton
Regis and Dunstable. Without the A5-M1 Link, the modelling shows that trips from the A5 to Hatters Way will
have to be routed through Bedford Road, Park Road North through to Poynters Road in order to access
Hatters Way. Furthermore the section of A5 in Dunstable is placed under additional pressure as trips from
the A5 to Luton Town Centre route through the A5 to Church Street and Luton Road in order to access
Luton Town Centre. Additionally the absence of Woodside Link means that the trips from the A5, Houghton
Regis and Dunstable to the M1 would need to travel southbound along Poynters Road towards the M1
Junction 11 in order to access the M1. For Option A (i.e. with A5-M1 Link and Wookside Link), the modelling
shows that these trip movements can access the M1 via the M1 Junction 11a.
4.7 A6/ Austin Road, Hatters Way/ Chaul End Road and Tithe Farm Road/ High Street (only affected in the
Option A (Alternative)) operate at over 95% ‘volume over capacity’ ratio. Within the evening peak, the worse
performing junctions are Leagrave Road/ Dunstable Road, Leagrave Road/ Waller Avenue and Toddington
Road/ Grange Avenue junctions.
4.8 It should be noted that the performance of the 2016 network has been forecasted from the 2009 base year
model and is a model representation of the current traffic conditions and due to the strategic nature of the
model, this may lead to some variation between the modelled and the current observed traffic conditions.AECOM 2015 Pre-submission Transport Evidence for Luton Local Plan 13 Capabilities on project: Transportation Figure 1: Volume over capacity in Luton in 2016 Option A in the Morning Peak Figure 2: Volume over capacity in Luton in 2016 Option A (Alternative) in the Morning Peak
AECOM                                  2015 Pre-submission Transport Evidence for Luton Local Plan   14

Capabilities on project:
Transportation

Figure 3: Volume over capacity in Luton in 2016 Option A in the Evening Peak

Figure 4: Volume over capacity in Luton in 2016 Option A (Alternative) in the Evening Peak
AECOM 2015 Pre-submission Transport Evidence for Luton Local Plan 15
Capabilities on project:
Transportation
2021 Option B and 2021 Option C
4.9 Table 6 shows the key highway network statistics for the 2021 Option B and Option C.
4.10 The differences between the two options are quite limited despite the introduction of the M1-A6 Link and the
additional demand for the North of Luton Extension. It is potential evident that the scale of the benefit of the
M1-A6 Link and the impact of the additional 1,067 dwellings and 2,500 jobs for the North of Luton Extension
is of similar magnitude at a high level, leading to limited differences in network statistics between the two
options.
Table 6: Highway Network Statistics for Luton (2021)
Highway Network Statistics Difference (%)
2021 Option B 2021 Option C 2021 Op C vs
2021 Op B
Vehicle Distance (veh-km) 215,319 223,345 +4
Road Distance (km) 351 368 +5
Morning Peak
Free Flow Vehicle Time (veh-hours) 4,093 4,168 +2
Assigned Vehicle Time (veh-hours) 5,470 5,546 +1
Vehicle Delay Time (veh-hours) 1,377 1,378 0
Vehicle Queued End of Hour (PCUs) 1,033 1,062 +3
Speed (kph) 39 40 +2
Vehicle Distance (veh-km) 227,679 236,881 +4
Road Distance (km) 351 368 +5
Evening Peak
Free Flow Vehicle Time (veh-hours) 4,208 4,311 +2
Assigned Vehicle Time (veh-hours) 5,662 5,796 +2
Vehicle Delay Time (veh-hours) 1,454 1,486 +2
Vehicle Queued End of Hour (PCUs) 1,015 1,023 +1
Speed (kph) 40 41 +2
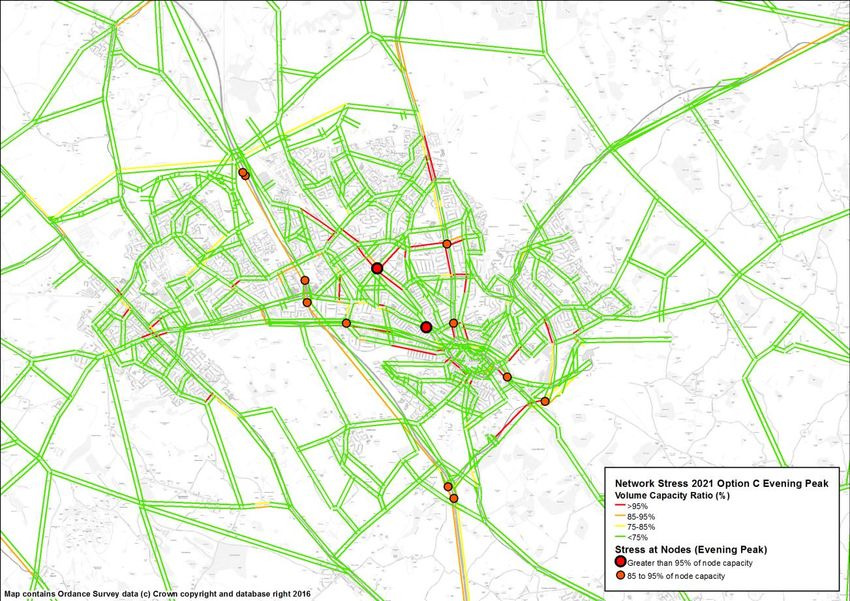
4.11 Similar to the 2016 options, both 2021 Option B and Option C experience network stress issues with routes
heading towards Luton Town Centre, and the modelling shows that the A6, Hatters Way and Leagrave Road
are congestion hotspots. Furthermore, there are several links with over 95% ‘volume over capacity’ ratio
including London Road, Airport Way, Vauxhall Way, and Blundell Road.
4.12 Comparison between the Option B and Option C shows that there are limited differences between junctions
that are under stress. In terms of link stress, the most notable differences between the Option B and Option
C is modelled stress on the A6, which is generally greater for Option C when compared to Option B,
potentially due to the additional trips from the North of Luton Extension.
4.13 Furthermore, comparison between both 2021 options (i.e. Figure 5 to Figure 8) and 2016 Option A (i.e.
Figure 1 and Figure 2) shows an overall increase in network stress. This is the result of an addition of 6,369
dwellings and 2,978 jobs for the 2021 Option B and an additional of 7,436 dwellings and 5,478 jobs for 2021
Option C. The highway links/ areas which show the most notable increase in link stress between the 2016
and 2021 options include the A5/ West Street junction in Dunstable, Airport Way, A6/ Austin Road junction,
and London Road. There are no network changes between the 2016 and 2021 for these highway links/
areas, but as highway demand increases, the modelling shows that these links will experience additional
stress.AECOM 2015 Pre-submission Transport Evidence for Luton Local Plan 16 Capabilities on project: Transportation Figure 5: Volume over capacity in Luton in 2021 Option B in the Morning Peak Figure 6: Volume over capacity in Luton in 2021 Option C in the Morning Peak
AECOM                                 2015 Pre-submission Transport Evidence for Luton Local Plan   17

Capabilities on project:
Transportation

Figure 7: Volume over capacity in Luton in 2021 Option B in the Evening Peak

Figure 8: Volume over capacity in Luton in 2021 Option C in the Evening Peak
AECOM 2015 Pre-submission Transport Evidence for Luton Local Plan 18
Capabilities on project:
Transportation
2031 Option B, 2031 Option C and 2031 Option C (Alternative)
4.14 Table 7 shows the key highway network statistics for 2031 Option B, Option C and Option C (Alternative).
The highway network statistics show that the overall network performance for 2031 Option C is generally
slightly poorer than Option B. The demand for Option C is greater therefore it might be expected that the
overall delay for the network would be greater for Option C when compared to Option B.
Table 7: Highway Network Statistics for Luton (2031)
Highway Network Difference (%) Highway Network Difference (%)
Statistics Statistics
2031 2031 2031 Op C vs 2031 Option C 2031 Op C
Option B Option C 2031 Op B (Alternative) (Alternative) vs
2031 Op B
Vehicle Distance (veh-km) 235,539 237,621 +8 235,165 +7
Road Distance (km) 351 346 +4 346 +4
Free Flow Vehicle Time (veh-
Morning Peak
hours) 4,471 4,575 +7 4,514 +6
Assigned Vehicle Time (veh-
hours) 6,416 6,602 +7 6,456 +5
Vehicle Delay Time (veh-hours) 1,945 2,028 +7 1,942 +2
Vehicle Queued End of Hour
(PCUs) 1,605 1,769 +12 1,562 -1
Speed (kph) 37 36 +0 36 +2
Vehicle Distance (veh-km) 247,753 249,784 +7 247,421 +6
Road Distance (km) 351 346 +4 346 +4
Free Flow Vehicle Time (veh-
Evening Peak
hours) 4,602 4,689 +7 4,636 +6
Assigned Vehicle Time (veh-
hours) 6,530 6,758 +8 6,587 +5
Vehicle Delay Time (veh-hours) 1,928 2,069 +10 1,951 +4
Vehicle Queued End of Hour
(PCUs) 1,376 1,507 +12 1,397 +4
Speed (kph) 38 37 +0 38 +1
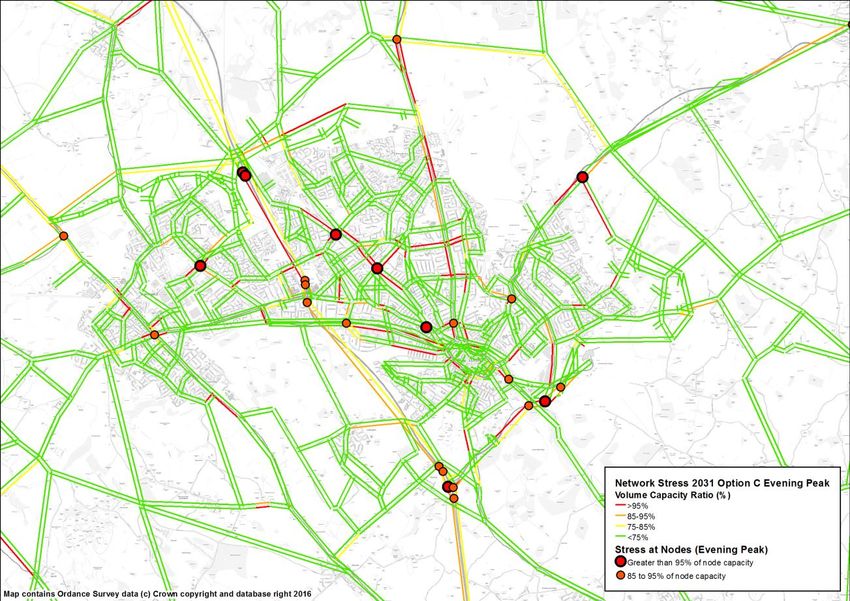
4.15 The modelling shows that for Option B, the main routes into Luton Town Centre are congested. These
routes include the A6, Leagrave Road, Hatters Way and London Road, and are consistent between the
morning and evening peak. Other congested routes include Vauxhall Way, Airport Way, Austin Road and
Blundell Road, which the modelling shows that the ‘volume over capacity’ ratios for these links are over
95%. Furthermore node stress is identified on the slip roads surrounding the M1, specifically at Junction 10,
Junction 11 and Junction 11a. The A5 in Dunstable continues to be congested during the morning peak. The
A5/ Houghton Road, A5/ Church Street and Drovers Way/ West Street junctions experience congestion for
2031 Option B. Despite the rise in demand in 2031, these junctions have remained at the same level of
congestion as modelled in the 2021 Option B and Option C.
4.16 Comparison between Option B and Option C indicate that there is an overall increase in congestion along
the A6 near Austin Road as the demand for the North of Luton Extension is introduced for Option C.
Additionally, the modelling shows that there is congestion at the Old Bedford Road/ Barnfield Avenue
junction in Option C. On the other hand, link stress is reduced on Leagrave Road during the morning peak,
potentially as vehicles re-route to the M1-A6 Link. In Option B, during the morning peak, trips coming from
the A6, routing through to the M1, would route through Bramingham Road. In Option C congestion has been
reduced on Bramingham Road/ B579 junction signifying trips re-routing to the M1-A6 Link. Congestion has
reduced on the A6 and increased on the M1 for Option C when compared to Option B. In the evening peak
there is an increase in congestion along Vauxhall Way, as a result of the growth of Luton Airport and the
Century Park development for Option C. It is evident that the developments affect trip patterns throughout
the network.AECOM 2015 Pre-submission Transport Evidence for Luton Local Plan 19
Capabilities on project:
Transportation
4.17 The performance of Option C (Alternative) is varied. Some congested areas perform well while others have
performed the same as Option C or performed worse. Junctions which have improved with the reduced
demand include, during the morning peak, Old Bedford Road/Barnfield Avenue, New Bedford Road/
Cromwell Road, Dunstable Road/ Leagrave Road and A505/ Eastern by-pass junctions. For the evening
peak, the modelling shows that Airport Way performed slightly better, however, Leagrave Road/ Blundell
Road is more congestion for Option C (Alternative) when compared to Option C.
4.18 Overall the congestion has progressively increased across the options from 2016 to 2031 as demand
increases due to the additional dwellings and jobs. From 2016 to 2031 there is a maximum increase in jobs
of 28,264 and an additional 23,846 dwellings from 2016 (i.e. between 2016 Option A and 2031 Option C).
The pressure on the road network to cope with this demand is high and therefore junction mitigations are
needed in order to help alleviate some of these pressures.AECOM 2015 Pre-submission Transport Evidence for Luton Local Plan 20 Capabilities on project: Transportation Figure 9: Volume over capacity in Luton in 2031 Option B in the Morning Peak Figure 10: Volume over capacity in Luton in 2031 Option C in the Morning Peak
AECOM                                  2015 Pre-submission Transport Evidence for Luton Local Plan   21

Capabilities on project:
Transportation

Figure 11: Volume over capacity in Luton in 2031 Option C (Alternative) in the Morning Peak

Figure 12: Volume over capacity in Luton in 2031 Option B in the Evening Peak
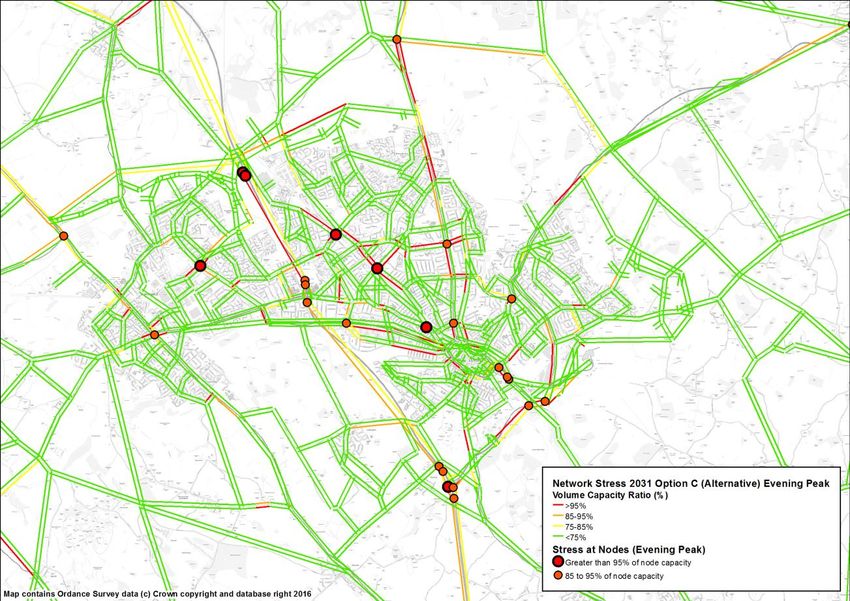
AECOM                                  2015 Pre-submission Transport Evidence for Luton Local Plan   22

Capabilities on project:
Transportation

Figure 13: Volume over capacity in Luton in 2031 Option C in the Evening Peak

Figure 14: Volume over capacity in Luton in 2031 Option C (Alternative) in the Evening Peak
AECOM 2015 Pre-submission Transport Evidence for Luton Local Plan 23
Capabilities on project:
Transportation
Junction Mitigations
4.19 This section presents the junction mitigations that have been considered and the performance on the
network.
4.20 LBC have stated that junction mitigation measures previously identified in Luton Local Plan7 and modelled
by AECOM should be included in the proposed Local Plan modelling. A single model option with junction
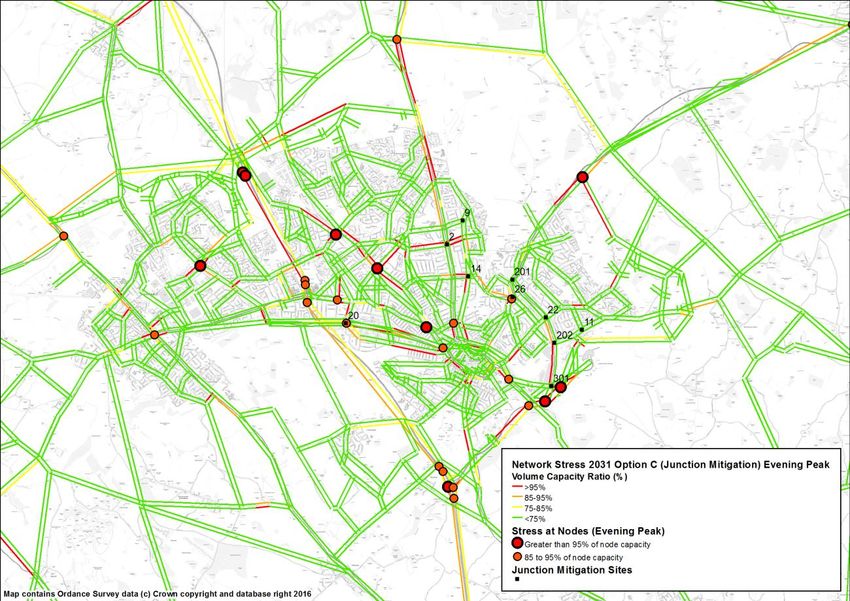
mitigations has been considered (i.e. 2031 Option C (with Mitigations)). Figure 15 below indicates the
location of the junction mitigations. Additional to the previous mitigation measures, a mitigation scheme for
the Vauxhall Way/ Kimpton Road junction has also been included8. For the purpose of this report this is
identified with the Site ID 301.
Figure 15: Junction Mitigation Location
7 Luton Local Plan; Initial Transport Evidence Base, 2013
8 The specification and arrangement of junction mitigation 301 was sent to us by email from Keith Dove, on the 24 March 2016AECOM 2015 Pre-submission Transport Evidence for Luton Local Plan 24
Capabilities on project:
Transportation
4.21 Table 8 illustrates the proposed junction mitigations that have been modelled for this option (i.e. 2031 Option
C (with Mitigations)).
Table 8: Description of Mitigation Options
Site ID Proposed junction improvement Modelling assumptions
2 Additional lanes on both approaches of A6. New nodes added to represent flared approaches
north and south of A6.
9 Additional approach lane on Barnfield Avenue. Flare was introduced on Barnfield Avenue.
11 Additional approach lanes on Eaton Green Road Flare was introduced to the roundabout approach.
approaches.
14 Lengthening of two lane section on Old Bedford Additional flare introduced on Old Bedford Road.
Road (S). Change in signal timing to allow for increased flow
to pass through the junction.
20 Removal of cycle facilities at roundabout and Increased roundabout capacity provided additional
localised widening on roundabout approaches. flares on all approaches.
22 Additional flare on Vauxhall Way. Additional flare introduced on both approaches of
Vauxhall Way.
26 Signalise Hitchin Road and Stockingstone Road Signalised crossroad junction and priority junction
junctions and convert Ramridge Road / coded. Signal timing based on experience
Stockingstone Road junction to priority. introduced and Saturn signal optimisation was
performed.
201 Additional flare on all approaches. Dedicated left Flare increased on all approaches.
turn lane on Stopsley Way approach.
202 Lengthen flares on Vauxhall Way and Eaton Green Flare introduced on Vauxhall Way and Eaton
Road. Green Road.
301 Conversion of the roundabout into a signalised New nodes added to represent the additional lanes
junction on the approach to the round about
4.22 Table 9 presents the key highway network statistics for the 2031 Option C (with Mitigations). Overall the
mitigations have made an improvement on the network performance. It has slightly improved all network
statistics parameters. Whilst the highway statistics provides an indication of the overall network
performance, the stress plots (i.e. Figure 16 and Figure 17) provide more detailed information in relation to
the performance of each junction mitigation measures.AECOM 2015 Pre-submission Transport Evidence for Luton Local Plan 25
Capabilities on project:
Transportation
Table 9: Highway Network Statistics for Luton (2031 Option C (with Mitigations))
Highway Network Statistics Difference (%)
2031 2031 Option C (With 2031 Op C vs 2031 Op C
Option C Mitigations) (with Mitigations)
Vehicle Distance (veh-km) 237,621 251,088 -1
Road Distance (km) 346 362 -1
Morning Peak
Free Flow Vehicle Time (veh-hours) 4,575 4,747 -1
Assigned Vehicle Time (veh-hours) 6,602 6,792 -1
Vehicle Delay Time (veh-hours) 2,028 2,044 -2
Vehicle Queued End of Hour
(PCUs) 1,769 1,659 -7
Speed (kph) 36 37 0
Vehicle Distance (veh-km) 249,784 263,308 -1
Road Distance (km) 346 362 -1
Evening Peak
Free Flow Vehicle Time (veh-hours) 4,689 4,864 -1
Assigned Vehicle Time (veh-hours) 6,758 6,920 -2
Vehicle Delay Time (veh-hours) 2,069 2,056 -3
Vehicle Queued End of Hour
(PCUs) 1,507 1,496 -3
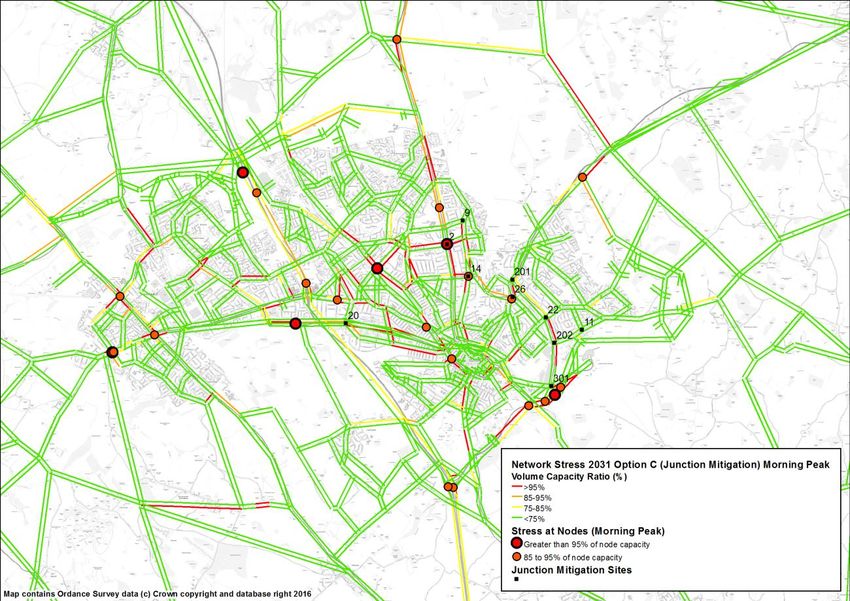
Speed (kph) 37 37 1AECOM 2015 Pre-submission Transport Evidence for Luton Local Plan 26 Capabilities on project: Transportation Figure 16: Volume over capacity in Luton in 2031 Option C With Junction Mitigation in the Morning Peak Figure 17: Volume over capacity in Luton in 2031 Option C With Junction Mitigation in the Evening Peak
AECOM 2015 Pre-submission Transport Evidence for Luton Local Plan 27
Capabilities on project:
Transportation
4.23 The results of the modelling tests undertaken provide an indication on the performance of the junction
mitigation measures considered. This is summarised in Table 10.
4.24 Comparisons have been made between 2031 Option C (i.e. Figure 10 and Figure 13) and the 2031 Option C
(with Mitigations) (i.e. Figure 16 and Figure 17). It has identified a mixture of performances following the
implementation of the junction mitigation measures. For Mitigation Site ID 9, the modelling shows that the
mitigation measure considered is effectiveness and reduces the stress and therefore congestion at this
junction. The modelling shows that for 2031 Option C, the ‘volume over capacity ratio’ for this junction is
greater than 95% whilst for 2031 Option C (with Mitigations), the volume over capacity’ ratio is less than
85%.
4.25 Conversely there are junction mitigation measures that may not be required. This is potentially due to the
fact that these mitigation measures were determined from the previous Luton Local Plan and therefore may
not be necessary and applicable as planning and infrastructure assumptions have now been updated. As the
level and pattern of highway demand changes, some of the junctions which were identified as under stress
in the previous study is no longer required. Considerations may need to be made as to whether these ‘not
required’ mitigations are to be removed.
4.26 For the remaining mitigation junction measures, it has been identified that they are not performing as would
be expected, despite the implementation of the mitigation measures to improve them. In some cases there
are no changes in the level of performance such as Mitigation Site ID 2, 202 and 26 which still suffer from
the same amount of congestion as previously seen in Option C. For Mitigation Site 14 and 301 the
performance has become worse, making the junction more stressed in the 2031 Option C (with Mitigations)
when compared to 2031 Option C. This is likely to be caused by the difference in demand level between the
previous Luton Local Plan and this latest Local Plan, and it is possible that these mitigation measures are
operating with far higher demand than they were originally designed for.
Table 10: Existing Mitigation Performance
Mitigation Site ID Mitigation included Mitigation included Mitigation included
Mitigation working Mitigation NOT performing But not required
2
20 May not be needed
22 May not be needed
201 May not be needed
202
26
9
11 May not be needed
14
301
4.27 Moreover, according to the modelling outputs it would suggest that further additional mitigations may be
needed for other areas of with high network stress. These are listed in Table 11.
Table 11: Additional Junction Mitigations
Additional Junction Mitigation Sites to Consider
(according to the model results)
New Airport Way/ A1081 Slip Roads
A1081/ B653
Chaul End/ Hatters Way
Dunstable/ Hatters Way
Leagrave Road/ Waller Avenue
Leagrave Road/ Dunstable Road
M1 Junction 10
M1 Junction 11
M1 Junction 11aAECOM 2015 Pre-submission Transport Evidence for Luton Local Plan 28
Capabilities on project:
Transportation
4.28 The main areas of concerns within Luton are Hatters Way, Leagrave Road/ Dunstable Road, Airport Way/
New Airport Way and Beech Hill/ A505 junctions.
4.29 Hatters Way consistently operates over capacity and is one of the main routes into Luton Town Centre. With
only one mitigation site in place (i.e. Mitigation Site ID 20) it would suggest further mitigations are required in
order to alleviate the congestion along this road (e.g. Hatters Way/ Dunstable Road).
4.30 Additionally Airport Way, leading to Percival Way, suffers from congestion. This is less of a concern as the
final design and layout of the Percival Way scheme has not been incorporated into the mitigation option (i.e
2031 Option C (with Mitigations). It is likely that with the final design of this scheme will reduce the
congestion within this area.
4.31 Leagrave Road consistently operates over capacity and is of a concern due its lack of mitigations that can
be put into place. The junction at Dunstable Road/ Leagrave Road and Leagrave Road/ Waller Avenue have
9
been listed as ‘too difficult’ to mitigate for ‘due to the constrained nature of both sites’ .
4.32 The junction at Dunstable Road/ Cardiff Road, which is modelled as congested, has since been updated by
LBC since this study commenced. This junction now operates under a different arrangement, different from
10
the modelled junction, of which could potentially improve the modelled congestion at this junction .
4.33 The congestion at the A505/ Eastern by-pass junction may be less of a concern. Considering its design, a
roundabout with two lanes in either direction on the A505 and one lane from the by-pass, this congestion is
likely to have been caused from not allowing enough capacity through the junction.
4.34 The main areas of concern outside of Luton is Junction 10, Junction 11 and Junction 11a of the M1. The
modelling shows that there is congestion on the southbound slip roads in the morning peak and on the
northbound slip roads in the evening peak. While LBC cannot influence a direct mitigation for this area it is
worthy of discussion with Highways England as to what mitigations can be implemented to reduce
congestion.
9 Confirmed by Keith Dove, via email, on the 20 April 2016
10 Notified by Keith Dove, in the Preliminary Results presentation, on the19 April 20165. Summary and Conclusions
AECOM                                    2015 Pre-submission Transport Evidence for Luton Local Plan                 30

Capabilities on project:
Transportation

  5         Summary and Conclusions

Overview

5.1        AECOM has undertaken a range of transport modelling tests of the proposed Luton Local Plan, for a number
           of options and forecast years. Three forecast years were considered, namely 2016, 2021 and 2031.
5.2        A number of options were tested throughout the forecast years and comparisons have been made between
           the options to identify what impact the demand has on the level of congestion on the road network.
5.3        The transport modelling evidence undertaken and reported within this report should only be used for the
           assessment of the Local Plan. The results provide an indicative, high level strategic assessment and this
           should be taken into consideration.
5.4        The model results produced seem intuitive with the increases in demand and the introduction of elements of
           the Luton Local Plan.

2016 Option A and 2016 Option A (Alternative)

5.5        The 2016 model runs shows the modelled traffic impact of the committed developments from LBC (Option A)
           and comparison between Option A and Option A (Alternative) shows the impact of with/ without the A5-M1
           Link and the Woodside Link.
5.6        For 2016 Option A, typically the A6, Hatters Way and Leagrave Road are congestion hotspots. Additionally
           Airport Way experiences capacity issues and this is more apparent in the evening peak.
5.7        For both 2016 Option A and Option A (Alternative), there are two junctions which are operating with ‘volume
           over capacity’ ratio of over 95% for the morning peak. These are the A6/ Austin Road and Hatters Way/
           Chaul End Road junctions. For Option A (Alternative), the modelling shows that the Tithe Farm Road/ High
           Street junction is also under stress.
5.8        Within the evening peak, the worse performing junctions are Leagrave Road/ Dunstable Road, Leagrave
           Road/ Waller Avenue and Toddington Road/ Grange Avenue for both 2016 Option A and Option A
           (Alternative).
5.9        It should be noted that the performance of the 2016 network has been forecasted from the 2009 base year
           model and is a model representation of the current traffic conditions and due to the strategic nature of the
           model, this may lead to some variation between the modelled and the current observed traffic conditions.

2021 Option B and 2021 Option C

5.10       The 2021 Option B and Option C shows the modelled traffic impact of the 2021 proposed developments
           from LBC (Option B) and the proposed developments of the surrounding areas (East of Luton and North
           Herts) (Option C).
5.11       Both Option B and Option C share stress in similar locations as committed housing starts to be introduced to
           the road network. There are limited differences between the options as the introduction of transport
           infrastructure schemes that allow for greater vehicle capacity is then met with an increase in demand. The
           A6/ Austin Road, Hatters Way/ Chaul End Road, Dunstable Road/ Cardiff Road, Dunstable Rd/ Leagrave
           Road and Leagrave Road/ Waller Avenue are junctions which perform with ‘volume over capacity’ ratio of
           over 95%.
AECOM 2015 Pre-submission Transport Evidence for Luton Local Plan 31
Capabilities on project:
Transportation
2031Option B, 2031 Option C and 2031 Option C (Alternative)
5.12 The modelled traffic impact of the 2031 proposed developments from LBC (Option B) versus Option B plus
the proposed developments of the surrounding areas (East of Luton and North Herts) (Option C) versus the
sensitivity test of Option C that assumes a lower level of development at the East of Luton site (Option C
(Alternative)).
5.13 There is an increase in network stress from Option B to Option C as the demand increases. Again, the
modelling shows that the main route that suffers from congestion is the A6. However, the results of the
modelling are mixed as some areas show an increase in congestion whilst for other areas, the congestion
reduce. Leagrave Road on the whole sees a reduction in congestion as the M1-A6 Link is introduced.
5.14 Option C (Alternative) again produces mixed results due to increasing and reducing congestion in certain
areas. One notable junction with increase in the amount of congestion is the Leagrave Road/ Waller Avenue
junction.
Junction Mitigations
5.15 The junction mitigations from the previous round of testing that was completed for the Luton Local Plan were
used in this study. An additional junction mitigation, Site ID 301, was added at the request of LBC.
5.16 The overall performance of the modelled mitigation measures was mixed. Some junction mitigations were
deemed as ‘not working’ and ‘not improving’ the performance of the junction, while others were deemed as
not necessary because the junction was performing as expected with the increase demand. This is
potentially due to the fact these were taken from the previous Luton Local Plan and therefore may not have
been optimised for the current Luton Local Plan options.
5.17 The main areas of concerns within the Luton are Hatters Way, Leagrave Road/ Dunstable Road, Airport
Way/ New Airport Way and Beech Hill/ A505 junctions.
5.18 The main areas of concern outside of the Luton study area is Junction 10, Junction 11 and Junction 11a of
the M1.
5.19 This ultimately highlights the increasing pressure that Option C is under and even though the junction
mitigation measures are in place, the highway network is not performing as well as might be expected.
Recommendations
5.20 Following our testing there is an opportunity to further enhance the model. Following our conclusions it is
evident that further mitigation measures are required in order to eliminate or reduce the congestion at
junctions.
5.21 The testing we have completed highlights that the mitigation measures have not been optimised or reviewed
in order to check they are still necessary for the forecasted demand. It would be beneficial for the model if a
review process was undertaken and the opportunity therefore to introduce additional junction mitigation
measures. There are a number of junctions that would benefit from junction mitigation measures if they were
put into place, of which Airport Way and Leagrave Road would benefit significantly with its current levels of
congestion.You can also read