Trade Protection Along Supply Chains - American ...
←
→
Page content transcription
If your browser does not render page correctly, please read the page content below

∗
                          Trade Protection Along Supply Chains

                Chad Bown                                                   Paola Conconi
       Peterson Institute and CEPR                   Université Libre de Bruxelles, CEPR, CESifo, and CEP

              Aksel Erbahar                                              Lorenzo Trimarchi
       Erasmus University Rotterdam                                       Université de Namur
             Tinbergen Institute
                                                     November 2021

                                               Abstract
       During the last decades, the United States has applied increasingly high trade protec-
       tion against China. We combine detailed information on US antidumping (AD) duties
       — the most widely used trade barrier — with US input-output data to study the effects
       of trade protection against China along supply chains. To deal with endogeneity con-
       cerns, we propose a new instrument for AD duties, which combines exogenous variation
       in the political importance of industries across electoral terms with their historical ex-
       perience in AD proceedings. We estimate the effects of protection on directly exposed
       and indirectly exposed (downstream and upstream) industries. We find that AD duties
       have a net negative impact on US jobs: they reduce employment growth in downstream
       industries, with no significant effects in protected and upstream industries. We pro-
       vide evidence for the mechanisms behind the negative effects of protection along supply
       chains: AD duties decrease imports and raise prices in protected industries, increasing
       production costs in downstream industries.

       JEL Classifications: F13, D57.

       Keywords: Trade Protection, Supply Chains, Input-Output Linkages.
    ∗
      Part of this paper builds on the earlier project circulated under the title “Trade Policy and the China Syndrome.” We are
grateful to Pol Antràs, Tommaso Aquilante, Andy Bernard, Emily Blanchard, Kirill Borusyak, Davin Chor, Italo Colantone,
Arnaud Costinot, Don Davis, Mathias Dewatripont, David Dorn, Ruben Durante, Amit Khandelwal, Sacha Kapoor, Josef
Konings, Brian Kovak, Andrei Levchenko, Marcelo Olarreaga, Emanuel Ornelas, Justin Pierce, Veronica Rappoport, Vincent
Rebeyrol, André Sapir, Peter Schott, Bob Staiger, Otto Swank, Denni Tommasi, Hylke Vandenbussche, Eric Verhoogen, David
Weinstein, Maurizio Zanardi, participants at the ETSG and CEBLF conferences, the FREIT SETC conference, the CESifo
conference on the Global Economy, the Fifth Conference of CEPR Research Network on Global Value Chains, Trade and De-
velopment, the Workshop on International Economic Networks (WIEN), the Spring Meeting of Young Economists, the Geneva
Trade and Development Workshop, Workshop on International Trade: The New Normal, the 2021 CEPR ERWIT conference,
and seminar participants at Trinity College Dublin, ECARES, Lancaster University, Erasmus University Rotterdam, Maastricht
University, Syracuse University, Nottingham University, University of Mainz, University of Munich, the Bank of Italy, the Lon-
don School of Economics, Columbia University, UZH, UBC, Oxford, and the Empirical Trade Online Seminar (ETOS) for their
helpful comments and suggestions, and Elisa Navarra for excellent research assistance. Paola Conconi gratefully acknowledges
funding from the FNRS, the European Research Council (Advanced ERC Grant No. 834253) and the European Union’s Horizon
2020 research and innovation programme (Agreement Grant No. 770680), while Lorenzo Trimarchi acknowledges funding from
the FNRS (Excellence of Science Research No. O020918F). Correspondence should be addressed to Paola Conconi, ECARES,
Université Libre de Bruxelles, CP 114, Avenue F. D. Roosevelt 50, 1050 Brussels, Belgium. E-mail: paola.conconi@ulb.be.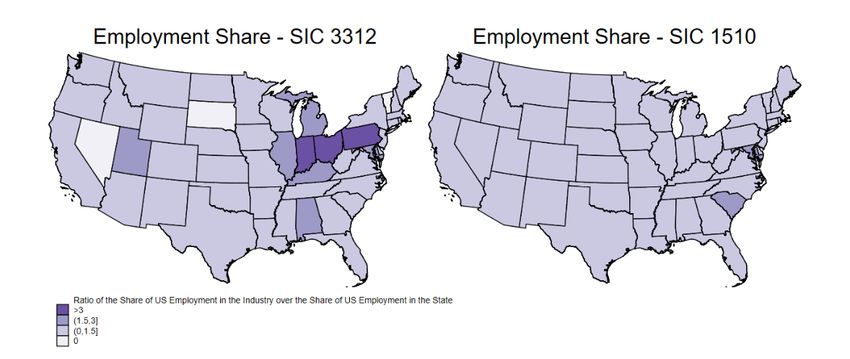
1      Introduction
The last few decades have witnessed the rise of China as a world trading power. Thanks
to its deep economic reforms in the 1980s and 1990s and its accession to the World Trade
Organization (WTO) in 2001, China went from accounting for around 2% of global man-
ufacturing exports in 1990 to being the largest exporting country in the world. This has
stimulated an intense academic and policy debate about the negative effects of rising import
competition from China on US employment (e.g. Autor et al., 2013; Acemoglu et al., 2016;
Pierce and Schott, 2016).
    Less attention has been devoted to the protectionist measures that have been imposed
to curb this rise in Chinese import competition. Recent studies have examined the effects
of the special measures introduced in 2018 by the Trump administration and the resulting
retaliation (e.g. Amiti et al., 2019; Cavallo, et al., 2019; Flaaen and Pierce, 2019; Handley
et al., 2019; Fajgelbaum et al., 2020; Flaaen et al., 2020). However, well before President
Donald Trump took office, the US had been targeting China through its most frequently
used trade barrier: antidumping (AD) duties. As shown in Figure 1, between the election of
George H. W. Bush in 1988 and the end of Barack Obama’s second term in 2016, the average
US AD duty against China more than tripled. Over the same period, the share of Chinese
imports covered by US AD duties has also dramatically increased (from 1.4% to 7.4%), as
shown in Figure A-1 in the Appendix.

                                                      Figure 1
                              Average AD duty against China (1988-2018)

    The figure plots the average duty across AD measures in force targeting China during 1988-2016 (in blue) and during the
    first two years of Trump’s presidency in 2017-2018 (in red). Source: Authors’ calculations based on an extended version
    of the Temporary Trade Barriers Database (Bown, 2014).

                                                            1
The last decades have also witnessed the emergence of global supply chains and the rise
of trade in intermediate goods (e.g. Yi, 2003; Johnson and Noguera, 2012; Antràs and
Chor, 2021). In a world in which production processes are fragmented across countries, the
effects of tariffs can propagate along supply chains, possibly hurting producers in downstream
industries.1 Such concerns are exacerbated by the fact that protection is often targeted
towards intermediate inputs.2
In this paper, we examine the effects of trade protection along supply chains. To this
purpose, we collect detailed information on trade barriers introduced by the United States
during the last decades and combine it with disaggregated US input-output data to identify
industries that are directly and indirectly exposed to protection. In our main analysis, we
study the effects of AD duties, the most common trade barrier used by the United States
and other WTO members (Blonigen and Prusa, 2016).3 We focus on duties applied against
China, which has been by far the biggest target of US protection: since its accession to the
WTO, it was named as a target country in 73% of US AD measures.
As pointed out by Trefler (1993), endogeneity poses a key challenge to identify the im-
pact of trade policies. AD duties and other protectionist measures can be influenced by
unobservables such as negative productivity shocks to domestic producers, making it harder
to identify the effects on directly exposed industries. When studying the effects of protec-
tion along supply chains, the results might be confounded by omitted variables correlated
with both the level of protection in upstream industries and the performance of downstream
industries. For example, positive productivity shocks experienced by foreign input suppliers
can benefit US firms in downstream sectors (e.g. allowing them to purchase inputs at lower
prices) and also increase input protection (e.g. making it easier for an industry that petitions
for AD to provide evidence of injury). Omitting these productivity shocks would thus work
against finding negative effects of tariffs along supply chains. Other potential omitted vari-
ables such as lobbying can have similar effects. Higher tariffs (e.g. on car parts or steel) can
1
For example, it has been argued that Trump’s tariffs “on bike components have raised the costs of
Bicycle Corporation of America [BCA]” . . . “tariffs on steel and aluminium have so disrupted markets that
plans to expand BCA are on hold, costing American jobs” (“The Trouble with Putting Tariffs on Chinese
Goods,”The Economist, May 16, 2019).
2
Bown (2018) shows that during the last few decades AD duties applied by the United States against
China are increasingly skewed towards intermediate goods. He documents similar patterns when looking at
measures applied by the United States against other countries, as well as measures applied by other advanced
economies. In the recent trade war with China, US tariffs were also skewed towards intermediate inputs,
such as primary metals and electrical equipment (Fajgelbaum et al., 2020).
3
GATT/WTO rules allow three forms of trade barriers: AD duties to defend against imports sold at
“less than fair value,” countervailing duties to protect against subsidized imports, and safeguard tariffs in
response to import surges. AD duties are the most common measure used by the United States against
China during our sample period (see Figure A-2).
2hurt producers in tradable and non-tradable downstream industries (e.g. car manufacturers
or construction companies), who may thus lobby against input protection.4 These lobbying
efforts may be particularly strong in declining industries, again making it harder to identify
the negative effects of protection on downstream industries.
We make two main contributions to the literature on the effects of trade protection. First,
we propose a new instrumental variable for AD duties. Second, combining this instrument
with disaggregated input-output data, we examine the causal effects of trade barriers along
supply chains.
Our instrument is the interaction between an industry’s importance in political battle-
ground states and its historical experience at filing for AD petitions. To identify the effects
of trade protection, we exploit changes in the identity of swing states across electoral terms.
Exposure to these political shocks varies across industries, depending on their importance
across states (captured by initial employment shares) and their historical experience in the
AD process (captured by pre-sample AD petitions). The logic behind our identification
strategy is that AD protection should be skewed in favor of industries that are important
in swing states, but only if they can exploit this political advantage thanks to their prior
knowledge of the complex procedures to petition for AD duties.
Our identification strategy builds on the literature on the political economy of trade
policy. Several studies show that US trade policies are biased towards the interests of swing
states (e.g. Muûls and Petropoulou, 2013; Conconi et al., 2017; Ma and McLaren, 2018;
Fajgelbaum et al., 2020).5 We provide novel evidence that swing-state politics shapes US
AD protection. We also build on the fact that, due to the legal and institutional complexity
of the AD process, industries with prior experience in AD cases face lower costs of filing and
a higher probability of success in new cases (Blonigen and Park, 2004; Blonigen, 2006).
We show that our instrument strongly predicts variation in AD protection (within in-
dustries across electoral terms) and is highly robust, e.g. to using different measures of
AD protection, extending the analysis to all temporary trade barriers (TTBs), and employ-
ing alternative definitions of swing states. We also provide micro-level evidence supporting
our instrument. First, we find that legislators from swing states are overrepresented in the
4
For example, Gawande et al. (2012) report that in 2006 “[t]he steel antidumping duties in the United
States were brought down partly by a coalition of otherwise rival firms. The case against the steel duties
brought together rival U.S. and Japanese auto makers – General Motors Corp., Ford, and Daimler-Chrysler
AG joined forces with Toyota Motor Corp., Honda Motor Co., and Nissan Motor Co.”.
5
These studies examine the effects of swing-state politics on non-tariff barriers under President Reagan
(Muûls and Petropoulou, 2013), trade disputes initiated by the United States (Conconi et al., 2017), US
MFN tariffs (Ma and McLaren, 2018), and Trump’s 2018 tariffs (Fajgelbaum et al., 2020).
3two most powerful committees dealing with trade policy in Congress (Finance and Ways
and Means), which can affect AD decisions by exerting pressure on the International Trade
Commission (ITC) through various channels (e.g. appointment confirmations, budget allo-
cation, oversight hearings). Second, we show that our instrument is a key predictor of ITC
commissioners’ votes on AD and the probability of success of AD petitions.
We use our instrument to examine the effects of trade protection along supply chains,
focusing on employment. We estimate two-stage least squares (2SLS) regressions in presi-
dential term differences to identify the effects of AD duties on directly exposed and indirectly
exposed industries. We show that trade protection against China reduces the growth rate
of employment in downstream industries, with no significant effects in other (protected and
upstream) industries. Our baseline estimates imply that a one standard deviation increase
in the average input tariff faced by an industry decreases the growth rate of employment in
that industry by 5.3 percentage points, explaining around 25% of the standard deviation of
employment growth.
We provide evidence for the mechanisms behind the negative effects of protection along
supply chains, showing that AD duties decrease imports and increase prices in protected
industries, raising production costs in downstream industries. When focusing on manufac-
turing industries, we show that trade protection has negative effects on both production and
non-production jobs in downstream industries.
Following Acemoglu et al. (2016), we also estimate regressions in long differences and
compute the counterfactual jobs lost due to trade protection, i.e. the additional jobs that
would have been created (or the jobs that would not have been destroyed) in downstream ex-
panding (declining) industries in the absence of AD protection against China. Our estimates
imply that around 2.1 million US jobs were lost in the US economy during 1992-2016. This
figure corresponds to 6.6% of the 32.7 million jobs the US economy added in this period. The
most negatively affected industries were large non-manufacturing sectors (e.g. construction)
that rely on highly protected inputs (e.g. steel).
As mentioned before, our identification strategy is based on a shift-share research de-
sign and relies on exogenous political shocks (changes in the identity of swing states across
electoral terms). Exposure to these shocks varies across industries, depending on their impor-
tance across states (captured by initial employment shares) and their historical experience
in the AD process (captured by pre-sample petitions). One may be concerned about non-
random exposure to the shocks. For example, industries that have more experience in AD
proceedings may be more likely to be declining. Likewise, the importance of an industry in
4swing states may be correlated with other potential drivers of employment growth. Non-
random exposure would give rise to an omitted variable bias in our 2SLS estimates, even
if the political shocks are as-good-as-randomly assigned. We show that we obtain similar
results when we apply the methodology proposed by Borusyak and Hull (2021) to purge our
estimates from this potential bias.
One could also argue that our instrument may be picking up the effects of other policies
that could be used to support industries that are important in swing states. Notice that our
instrument is AD specific, since it combines an industry’s importance in swing states with its
prior AD petitions, implying that we only exploit variation in the political importance of an
industry to the extent that this is relevant for AD protection. To further address concerns
about the exclusion restriction, we control for other policies such as federal and state-level
subsidies. Our 2SLS results are also robust to a battery of additional checks (e.g. including
other protectionist measures and tariffs introduced during Trump’s presidency).
The influential literature on the China shock pioneered by Autor et al. (2013) does not
account for the rise in US trade protection against China, and this could bias the estimated
effect of Chinese import competition on employment growth. We find that our instrument for
trade protection is uncorrelated with Chinese export growth to other high-income countries,
which this literature has used to instrument the growth in US imports from China. This
suggests that the two instruments can be used separately to identify the employment effects
of Chinese import competition and trade protection against China. When we combine them
to jointly study these effects along supply chains, we confirm Acemoglu et al. (2016)’s
finding that import competition from China generated large job losses in directly exposed
and upstream industries, and show that trade protection against China caused additional
job losses in downstream industries, without sheltering jobs in other industries.
Our results resonate with ongoing concerns of US businesses about the costs of protec-
tionist measures against China. For example, in a letter sent on August 5, 2021 to Janet
Yellen (Secretary of the Treasury) and Katherine Tai (United States Trade Representative),
several business associations have urged the Biden administration to “mitigate the tariffs’
significant and ongoing harm to the U.S. economy, U.S. workers, and U.S. national compet-
itiveness.” The letter emphasizes that protection against China exacts “a continued toll on
U.S. manufacturers, service providers, and businesses. Due to the tariffs, U.S. industries face
increased costs to manufacture products and provide services.”6
The rest of the paper is structured as follows. In Section 2, we briefly review the related
6
See https://www.politico.com/f/?id=0000017b-4b3f-d1e7-a1fb-7bffea660000.
5literature. Section 3 provides information on the institutional procedures for the introduction
of AD duties in the United States. Section 4 describes the data and variables used in our
empirical analysis. In Section 5, we explain our identification strategy. Section 6 presents
our empirical results on the effects of protection along supply chains. Section 7 concludes
by discussing the implications of our analysis for the ongoing debates about the use of
protectionist measures, especially against China, in the multilateral trading system.
2 Related Literature
Our paper is related to several streams of literature. First, it builds on the literature on
the China shock, which has examined the effects of rising import competition from China
on US employment (e.g. Autor et al., 2013; Acemoglu et al., 2016; Pierce and Schott, 2016;
Wang et al., 2018).7 In particular, our paper is closely related to Acemoglu et al. (2016) and
Wang et al. (2018), who estimate the employment effects of Chinese import competition in
directly exposed industries and indirectly exposed downstream and upstream industries. We
examine instead the impact of protection against China on employment along supply chains.
A recent stream of literature studies the effects of the US-China trade war. Amiti et
al. (2019) examine the impact on prices and welfare. They show that tariff changes had
little-to-no impact on the prices received by foreign exporters, indicating that the incidence
of Trump’s tariffs has fallen entirely on domestic consumers and importers.8 Flaaen et
al. (2020) find significant price effects due to US import restrictions on washing machines.
Flaaen and Pierce (2019) find that the tariffs introduced by the Trump administration in
2018-2019 drove up the cost of inputs for American manufacturers and, combined with
retaliation by trading partners, destroyed manufacturing jobs. Handley et al. (2019) find
that Trump’s tariffs disrupted firms’ supply chain networks, increasing their production cost
and decreasing their exports. Our analysis differs from recent studies of the US-China trade
war along two main dimensions. First, rather than restricting the analysis to the Trump
era, we study the effects of protection over several decades, exploiting variation in AD duties
against China over time and across products. Second, we employ an instrumental variable
approach to deal with the endogeneity of trade policy.
7
Other studies have considered the effects of increased import competition from China on other outcomes,
such as marriage and fertility patterns (Autor et al., 2019), the polarization of US politics (Autor et al.,
2020a), innovation (Autor et al., 2020b), and mortality (Pierce and Schott, 2020).
8
This complete pass-through result is also supported by other studies (e.g. Cavallo et al., 2019; Fajgel-
baum et al., 2020). Blonigen and Haynes (2002, 2010) focus on US AD duties and find pass-through rates
of around 60%.
6Our identification strategy is based on the findings of the literature on swing-state politics
and trade policy. Muûls and Petropoulou (2013) show that states classified as swing in
President Reagan’s first term benefited from higher protection. Conconi et al. (2017) find
that trade disputes initiated by the United States are more likely to involve important
industries in swing states. Ma and McLaren (2018) show that swing-state politics shaped
the US tariff structure at the end of the Uruguay Round. Fajgelbaum et al. (2020) find
that the tariffs introduced by Trump in 2018 were targeted toward sectors concentrated in
politically competitive counties. In this paper, we show that swing-state politics can also
shape AD duties, the protectionist measure most widely used by the United States.
Our paper also contributes to the literature on trade policy and global sourcing. Various
studies have emphasized the productivity-enhancing effects of importing inputs and input
trade liberalization (e.g. Amiti and Konings, 2007; Goldberg et al., 2010; Halpern et al.,
2015; Antràs et al., 2017; Blaum et al., 2018). Others have examined the effects of trade
policy along value chains (e.g. Feinberg and Kaplan, 1993; Yi, 2003; Blanchard et al., 2016;
Erbahar and Zi, 2017; Conconi et al., 2018; Vandenbussche and Viegelahn, 2018; Jabbour
et al., 2019; Barattieri and Cacciatore, 2020; Bown et al., 2020; Grossman and Helpman,
2020). We contribute to this literature by using an instrumental variable strategy to study
the direct and indirect effects of protection along supply chains.
Finally, our analysis is related to the literature on AD protection (for a comprehensive
review, see Blonigen and Prusa, 2016). Some studies examine the direct effects of AD
duties on imports from targeted countries,9 while others consider the indirect effects on
third countries.10 A few studies examine the effects on welfare (e.g. Gallaway et al., 1999)
and FDI (Blonigen, 2002). To deal with the endogeneity of AD protection, some authors have
combined a difference-in-differences methodology with propensity score matching (Konings
and Vandenbussche, 2008; Pierce, 2011). Ours is the first paper to propose an instrumental
variable for AD duties. As mentioned before, our instrument builds on the literature on the
9
For example, Prusa (2001) provides evidence for the trade destruction effect of AD protection, showing
that US AD measures decreased imports of targeted products by between 30% and 50%. On the extensive
margin, Besedes and Prusa (2017) find that US AD increases the probability of foreign firms exiting the US
market by more than 50%. Lu et al. (2013) use detailed transaction data on Chinese firms and find that an
increase in US AD duties leads to a significant drop in Chinese exports to the United States.
10
Prusa (1997) and Konings et al. (2001) focus on trade diversion, showing that AD duties targeting one
country can lead to an increase in imports from non-targeted countries. Bown and Crowley (2007) show that
AD measures can give rise to trade deflection (i.e. an increase in exports from targeted countries to third
countries) and trade depression (i.e. a decrease in imports of the targeted country from third countries). AD
can also have negative effects on aggregate trade, deterring imports from foreign firms that are not explicitly
targeted. Vandenbussche and Zanardi (2010) estimate that these “chilling effects” account for about a 6%
decrease in aggregate imports.
7determinants of AD protection (e.g. Finger et al., 1982; Bown and Crowley, 2013), and in
particular on those studies that emphasize the role of AD experience (e.g. Blonigen and
Park, 2004; Blonigen, 2006) and domestic political factors (e.g. Moore, 1992; Hansen and
Prusa, 1997; Aquilante, 2018).
3 Antidumping in the United States
Antidumping duties are meant to protect domestic producers against unfair trade practices
by foreign firms. Under Article VI of the General Agreement on Tariffs and Trade (GATT)
and US trade laws, dumping occurs when goods are exported at a price “less than fair value”
(LTFV), i.e. for less than they are sold in the domestic market or at less than production
cost. Multilateral trade rules allow unilateral measures against dumped imports that cause
material injury to domestic producers.
In the United States, AD is administrated by two agencies, each with different com-
petences: the US Department of Commerce (DOC),11 which is in charge of the dumping
investigation, and the US International Trade Commission (ITC), which is in charge of the
injury investigation. The DOC is an integral part of the US Administration, while the
ITC is a bipartisan agency composed of six commissioners nominated by the President and
confirmed by the Senate (with no more than three commissioners from the same party).
An AD case starts with a petition filed to the ITC and the DOC, claiming injury caused
by unfairly priced products imported from a specific country.12 US manufacturers or whole-
salers, trade unions, and trade or business associations are all entitled to be petitioners, to
the extent that they represent their industries. The petitioning process is highly complex,
requiring petitioners to provide extremely detailed information about the case.13
11
Before 1980, the US Department of Treasury was in charge of dumping investigations. The US Congress
decided to move this responsibility from the Treasury to the Department of Commerce, which was seen as
more inclined to protect US firms and workers than the Treasury (Irwin, 2005).
12
An AD case may concern multiple petitions involving different countries exporting the same product. For
instance, in 2008, the AD case (USITC investigations 731-TA-1118 – 731-TA-1121) regarding “Light-Walled
Rectangular Pipe and Tube” targeted imports from China, Korea, Mexico, and Turkey.
13
Petitioners must provide the identity of all producers in the industry and their position regarding the
petition, as well as detailed description and supporting documentation of the material injury to the industry
due to the increased level of imports (e.g. lost sales, decreased capacity utilization, or company closures).
Among others, they also need to provide: “detailed description of the imported merchandise, including
technical characteristics and uses; the volume and value of each firm’s exports of the merchandise to the
United States during the most recent 12-month period; the home market price in the country of exportation;
evidence that sales in the home market are being made at a price which does not reflect the cost of production
and the circumstances under which such sales are made; the petitioner’s capacity, production, domestic sales,
export sales, and end-of-period inventories of U.S.-produced merchandise like or most similar to the allegedly
dumped imports in the 3 most recent calendar years and in the most recent partial-year periods for which
8Once a petition has been filed, the DOC decides whether a product is “dumped,” i.e.
imported at LTFV. The calculation of the dumping margin involves a complex procedure.
According to the law, the DOC defines fair value as the foreign firm’s price of the same
good in its home country. However, this price is not always available, either because the
foreign firm’s sales in its home market are negligible or because the home country is a non-
market economy. If this is the case, the DOC can base the calculation of the fair value on
the exporting firm’s price in third countries or on a constructed value based on the foreign
firm’s costs, when this information is provided.14 A product is declared to be dumped if the
dumping margin is above a threshold established by the DOC.
In the administration of antidumping, the ITC is in charge of the injury investigation.
Under Section 201 of the Trade Act of 1974, the ITC “determines whether an article is being
imported into the United States in such increased quantities as to be a substantial cause
of serious injury, or the threat thereof, to the domestic industry producing an article like
or directly competitive with the imported article.” If the ITC finds that the relevant US
industry has been materially injured, or threatened with material injury, as a result of the
unfairly traded imports, an AD duty equal to the dumping margin established by the DOC
is introduced.
During 1981-2018, the DOC ruled in favor of dumping in 81% of the cases, with significant
variation in the proposed duty rates (the mean and maximum rates are respectively 65%
and 493%, and the standard deviation is 79%). During the same period, the ITC ruled in
favor of the petitioning industry in 68% of the investigations that reached the final stage.15
Note also that AD measures are supposed to be temporary and can only be extended after
the initial five-year period through an expiry review. However, Bown et al. (2020) show that
US AD duties lasted on average for 12 years, with some measures imposed in the 1980s still
in effect as of 2020.
data are available” (see Guidelines for Antidumping Duty Petitions).
14
Article 15 of China’s Protocol of Accession to the WTO allowed other WTO members to treat China as
a non-market economy (NME) until December 2016. To this day, the United States has refused to grant the
status of a market economy to China. Given its NME status, the DOC relies on third surrogate countries
to determine the dumping margin. This results in the imposition of larger duties on Chinese products.
15
These statistics concern the final dumping and injury investigations. The DOC and the ITC also conduct
preliminary investigations (see Antidumping and Countervailing Duty Handbook for more details).
94 Data and Variables
In this section, we describe the data used in our empirical analysis and the variables we
construct to study the effects of trade protection along supply chains.
4.1 Data on Input-Output Linkages
The first source of data used in our empirical analysis is the US input-output tables from
the US Bureau of Economic Analysis (BEA), which we use to identify vertical linkages
between industries. Following Acemoglu et al. (2016), we use the 1992 BEA benchmark
input-output table, fixing technological linkages at the beginning of our sample period.16
We use their concordance guide to convert 6-digit BEA industry codes into 4-digit Standard
Industry Classification (SIC4) codes to be able to combine input-output tables with industry-
level data. This allows us to trace upstream and downstream demand linkages between
479 manufacturing and non-manufacturing (e.g. construction, services) industries. The
disaggregated nature of the US input-output tables is one of the reasons why they have been
used to capture technological linkages between sectors, even in cross-country studies (e.g.
Acemoglu et al., 2009; Alfaro et al., 2016 and 2019).
Figure A-3 in the Appendix illustrates total cost and usage shares for the 479 SIC4 j
industries, focusing on the top-50 input and output industries. Among input industries, some
play a key role in the US economy. For example, steel (SIC 3312) is the most important
input for 82 industries (see Table A-5). We discuss our application of input-output tables
in more detail below, when describing the construction of our measures of exposure to trade
protection.
4.2 Data on Trade Protection
Antidumping Duties
Our main source for the trade protection data is the World Bank’s Temporary Trade Barriers
Database (TTBD) of Bown (2014), which we have updated to include all measures introduced
by the United States to the present.
The TTBD contains detailed information on three forms of contingent protection (an-
tidumping duties, countervailing duties, and safeguards) for more than thirty countries since
1980. For each case, it provides the identity of the country initiating it, the identity of the
country subject to the investigation, the date of initiation of the investigation, the date of
imposition of the measure (if the case is approved), as well as detailed information on the
16
The data are available at https://www.bea.gov/industry/benchmark-input-output-data.
10products under investigation. For the United States, products are identified at the 10-digit
Harmonized Tariff Schedule (HTS) level (or at the 5-digit Tariff Schedule of the United
States Annotated for years before 1989). Appendix A.1 details our matching procedure to
link each investigation to a corresponding SIC4 code.
In our empirical analysis, we focus on AD duties introduced by the United States against
China. As mentioned before (see footnote ??), China was by far the most frequent target
of US AD protection in our sample period. During the seven presidential terms covering
1988-2016, the US initiated 185 cases in which China was accused of dumping. In 74% of
those cases, the US imposed measures on Chinese products.
Combining information on US AD duties with the 1992 US input-output table, we can
construct measures of the direct and indirect exposure to protection along supply chains.
The direct effect is simply captured by the variable
Direct Tariff Exposurej,t = Dutyj,t , (1)
where Dutyj,t is the average AD duty across all HS6 products within a SIC4 industry. This
measure captures variation in both the intensive and the extensive margin of AD protection,
since the average is constructed including HS goods with zero duty.17
Exposure to protection by downstream industries is given by
N
X
Downstream Tariff Exposurej,t = ωi,j Dutyi,t , (2)
i=1
where ωi,j is the cost share of input i in the production of j. This measure is thus a weighted
average of the tariff shocks experienced by j’s suppliers. Similarly, exposure to protection
by upstream industries can be defined as
N
X
Upstream Tariff Exposurej,t = θi,j Dutyi,t , (3)
i=1
where θi,j is the share of industry j’s total sales that are used as inputs in the production of
industry i. Thus (3) is a weighted average of the tariff shocks experienced by j’s customers.
Notice that the variable Direct Tariff Exposurej,t is only defined for the 405 tradable
17
AD duties often vary across exporting firms from the targeted country: those ruled to be cooperative
during the investigation are imposed firm-specific duties, while others receive higher industry-wide duties. In
line with previous studies (e.g. Besedes and Prusa, 2017), we use the “all others” rate to construct Dutyj,t .
We show that our results are unaffected if we use the average of the firm-specific duties. This is not surprising
given the high correlation between the two rates (0.7 for AD duties against China).
11sectors in the economy, to which import tariffs can apply. These include 392 manufacturing
industries and 13 non-manufacturing but tradable industries (e.g. agriculture and mining).
By contrast, the variables Downstream Tariff Exposurej,t and Upstream Tariff Exposurej,t
can be defined for all 479 industries in the economy.
Notice also that Direct Tariff Exposurej,t captures not only the direct effects on producers
of protected goods within SIC4 industry j, but also indirect effects on vertically-related
producers in the same industry. Given the importance of the diagonal of the input-output
matrix, these indirect effects can be large in many industries. As an example, consider
industry SIC 3312 (“Blast furnaces and steel mills”), which includes 235 HS6 products. In
2001, the United States introduced an AD duty against China and other countries on hot
rolled steel products, covering products under 27 different HS6 lines, all belonging to the
same industry (SIC 3312). Hot rolled steel is an input in the production of other HS6
goods included in SIC 3312 that were not covered by AD duties, such as tramway rails (HS
730210).18 The diagonal of the input-output matrix is particularly important for industry
SIC 3312, so protecting some steel products could generate large downstream effects within
the industry.19
Disentangling these effects from the direct effects of protection would require more dis-
aggregated (product-level) input-output tables and employment data for all industries.20
The baseline versions of (2) and (3) are constructed using the Leontief inverse of the input-
-output matrix to incorporate higher-order linkages and capture both direct and indirect
effects of protection along supply chains. In alternative specifications, we construct these
variables using only first-order input-output linkages.
Our benchmark measures of tariff exposure are in line with previous studies on the effects
of trade policy changes (e.g. Topalova, 2010; Kovak, 2013). We also construct versions
of the exposure variables in which each AD duty is weighted by the corresponding import
penetration ratio of the industry, to allow the effects of tariff changes to depend on the degree
of import reliance (e.g. Caliendo and Parro, 2015).21 To deal with endogeneity concerns, we
18
See Talamini et al. (2004).
19
The ωj,j coefficient for industry SIC 3312 is 0.172. For comparison, the mean ωj,j for all industries is
0.035, while the mean ωi,j including the diagonal is 0.002.
20
Cox (2021) constructs a disaggregated input-output table for the steel industry, exploiting firms’ exclu-
sion requests from Trump’s Section 232 steel tariffs. Conconi et al. (2018) construct input-output tables at
the HS6 level (see Online Appendix).
21
PN
For example, this alternative version of Downstream Tariff Exposurej,t is given by i=1 ωi,j Dutyi,t IPi ,
where IPi is the import penetration ratio of input industry i. We measure import penetration as
Importsi /(Importsi + Productioni ). We do not subtract total exports from the denominator, since this
leads to some negative IP measures, possibly reflecting inventories.
12construct this ratio using data from 1991, the earliest available year for US import data. At
that time, the import penetration ratio for China was extremely low (1 percent on average),
and thus we compute import penetration using US imports from from all countries.
In robustness checks, we construct the exposure measures defined in (1)-(3) using the
following alternative measures of AD protection: Alternative Dutyj,t , which is the average
AD duty applied in year t to imports from China across investigations in industry j, and
Product Coveragej,t , which is the share of HS6 goods in sector j covered by AD duties against
China in year t.
Table A-6 reports descriptive statistics of the tariff exposure variables constructed using
the variables Dutyj,t , Alternative Dutyj,t , and Product Coveragej,t . To deal with outliers, in
the empirical analysis, we winsorize (at the 5th and 95th percentiles) the AD variables used to
construct the three tariff exposure measures. Even though our focus is on antidumping, we
also use data on other TTBs (safeguards and countervailing duties), which are less commonly
used than AD duties (see Figure A-2).
Other Protectionist Measures
We also use data on the US most-favored-nation (MFN) tariffs. Unlike AD duties, they
are applied in a non-discriminatory manner to imports from all countries (Article I of the
GATT). The source for MFN tariffs is the World Integrated Trade Solution (WITS) database.
MFN tariffs emerge from long rounds of multilateral trade negotiations: at the end of each
round, governments commit not to exceed certain tariff rates, and tariff bindings can only
be altered in a new round of negotiations.22
In 2018, the Trump administration introduced tariffs on hundreds of goods under three
rarely used US trade laws (Sections 201 and 301 of the Trade Act of 1974, Section 232 of the
Trade Expansion Act of 1962).23 These were stacked on top of AD duties already applying
22
During 1988-2016, the mean applied MFN tariff was 3.4%. Within SIC4 industries, there is little variation
in US MFN tariffs over time: during most of our sample period, the rates applied by the United States
coincide with the tariff bindings agreed at the end of the Uruguay Round of multilateral trade negotiations
(1986-1994).
23
On February 7, the United States introduced safeguard measures on solar panels and washing machines
(with duty rates of 30% and 20%, respectively) under Section 201 of the Trade Act of 1974, which permits
the President to grant temporary import relief, by raising tariffs on goods entering the United States that
injure or threaten to injure domestic industries. On March 23, it implemented 25% tariffs on steel and
10% tariffs on aluminum under Section 232 of the Trade Expansion Act of 1962, which gives the President
authority to restrict imports in the interest of national security. On July 6, August 23, and September 24,
the US implemented tariffs of 25%, 25%, and 10%, respectively, on different sets of products from China
under Section 301 of the Trade Act of 1974, which gives the President authority to impose tariffs against
countries that make unjustified, unreasonable, or discriminatory trade actions.
13to Chinese imports. Some of Trump’s tariffs have hit China exclusively, while others have hit
China along with other countries. We have collected information on these additional tariffs,
which covered $303.7 billion, or 12.6% of US imports in 2017 (Bown, 2019). Relative to AD
duties, the special tariffs introduced by Trump vary much less across SIC4 industries. By
the end of 2018, they applied to 79% of manufacturing industries; the corresponding share
for AD duties applied against China in 2018 was 24%. Trump’s tariffs also exhibited much
less variation on the intensive margin, ranging between 10% and 25%; the corresponding
range for AD duties on Chinese goods in 2018 was 8%-493%.
4.3 Other Data
In our empirical analysis, we make use of several other datasets:
• US Census County Business Patterns (CBP): we use this dataset to study the effects
of input protection on employment. The CBP provides information on industry-level
employment up to 2018. The variable Employmentj,t measures total employment in
SIC4 industry j in year t.
• United Nations (UN) Comtrade database: we use this dataset to measure imports and
import prices. Comtrade provides information on bilateral trade flows at the HS6 level.
To map trade flows in HS to a SIC4 industry, we use the crosswalk provided by Autor
et al. (2013). Appendix A-1 provides more details about this matching procedure. The
variable Importsj,t is the value of imports (in real 2007 dollars). The variable Import
Pricej,t is the average unit value of US imports from China in industry j in year t.24
• US Bureau of Labor Statistics (BLS): we use this dataset to measure domestic and
input prices. The variable Domestic Pricej,t is the producer price index (PPI) in SIC4
industry j in year t.25 The variable Input Pricej,t is the average input price faced by
industry j.26
• NBER-CES Manufacturing Industry Database: we use this dataset to study the effects
of tariffs on different types of workers. We construct the variables Production Workersj,t
24
We first construct unit values at the HS6 level in year t (using the HS1992 nomenclature). We then
convert the data to the SIC4 level (using the HS1992-SIC4 concordance files), weighting the prices of HS6
products by their import values in year t.
25
We normalize both import and domestic prices of each industry to 100 for the year 2000 to create a
harmonized price index.
26
We constructPthis measure by combining PPI data from the BLS with input-output data from the BEA:
N
Input Pricej,t = i=1 ωi,j Domestic Pricei,t , where ωi,j is the cost share of input i in the production of j.
14and Non-Production Workersj,t (number of jobs, in thousands), as well as real Wagesj,t
(in dollars).27
• Database on US subsidies: following recent studies (e.g. Slattery, 2020; Slattery and
Zidar, 2020), we use information from Subsidy Tracker, which provides information
on subsidies by recipient firm from more than 1,000 state, local, and federal economic
programs.28 For each subsidy (or portion of a multi-year subsidy), the dataset provides
information on the recipient company (i.e. company name, headquarters location,
NAICS code), the value and type of the subsidy, the year of award and the level
of government (i.e. state, local, or federal) of the awarding agency. We aggregate
subsidies to the industry-year level, by summing the value of subsidies across recipient
companies.29
5 Identification Strategy
5.1 Endogeneity Concerns
The goal of our paper is to study the effects of protection along value chains, using detailed
information on input-output linkages and exploiting variation in US tariffs across industries
and over time. As pointed out by Trefler (1993), the endogeneity of trade policy poses a
major challenge to examine the effects of tariff changes. For example, positive productivity
shocks to foreign exporters, or negative productivity shocks to domestic producers, are unob-
servables that are related both to employment growth and trade protection. Omitting these
variables from an OLS regression would cause estimates of the direct effect of protection on
employment to be (negatively) biased.
When studying the impact of tariffs along supply chains, a major concern is that the
results might be confounded by unobservables that are correlated both with the level of pro-
tection in upstream industries and the performance of downstream industries. One example
is productivity shocks. A positive productivity shock experienced by foreign input suppliers,
27
To deal with outliers, we winsorize these variables at the 5th and 95th percentiles.
28
These data can be found at https://www.goodjobsfirst.org.
29
For our analysis, we convert the subsidy data from the NAICS classification into the SIC4 classification.
We harmonize NAICS codes over time to the NAICS 1997 nomenclature, using the concordance tables
provided by the United Nations Statistics Division and the procedure of Autor et al. (2013). We assume
that NAICS codes in our data refer to the year of award of the subsidy, as NAICS code data is disclosed and
reported by state and local governments. We then concord NAICS 1997 codes to SIC 1987 codes. When the
NAICS code is not reported, we manually assign a SIC4 code, based on the industry name and the SIC4
description. We exclude entries for which the industry name is missing.
15which allows them to lower their prices, should benefit US firms in downstream sectors. The
same shock can also lead to an increase in input protection: for AD investigations, a surge
in the volume of imports makes it more likely that the industry petitioning for protection
passes the injury test, which largely determines whether the duties are implemented. Since
this omitted variable is correlated in the same direction with both the dependent and the in-
dependent variables, the estimated OLS coefficients will suffer from a positive bias, working
against finding negative effects on downstream industries.
Similar concerns are raised by other potential omitted variables, including lobbying.
Higher tariffs in upstream industries can increase production costs for downstream indus-
tries. Final good producers (e.g. construction companies, car manufacturers) will thus lobby
against high tariffs on their inputs (e.g. steel, car parts).30 If these lobbying efforts are more
pronounced in declining industries, the estimated OLS coefficients would again have a posi-
tive bias.
5.2 A New Instrument for Antidumping Protection
To deal with endogeneity concerns, we follow an instrumental variable (IV) approach. The
logic of our identification strategy is that variation in AD duties should depend on politicians’
incentives to favor key industries in swing states and on industries’ ability to petition for
AD protection.
Our instrument is defined as follows:
IVj,T = Swing Industryj,T × AD Experiencej . (4)
The first component of the instrument, Swing Industryj,T , captures exogenous variation in
the political importance of industries driven by swing-state politics. It builds on the idea that
politicians have incentives to use trade policy to favor important industries in swing states
(e.g. Muûls and Petropoulou, 2013; Conconi et al., 2017; Ma and McLaren, 2018; Fajgelbaum
et al., 2020). The variable Swing Industryj,T measures the importance of industry j in states
classified as swing during presidential term T . In Section 5.2.1, we describe in detail the
construction of this variable.
The second component of the instrument, AD Experiencej , captures exogeneous variation
in the ability of different industries to petition for AD protection. It exploits the fact that, due
30
The literature on political economy of trade policy shows that this type of lobbying is at work (e.g.
Gawande et al., 2012; Mayda et al., 2018).
16to the legal and institutional complexity of the AD process, industries with prior experience in
AD cases face lower costs of filing and a higher probability of success in new cases (Blonigen
and Park, 2004; Blonigen, 2006). The variable AD Experiencej measures the historical
experience of industry j at filing petitions for AD duties. In Section 5.2.2, we provide more
details about the construction of this variable.
Our identification strategy is based on a shift-share research design, which studies the
impact of a set of shocks (or “shifters”) on units differentially exposed to them, with the
exposure measured by a set of disaggregate weights (or “shares”).31 In our setting, the shocks
are driven by changes in the identity of swing states, which generate variation in IVj,T across
electoral terms.
We assume that the identity of swing states is exogenous in our setting, i.e. trade policy
does not affect whether the difference in vote shares between the Democratic and Republican
candidates is below a certain threshold. As discussed below, we use the standard retrospec-
tive definition of swing states, which is based on vote shares in the previous presidential
elections, to alleviate concerns about the validity of this assumption. In Appendix A-2, we
verify that state-level exposure to AD protection during a presidential term has no significant
effect on the identity of swing states at the end of that term. We also show that the extent
to which a state is exposed to import competition (from all countries or from China) is not
correlated with whether or not the state is classified as swing.
Exposure to the political shocks varies across industries, depending on their importance
across states (captured by initial employment shares) and their historical experience in the
AD process (captured by pre-sample AD petitions). When studying the effects of trade
protection along supply chains, exposure depends on the input-output shares defined in
equations (2) and (3). All measures of exposure are constructed using information at the
start of our sample period and are assumed to be exogeneous conditional on industry fixed
effects, which are included in our 2SLS regressions to capture industry characteristics that
might be correlated with exposure shares. Still, non-random exposure to shocks can generate
an omitted variable bias. To deal with this concern, we show that our 2SLS estimates are
robust to applying the “recentering” methodology proposed by Borusyak and Hull (2021).
As discussed in Section 5.3, combining the two components of the instrument is key
to predicting AD protection: by themselves, Swing Industryj,T and AD Experiencej cannot
explain the observed variation in AD duties. Combining the two components also helps to
31
See Bartik (1991) for an early application of this research design and Adão et al. (2020), Goldsmith-
Pinkham et al. (2020), Borusyak and Hull (2021), and Borusyak et al. (2021) for recent contributions on
the statistical properties of shift-share instruments.
17alleviate concerns about the exclusion restriction. To obtain a consistent estimate of the
causal impact of antidumping, our proposed instrumental variable should be uncorrelated
with any other determinant of the dependent variable (Angrist and Pischke, 2009). One may
be concerned that Swing Industryj,T could pick up the effects of other policies that could
be used to favor important industries in swing states. Given that our instrument is the
interaction between Swing Industryj,T and AD Experiencej , it only exploits variation in the
political importance of an industry to the extent that this is relevant for AD protection.32
Moreover, in our 2SLS regressions, we always control for changes in Swing Industryj,T —
and the corresponding changes along supply chains — to account for possible effects of other
policies. Finally, we show that the results are robust to controlling for federal and state-level
subsidies.
5.2.1 Swing Industryj,T
The first component of our instrument exploits exogeneous variation in the political impor-
tance of industries driven by swing-state politics in the United States. In US presidential
elections, voters do not directly choose the executive, they vote for their state’s representa-
tives in the Electoral College, who then vote for the president. The winner-takes-all nature
of the Electoral College implies that candidates can count some states as “safe,” comfortably
in the hands of their party. The states that really matter are the “swing” or “battleground”
states, in which a few thousand or even a few hundred votes can shift the entire pot of
electors from one candidate to the other. As mentioned in Section 2, several studies (e.g.
Muûls and Petropoulou, 2013; Conconi et al., 2017; Ma and McLaren, 2018; Fajgelbaum et
al., 2020) show that US trade policies are biased towards the interests of swing states.33
To define swing states, we use information on the difference in vote shares of Democratic
and Republican candidates in the previous presidential election, in line with the literature.
In particular, the dummy variable Swing States,T classifies a state s to be swing during a
presidential term T if the difference in the vote shares of the candidates of the two main
parties in the previous presidential election was less than 5%. In robustness checks, we use
32
Our instrument predicts no AD protection for industries that are important in swing states (high
Swing Industryj,T ) but cannot exploit this political advantage due to their lack of AD experience
(AD Experiencej = 0).
33
The argument that US politicians use trade policy to favor the interests of swing states is also often
heard in the media. For example, an article in the Guardian pointed out that in a letter to Pascal Lamy
(Europe’s former top trade negotiator), Stephen Byers (former UK secretary of state for trade and industry)
wrote that the 2002 US steel tariffs were introduced by President George W. Bush “to gain votes in key
states like West Virginia, Ohio, Pennsylvania and Michigan where the steel industry is a major employer”
(“Blair ally in poll threat to Bush,” The Guardian, November 17, 2003).
18alternative definitions of swing states.
Figure 2 illustrates the states classified as swing during the last eight presidential terms,
based on the difference in vote shares in the previous presidential elections. During our
sample period, 32 states were classified as swing, some multiple times.
Figure 2
Swing states during the last eight presidential terms
The maps indicate in pink the states classified as swing (less than 5% difference in the vote shares of Democratic and
Republican candidates) during the last eight presidential terms, based on the previous presidential elections.
Our identification strategy relies on changes in the identity of swing states across terms.
For example, the dummy variable Swing States,T changed five times for Missouri during our
sample period (in 1992, 2000, 2004, 2008, 2012). In robustness checks, we randomize the
identity of swing states to create an “expected” instrument, as suggested by Borusyak and
Hull (2021).
To capture heterogeneity in the geographical distribution of industries, we use CBP data
on state-level employment shares. To dispel the concern that these shares might be affected
by trade protection, we use data from 1988, the first year of our sample period.34 To measure
34
Using data from later years would yield very similar results, given that the geographical distribution of
industries across states is stable over time. This can be seen in Figure A-4, which plots state-level employment
shares by SIC4 industry in 1988 and 2011, using data from Acemoglu et al. (2016). The correlation between
the shares in these two years is 0.96.
19You can also read