TREADING WATER Corporate Responses to Rising Water Challenges - Circle of Blue
←
→
Page content transcription
If your browser does not render page correctly, please read the page content below
DISCLOSURE INSIGHT ACTION

TREADING WATER
Corporate Responses to Rising Water Challenges
Written on behalf of 650 investors with US$87 trillion in assets

CDP Global Water Report 2018
2

CONTENTS

4        About this report                                                              26              Infrastructure

5        CEO foreword                                                                   27              Manufacturing

6        Norges Bank Investment Management                                              29              Materials
         commentary

                                                                                        31              Mineral Extraction
7        CDP’s Water Security Program 2018

10       CDP’s Water Security data across the                                           31              Power Generation
         market
                                                                                        32              Retail
11       Global analysis & insights
                                                                                        36        Appendix I
16       Sector summaries                                                                         Report methodology

18              Introduction to sector summaries                                        38        Appendix II
                                                                                                  Key indicators by sector
21              Apparel
                                                                                        42        Appendix III
22              Biotech, Health Care & Pharma                                                     Key indicators by geography

23              Food, Beverage & Agriculture                                            46        Appendix IV
                                                                                                  Company response status and scores
24              Fossil Fuels
                                                                                        76        Appendix V
25              Hospitality                                                                       Investor signatories

                                To read 2018 company responses in full, please go to
                                https://www.cdp.net/en/responses

Important Notice

The contents of this report may be used by anyone providing acknowledgment is given to CDP Worldwide (CDP). This does not represent a license to repackage or
resell any of the data reported to CDP or the contributing authors and presented in this report. If you intend to repackage or resell any of the contents of this report,
you need to obtain express permission from CDP before doing so.

CDP has prepared the data and analysis in this report based on responses to the CDP 2018 information request. No representation or warranty (express or implied)
is given by CDP as to the accuracy or completeness of the information and opinions contained in this report. You should not act upon the information contained in
this publication without obtaining specific professional advice. To the extent permitted by law, CDP does not accept or assume any liability, responsibility or duty of
care for any consequences of you or anyone else acting, or refraining to act, in reliance on the information contained in this report or for any decision based on it.
All information and views expressed herein by CDP is based on their judgment at the time of this report and are subject to change without notice due to economic,
political, industry and firm-specific factors. Guest commentaries where included in this report reflect the views of their respective authors; their inclusion is not an
endorsement of them.

CDP, their affiliated member firms or companies, or their respective shareholders, members, partners, principals, directors, officers and/or employees, may have
a position in the securities of the companies discussed herein. The securities of the companies mentioned in this document may not be eligible for sale in some
states or countries, nor suitable for all types of investors; their value and the income they produce may fluctuate and/or be adversely affected by exchange rates.

‘CDP Worldwide’ and ‘CDP’ refer to CDP Worldwide, a registered charity number 1122330 and a company limited by guarantee, registered in England number
05013650.

© 2018 CDP Worldwide. All rights reserved.
                                                                                                                                                                            3
ABOUT THIS REPORT

    In 2018, 4,969 high impact companies were asked to provide data about their efforts to manage
    and govern freshwater resources through CDP. In total 2,114 companies responded, up from
    1,432 in 2016.
    This data is used by 650 institutional investors,
    representing US$87 trillion in assets to engage with
    portfolio companies, inform investment decisions
    and catalyze change. In addition, 44 purchasing
    organizations, with a combined spend of US$2 trillion,
    use CDP water security data to drive greater insight,
    accountability and action throughout their global
    supply chains.

    This report presents analysis of the response data from
    a sample of 783 of the world’s largest publicly listed
    companies. The report is aimed at companies and
    investors seeking to understand how they can play their
    part in delivering a water secure world.
                                                              1,432                                    2,114
                                                              companies                                 companies
                                                                (2016)                                    (2018)

         KEY FINDINGS

         Corporate action is insufficient to achieve SDG 6 and deliver a water secure future
         { Companies are withdrawing more water year-on-year, despite greater awareness of water risks and more targets
           to reduce withdrawals being set. Between 2015 and 2018, there has been an almost 50% increase in the number
           of companies reporting higher water withdrawals. The increase in withdrawals is most pronounced in Asia and
           Latin America, and in the Food, Beverage & Agriculture, Manufacturing and Mineral Extraction sectors.

         Companies must ensure that water is meaningfully embedded into corporate governance
         { The strategic decisions taken by the CEO and the Board can truly transform a company’s impact on water
           resources. But although companies report high levels of risk exposure and board-level oversight, they have not yet
           tied water issues to performance. We found that among a cohort of companies in high impact sectors, 77% report
           exposure to substantive water risks, and 93% report that they have board-level oversight of water issues, but less
           than a third (31%) have incentives in place for C-Suite executives on water-related issues.

         The Retail sector is lagging behind
         { The Retail sector has moved ahead of the Fossil Fuels sector for the first time in terms of poor performance on
           both transparency and action. Just 24% of retail companies responded to their investors, and fewer than 25% have
           water-related targets or goals.

4
CEO FOREWORD
PAUL SIMPSON, CEO, CDP

                                                  Water is the life blood of our global economy. It is a fundamental
                                                  necessity for lives and livelihoods; for economic prosperity,
                                                  health and development, and environmental sustainability.
                                                  Yet this vital resource remains undervalued.
                                                  Last year, the UN reported that the world is not on               We are seeing some progress, from the companies
                                                  track to meet its goal of ensuring the availability               participating in early efforts to set contextual
                                                  and sustainable management of water and                           water targets; to those seizing opportunities for
                                                  sanitation for all - Sustainable Development Goal                 new water-smart products. For example, German
                                                  6 (SDG 6). In fact, water crises continue to be                   chemicals company Symrise AG now ties 10%
                                                  rated as a top global risk based on both severity                 of its C-suite bonuses to achieving corporate
                                                  and likelihood by the World Economic Forum’s                      sustainability targets, including strategic water-
                                                  Global Risks Report.                                              related targets. And UK consumer goods company,
                                                                                                                    Reckitt Benckiser, has committed to deriving a
                                                  Meanwhile, a warming world continues to put our                   third of its net revenue from ‘more sustainable’
                                                  water supplies at risk. The landmark report from                  products by 2020. An innovation that results in a
                                                  the Intergovernmental Panel on Climate Change                     product reducing its water impact by more than
                                                  (IPCC) showed us that limiting warming to below                   10% per use is classified as a ‘sustainable product’.
     We all face a choice:                        1.5C would see the global population’s exposure
                                                  to water stress lowered by 50% compared to a                      And last year, a new index from Euronext with
     seize the opportunities of
                                                  2C scenario. Yet, the world is currently heading                  Goldman Sachs, in partnership with CDP became
     the transition to a stable                   beyond this guardrail.                                            the first globally to base its selection on how
     climate and a water                                                                                            companies perform on water security, climate
     secure future, or continue                   We all face a choice: seize the opportunities of                  change, and deforestation.
     business as usual and                        the transition to a stable climate and a water
     face untold risks.                           secure future, or continue business as usual and                  These are important and timely reminders of the
                                                  face untold risks.                                                progress we are seeing across the real economy.
                                                                                                                    But there are still serious hurdles in the race
                                                  At CDP, we have been encouraged to see the                        to achieve SDG 6 on water and sanitation. In
                                                  increase in investors and companies stepping up                   October 2018, Brazil elected a president whose
                                                  their engagement with water security over the years.              policies threaten the future of the Amazon
                                                  Ten years ago, when our water security program                    rainforest, a vital source and filter of water for
                                                  was launched, water disclosure was non-existent in                Brazil. In the US, the Environmental Protection
                                                  capital markets. Last year, 2,114 companies, worth                Agency has proposed rollbacks to the Clean
                                                  more than US$18 trillion in market capitalization                 Water Act at a time when US states are being
                                                  disclosed water information to their investors and                urged to issue more bonds and loan guarantees
                                                  customers through our platform.                                   to help finance water infrastructure1.

                                                  However, corporate action is not reaching the pace                There is no time for complacency. Now is the
                                                  and scale needed to truly address water insecurity.               time for businesses to ramp up action and send a
                                                  Our analysis shows that even as companies report                  clear signal to governments that they need policy
                                                  greater risks year on year, freshwater withdrawals                ambition to match. Business as usual is no longer
                                                  are increasing as they expand their production.                   an option, but a prosperous and sustainable
                                                                                                                    water secure future is achievable, if we choose
                                                  Achieving SDG 6 will require a complete                           to rise to the challenge. We must, we can and I
                                                  transformation of our global economy. It will                     believe we will.
                                                  mean unprecedented co-operative action
                                                  from companies, investors, cities, states and
                                                  governments across all sectors.

                                                                                                                    Paul Simpson
                                                                                                                    CEO, CDP

1.   https://www.environmental-finance.com/content/news/us-states-urged-to-issue-more-bonds-to-support-water-projects.html?utm_source=180518na&utm_medium=email&utm_campaign=alert
                                                                                                                                                                                     5
NORGES BANK INVESTMENT MANAGEMENT
    COMMENTARY

                              Norges Bank Investment Management is responsible for
                              managing the assets of the Norwegian Government Pension Fund
                              Global, currently amounting to more than US$1 trillion. We work
                              to safeguard and build financial wealth for future generations.
                              Our objective is to secure the highest possible       We recognize CDP’s important role in driving
                              return with moderate risk. Responsible                increased and improved disclosures, and we
                              investment is a key priority for the fund as it       base many of our assessments on the responses
                              supports the long-term economic performance           through CDP’s platform. We appreciate that
                              of our investments, and reduces financial risks       disclosure frameworks rarely fit completely for
                              associated with the environmental and social          everyone and can often be time consuming to
                              practices of companies in our portfolio.              fill out. We nevertheless encourage companies
                                                                                    to continue reporting through CDP to ensure
                              Water management has been a focus area for            consistency, comparability and a common
                              us since 2009. Water challenges may give rise         repository of water data.
                              to risks and opportunities for companies, and
                              their responses to these may influence long-          Disclosures reflecting board accountability and
                              term returns for the fund as a shareholder.           oversight are something we emphasise. As a
    As a shareholder, we
                              Externalities from unsustainable water use may        shareholder, we expect the boards of companies we
    expect the boards of      also present a risk to our portfolio’s long-term      invest in to ensure that material water challenges
    companies we invest in    value. We have a general interest in sustainable      and opportunities are integrated in corporate
    to ensure that material   water management and efficient water regulation       strategy and investment planning, risk management
    water challenges          across different sectors and geographies.             and reporting. Boards should ascertain that the
    and opportunities                                                               ensuing responsibilities are clearly defined within
    are integrated in         To assess whether companies are adequately            the organisation and they should effectively
    corporate strategy and    managing relevant risks we rely on corporate          guide, monitor and review company management
    investment planning,      reporting. Every year we assess companies’            in carrying out these efforts.
    risk management and       disclosures across indicators of governance,
                              strategy, risk management, supply chains and          Our assessments in 2018 showed a marked
    reporting.
                              metrics and targets. We see the quality and scope     increase in the number of companies where
                              of disclosures as an indicator of companies’          either the board or a board committee directly
                              maturity in water management. Our assessments         oversees water management at the company.
                              inform our company engagements, voting and risk       However, 34% of companies assessed still do not
                              management. The information is also provided          report having board oversight of environmental or
                              to support investment decisions. In 2018, our         water issues. We hope to see even more boards
                              assessments on water management covered 598           ensure appropriate oversight of this important
                              companies in the chemical, consumer goods,            issue going forward.
                              farming and fishing, food and beverage, mining, oil
                              and gas, pulp and paper and power sectors. The        We would like to congratulate CDP on the
                              results show a general improvement in reporting       release of the 2018 Global Water Report
                              on water management compared to 2017. On              and are encouraged by the high number of
                              average, companies assessed in both 2017 and          companies continuing to respond to the revised
                              2018 improved their scores by 8 percentage            questionnaire.
                              points, and around 30 percent of companies with
                              no reporting on water management in 2017 began        Carine Smith Ihenacho
                              to report on this topic in 2018 – some following      Chief Corporate Governance Officer
                              direct interactions with us.                          Norges Bank Investment Management

6
CDP’S WATER SECURITY PROGRAM 2018

Today, our work drives action on water security at scale

         2,114
         companies
                                                                                                                  650
                                                                                                                  investors
         representing over US$18 trillion in market capitalization and                                            with combined assets of US$87 trillion, drive companies
         53% of heavily water dependent companies on the MSCI                                                     to both disclose their impacts on water security and take
         ACWI publicly disclose their progress in managing water-                                                 action to reduce them. This is up from 137 investors in
         related risks and impacts through CDP. This represents a                                                 2010.
         twelve-fold increase on the 175 companies that disclosed
         in 2010.

         36.4
         million
                                                                                                                  628
                                                                                                                  cities
         people are employed by the publicly-listed companies                                                     with a combined population of 1.7 billion people now
         disclosing through CDP’s water security program;                                                         disclose to CDP to build resilience and protect their
         equivalent to the population of Canada.                                                                  citizens from water risks2.

         US$2                                                                                                     110
         trillion                                                                                                 countries
         44 purchasing organizations with a combined annual                                                       CDP is motivating companies to take ambitious action
         spend of US$2 trillion motivate their suppliers to disclose                                              on water security in 110 countries, from Afghanistan to
         water information through CDP, enabling the management                                                   Zimbabwe and from Argentina to Zambia.
         of water impacts through global supply chains.

2.   Last year, CDP reported that 360 cities reported water-related information via CDP. This reflected the number of cities responding to the water section of the cities questionnaire. Here, we display
     the total number of cities disclosing to CDP year on year.
                                                                                                                                                                                                             7
CDP’S WATER SECURITY PROGRAM 2018

    CDP Investor signatories and assets in US$ trillion

                700                                                                   87

                600                                                            69
                                                                 63     67
                                                          60
                500                                57
                                          50

                400
                                 43
                                                                                             { Investors
                300                                                                          { Assets

                200     16

                100

                  0
                       2010     2011     2012      2013   2014   2015   2016   2017   2018

8
Response rate by sector

         62%
                                         61%
                                                         58%
                                                                                        50%
                                                                                                  49%
                                                                                                                       48%
                                                                                                                                   47%
         Biotech, Health Care & Pharma

                                                         Food, Beverage & Agriculture

                                                                                                                                                 41%                41%

                                                                                                                                                                                     31%
                                                                                                  Mineral Extraction

                                                                                                                                                 Power Generation
                                                                                                                                                                                                    24%
                                         Manufacturing

                                                                                                                                                                    Infrastructure

                                                                                                                                                                                     Fossil Fuels
                                                                                                                                   Hospitality
                                                                                                                       Materials
                                                                                        Apparel

                                                                                                                                                                                                    Retail
For more information on each sector’s performance, see our sector summaries on p.18

Facilities at risk across the world
Water withdrawals in 2018: { About the same { Higher { Lower { First year of measurement

For more information on each country’s performance, see Appendix III on p.42
                                                                                                                                                                                                             9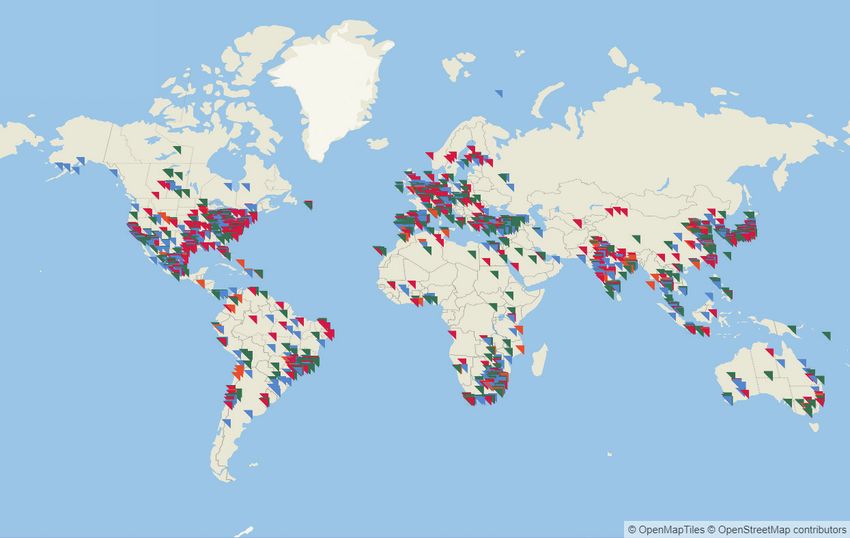
CDP’S WATER SECURITY DATA ACROSS
     THE MARKET

     The benefit of reporting through CDP is that companies disclose standardized, comparable
     in one place annually, and their data is then used by a range of different organizations
     across the globe. This diagram maps just some of the organizations that used CDP data in
     2018 to advance water security.

     CDP’s water security data reaches hundreds of investors, influencing the financial community through the development of investment research,
     products and ratings. Our data also helps businesses to inform their strategy. We work with a range of NGOs on water security issues, and
     increasingly, governments and policymakers are also using CDP water security data to inform their decisions.

           The Ministry of the Environment of Japan uses CDP water and climate data to
           create guidance for the business sector to manage their water risk and adapt to
           climate change. Water disasters are a critical issue in Japan, and the guidance is
           designed to help major companies and suppliers to meet this challenge.                     World
                                                                                                    Resources              Ceres
                                                                                                     Institute

                                       Ministry of
                                                                                           PRI                                       CEO Water
                                      Environment
                                                                                                                                      Mandate
                                        of Japan
                    European                              Ministry of
                   Commission                            Environment                                          Civil
                                                           of Italy
                                                                                                             society
                                                                                                                                         WWF
              UN SDG
            6 Synthesis
                                     Policy
               Report              community
                                                                                                                              650
                                                                                                                          CDP investor
                                                                                                                           signatories
                                                                     CDP water
                Oxford
               University
                                                                    security data                                                      Euronext/
                                                                                                                                       Goldman
                                    Academic                                                               Finance                      Sachs

                                   community                                                              community
                Harvard
               University
                                                                                                                                   S&P Global

                                                     Business                                       ISS
                                                                                                                       MSCI
                                                    community
                                Global
                             Consultancies

                                                                                       Asking our suppliers to disclose to CDP helps us identify
                                             2,114                                     hotspots and opportunities to collectively build sustainability
                                           disclosing           44 global
                                                               purchasing              into our supply chains and increase resilience against
                                           companies
                                                               companies               climate change and water risks. – Diageo

10
GLOBAL ANALYSIS & INSIGHTS
The world is not on track to meet our global water goal of ensuring availability and sustainable
management of water and sanitation for all. The 2018 United Nations report on Sustainable
Development Goal 6 was a stark reminder of this. Unsurprisingly, evidence is mounting that a
failure to achieve our global goals poses a serious threat to financial stability.
In January of this year, the Dutch central bank, DNB, reported that the Dutch financial sector’s exposure to the most water-scarce regions and most
impactful companies totals €97 billion3. And yet, competition for the world’s finite amount of freshwater continues to increase while quality worsens.
Delivering a water secure future will require a complete transformation of our global economy – and the private sector is vital to this effort.
Companies in the food, textile, energy, industrial, chemicals, pharmaceuticals and mining sectors account for and wield influence over 70%
of the world’s freshwater use and pollution. In almost all cases, their business models, practices and products do not align with a water
secure future, a future in which SDG 6 has been achieved.
The financial impact of this situation is already being felt by companies, with US$38.5 billion in water-related financial losses experienced this
year by responding companies. Two companies – Vale and the Tokyo Electric Power Company – account for the lion’s share of these impacts
(US$29.2 billion). But even with these removed, the total financial losses experienced this year (US$9.27 billion) is up from 2017. Further, there is
reason to believe that this financial loss figure may be higher in reality, given that at least 50 companies were unable to provide financial figures
for the impacts reported.
As water crises worsen, these high impact companies are increasingly exposed to risks that could threaten their reputations, revenue and
financial stability. On the other hand, as governments around the world move to address this issue and achieve SDG 6, companies, and the
investors and banks fueling them, face substantial transition risks of stranded assets if they fail to move with the times. In other words, if they
fail to consider how their business models, products and practices must change to decouple production and consumption from the depletion of
water resources.
Investors are increasingly calling on companies to take such steps. In 2018, 650 institutional investors with over US$87 trillion in assets invited
1,536 of the world’s largest publicly listed, high impact companies to disclose water-related information through CDP. These companies depend
on a stable supply of good quality water for success. 783 companies – or 51% – responded to their investors, demonstrating some progress
towards better water performance.
However, important sectors are lagging behind their peers. Of particular concern is the Retail sector, which moved ahead of the Fossil Fuels
sector for the first time in terms of poor performance on both transparency – just 24% of retail companies responded – and action – fewer than
25% have water-related targets or goals and only 54% engage suppliers on water risks and impacts. With revenues anticipated to reach US$28
trillion this year4, this sector is more powerful than ever. Made up of those companies near the top of the agricultural value chain, the retail
sector enables agribusinesses to pump ever increasing amounts of non-renewable groundwater, it enables dyehouses to release toxic pollution,
and consumers to buy ever cheaper meat, but it can also be the key to changing all of this.
3. https://www.dnb.nl/en/binaries/Values%20at%20Risk%20-%20Sustainability%20Risks%20and%20Goals%20in%20the%20Dutch_tcm47-381617.pdf
4. https://www.researchandmarkets.com/reports/3766834/overview-and-evolution-of-the-global-retail
11GLOBAL ANALYSIS & INSIGHTS
Sectors with largest financial impacts
Financial impacts
Most common impacts Most common responses
reported
{ Adopt water efficiency, water re-use,
{ Increased operating costs
recycling and conservation practices
{ Reduction/disruption in production
US$20.5 billion capacity
{ Pollution abatement and control
measures
Mineral Extraction { Fines, penalties or enforcement orders
{ Engage with regulators/policymakers
{ Increased operating costs { Engage with regulators/policymakers
US$9.6 billion { Impact on company assets { Infrastructure maintenance
Power Generation { Increased compliance costs { Increased capital expenditure
{ Reduction/disruption in production { Adopt water efficiency, water re-use,
capacity recycling and conservation practices
US$3.5 billion { Constraint to growth { Amend the Business Continuity Plan
Biotech, Health Care
& Pharma { Increased operating costs { Secure alternative water supply
Company performance on key water metrics
Yes No
29%
71% 41% 59%
Companies that set targets and/or goals Companies that regularly monitor and
at multiple levels of the business manage water aspects across facilities
60% 40% 38% 62% 60% 40%
Companies that integrate water into Companies that conduct a regular and Companies that engage value chains on
governance and strategy mechanisms comprehensive water risk assessment water issues
12GLOBAL ANALYSIS & INSIGHTS
Increasing risks, increasing withdrawals
Decoupling production and consumption from the depletion of water resources requires greater levels of ambition, transparency and innovation.
Our analysis suggests that the pace and scale of change we are seeing from the corporate world is insufficient to meet this challenge.
This year, we examined 296 of the world’s largest companies that have consistently reported water information through CDP between 2015
and 2018. This cohort identified more substantive water risks year-on-year (75% in 2018, up from 70% in 2015) and the number setting targets
to reduce water withdrawals doubled over the four-year period. But this ambition has not translated into actual reduced dependence on water
resources, with an almost 50% increase in the number of companies reporting higher water withdrawals.
This worrying trend holds both for company-wide water withdrawal figures and figures for sites facing substantial water risks, with the biggest
increases among companies in the Food, Beverage & Agriculture, Manufacturing and Mineral Extraction sectors, and those operating in Asia
and Latin America. Further, while there has been a modest reduction (7%) in the number of companies reporting withdrawals from non-
renewable groundwater, companies reporting higher withdrawals from all other sources, including renewable groundwater and surface water,
has risen on average 35%.
The most common explanation that companies provide for increased withdrawals is an increase in production. For example, US beverage
producer, Constellation Brands, Inc. attributed the increase in withdrawals in 2018 to a rise in production, improved metering at some locations
and extreme weather conditions throughout the world necessitating a need for increased water use for irrigation. And Marfrig Global Foods
report that their withdrawals from non-renewable groundwater were 11% higher in 2018 than in the previous year. Groundwater represents 38%
of their total water withdrawal and the increase was due to the opening of new operating plants in 2017.
Unlike carbon, we are not in a race to zero when it comes to water withdrawals – companies and people alike will always need a certain amount
of water to survive and thrive. But as water availability and quality decreases around the world, a failure by business to deliver even a modest
reduction on this indicator is .concerning.
The Water A List: Raising the bar on corporate water action
Given the scale of the water challenges we face, the incremental changes we’re seeing from many companies – acting a little more efficiently or a
little more collaboratively – are unlikely to cut it. Delivering a water secure future not only means better water management but, importantly, better
business management. For example, AstraZeneca has developed a global strategy to cap water use at 2015 levels through to 2025, while doubling
revenue. And Sony Corporation is diversifying its business model to develop new technologies in the agricultural sector that improve productivity
and reduce environmental impact. The company estimates the opportunity could be worth US$4.1 billion over the next four to six years.
In recognition of the changes needed, CDP raised the bar for corporate leadership on water security in 2018. To make the Water Security A List,
companies must now show that they regularly monitor and manage water aspects relevant to their activities through the whole value chain,
that they have regular and comprehensive water risk assessment procedures that are grounded in the river basin and a solid understanding of
how water issues could impact their financial performance. At the same time, they should show that they have implemented a genuine strategic
response to these risks, i.e. a company’s governance mechanisms and long-term business and financial strategies must be informed by and
working to address water security issues.
While some (31), including global drinks company Diageo, French beauty giant L’Oréal and Brazilian petrochemical company Braskem were
able to meet these higher standards and achieve leadership status, the vast majority (752) were not. All company scores and response statuses
can be found in Appendix IV, p.46.
13GLOBAL ANALYSIS & INSIGHTS
Water withdrawals reported by cohort in 2018
120
100
80
60
40
20
0
2015 2016 2017 2018
Number of companies setting targets to reduce water withdrawals
Number of companies reporting higher water withdrawals
Risks reported by cohort in 2018
Type of risk Countries with greatest number of risks (% of risks reported)
Reputation Brazil
& Markets
Chile
6%
China
Regulatory Japan
16%
South Africa
Physical
United States
76% of America
0% 10% 20% 30% 40% 50% 60% 70% 80% 90% 100%
Physical Regulatory Reputation & Markets
Expected timeframe of risks (% of risks reported)
Unknown
More than 6 years
4 - 6 years
1 - 3 years
Current
- Up to 1 year
0% 10% 20% 30% 40% 50% 60% 70% 80% 90% 100%
Physical Regulatory Reputation & Markets
14CDP’S WATER A LIST 2018
{ AstraZeneca { Braskem S/A
United Kingdom Brazil
{ Bayer AG { Brembo SpA
Biotech, Health Manufacturing
Germany Italy
Care & Pharma
{ CNH Industrial NV
United Kingdom
{ Altria Group, Inc. { Firmenich SA
United States Switzerland
{ Asahi Group Holdings, Ltd. { Ford Motor Company
Japan
Food, Beverage United States
& Agriculture { Coca-Cola European Partners
{ International Flavors & Fragrances
United Kingdom
Inc.
{ Diageo Plc United States
United Kingdom
{ KAO Corporation
{ General Mills Inc. Japan
United States
{ LG Display
{ Kirin Holdings Co Ltd
Republic of Korea
Japan
{ Suntory Beverage & Food { LG Innotek
Japan Republic of Korea
{ L’Oréal
France
{ Metsä Board
Finland
{ Galp Energia SA
Portugal { Mitsubishi Electric Corporation
Japan
Fossil Fuels
{ Nabtesco Corporation
Japan
{ Stanley Black & Decker, Inc.
United States
{ Las Vegas Sands Corporation
United States { Toyota Industries Corporation
Hospitality Japan
{ Acciona S.A. { Gap Inc.
Spain United States
Infrastructure Retail
{ Klabin S/A
Brazil
{ Microsoft Corporation
United States
{ LIXIL Group Corporation
Materials Japan Services
15GLOBAL ANALYSIS & INSIGHTS
Embedding water into corporate governance
Companies will not achieve the transformations needed until water is meaningfully embedded into corporate governance. Environmental and
sustainability professionals can make incremental improvements to a company’s water performance, but it is the strategic decisions taken by the
CEO and the Board that will truly transform outcomes for a water secure future. Decisions, for example, associated with product development,
market expansion, or resource allocation, all have the potential to significantly reduce or even eliminate a company’s negative environmental
impacts. And increasingly, investors are looking to hold C-Suite decision makers accountable for their performance on water-related issues.
For the first time in 2018, we are able to assess just how many companies in high impact sectors are rewarding their C-Suite officers for
performance on water-related issues5. Although 77% of this group report exposure to substantive water risks, and 93% report that they have
board-level oversight of water issues, under a third (31%) have incentives in place for C-Suite executives to reduce water withdrawals and just
15% have incentives tied to avoidance of pollution.
For example, German chemicals company Symrise AG ties 10% of its CEO, chief finance (CFO) and chief strategy (CSO) officers’ bonuses to
achieving corporate sustainability targets. These include strategic water-related company targets, such as the annual reduction of wastewater
loadings by 4%, increasing the number and percentage of strategic suppliers participating in CDP’s supply chain program, and the company’s
CDP scores for water, climate and forests.
Accelerating the transition to a water-secure economy
Achieving SDG 6 is possible. To succeed, those companies that affect our freshwater must go to work to protect it. The business risks of inaction
are very real but so too are the opportunities lost. Mainstream financial institutions are moving to seize these opportunities. Indices such as
the Euronext and Goldman Sachs CDP Environment France Index favor companies that perform better on water issues, and banks are now
rewarding leading companies with preferential interest rates for better sustainability performance, such as BBVA’s Sustainability Improver Loan.
The reality, risks and opportunities of a water secure future must be embedded within business, financial and policy decision making. Corporate
transparency plays a vital role in driving the transition to a water secure future by catalyzing a desire to grow differently amongst the private
sector and its extensive supply chains. As the market matures, CDP will continue to raise the bar on corporate water performance to spark the
systemic transformations needed to decouple production and consumption from the depletion of water resources.
5. In 2018, we introduced a question on water performance incentives for the C-Suite in five high impact sectors: food, beverage and tobacco, metals and mining, oil and gas, electric utilities and
chemicals. Only the analysis of the responses from companies that were presented with the question are shown here.
16Sector
summaries
17INTRODUCTION
These sector summaries provide a simple way for investors and others to compare
company performance on key water issues across industry sectors. Investors can assess
strengths and weaknesses and use this information to inform corporate engagement and
facilitate improved disclosure and action.
The sectors are defined by CDP’s new Activity Classification System, which categorizes companies by the diverse activities from which they
derive revenue, and associates these activities with how they impact on water security. You can find a full list of all companies invited to
respond, their response status and score in Appendix IV on p.46.
The sectors analyzed in these pages are:
Apparel Biotech, Health Care Food, Beverage
& Pharma & Agriculture
Fossil Fuels Hospitality Infrastructure
Manufacturing Materials Mineral Extraction
Power Generation Retail
18KEY METRICS
CDP has identified six key management behaviors that investors can expect of any
company. These metrics are aligned with our 2018 scoring methodology and you can read
more about how they are calculated in our report methodology on p.36.
Transparency Risk Assessment
Does the company respond to the request for Does the company conduct a regular risk
information via CDP? assessment including river basin management
authorities?
Some companies report some water-related metrics in
their sustainability reports, but this information is often Water issues differ greatly from one river basin
incomplete and not comparable. CDP offers the only to another. A company considering its water
platform for companies to disclose material water- use alongside the physical, regulatory, social,
related information in a standardized format. Disclosing environmental and temporal context within which it
via CDP enables a company to better understand its risk and its suppliers operate, has a far greater chance of
exposure, identify actions to mitigate these risks and understanding and enhancing its resilience.
seize a competitive advantage.
Targets & Goals
Governance & Strategy Does the company set company-wide targets and/or
Does the company: goals that are monitored at the corporate level
and
{ have board-level oversight of water issues;
targets and/or goals for any two of the following
{ integrate water into long-term business business activity, site/facility, brand, country, or river
objectives and; basin?
{ have a publicly available water policy? Companies must set and achieve ambitious targets
Water governance must be in the boardroom of every to reduce impacts on water availability and quality.
company that can impact on, or be impacted by, water Targets can be set at different levels within the
resources. By providing board members with the company from facilities to products to regions, but all
information and tools to plan for a transition to a water- should be tracked at the corporate level. This allows
secure world and by publicly monitoring progress, the targets to be incorporated into the company’s
water security can become part of companies’ modus overall strategy and performance KPIs, enhancing the
operandi. chance of success.
Measuring & Monitoring Value Chain Engagement
Does the company measure all water aspects at 75% Does the company actively engage value chain
of facilities? (suppliers, customers or other value chain partners)
on water-related issues?
As the saying goes, what gets measured gets
managed. Robust water accounting data is necessary Companies that leverage their procurement power can
to inform business planning and forecasting as well drive change at greater pace and scale through value
as risk identification and response. Companies should chains. By engaging value chain partners on water
regularly measure all water aspects: withdrawals, issues, companies can gather a more complete picture
discharges, quality, consumption, and employee of their water risk exposure and incentivize sustainable
access to WASH (Water, Sanitation and Hygiene). behavior among both suppliers and customers.
Examples of action include onboarding & compliance;
incentivizing improved water management and
stewardship; and innovation & collaboration with value
chain partners.
19HEATMAP
So, how have companies performed on these key management behaviors in 2018?
The heatmap below provides performance by sector, marking in green the best performers
and in red the worst, relative to other sectors. In most cases, there is significant room for
improvement.
Key:
Best performing sector
Worst performing sector
Governance Measuring Risk Targets Value Chain
Transparency
& Strategy & Monitoring Assessment & Goals Engagement
Apparel 50% 46% 31% 62% 38% 55%
Biotech, Health Care & Pharma 62% 39% 63% 60% 31% 47%
Food, Beverage & Agriculture 58% 51% 78% 67% 41% 53%
Fossil Fuels 31% 40% 62% 62% 26% 21%
Hospitality 50% 25% 31% 25% 31% 50%
Infrastructure 41% 59% 56% 73% 26% 29%
Manufacturing 60% 33% 59% 61% 27% 39%
Materials 49% 48% 64% 79% 34% 42%
Mineral Extraction 49% 47% 88% 72% 16% 23%
Power Generation 41% 50% 71% 68% 43% 41%
Retail 24% 32% 18% 32% 25% 54%
Total : 51% 40% 59% 62% 29% 40%
20APPAREL
Response rate Apparel 50% 13/26
Accessories Manufacture 67% 2/3
Clothing Design 36% 4/11
Clothing Manufacture 56% 5/9
Textiles 67% 2/3
How is water material to the Apparel sector?
In the Apparel sector, water is used for dyeing and bleaching, cooling, cleaning and painting processes. Thousands of chemicals are used
in these processes and companies across the apparel value chain can face regulatory and reputational risks if wastewater is not properly
treated. In addition, textile manufacturers rely heavily on water in the value chain for the irrigation of cotton and other natural fibers, and for
leather production for the irrigation of feedstock for cattle. Finally, the use phase of products is an emerging risk for the sector, for example as
microplastics enter water bodies from the washing of synthetic materials.
Apparel
Cross-sector average
sector performance
Transparency 50%
51%
Governance & Strategy 46%
40% The Apparel sector significantly underperforms on measuring &
monitoring water aspects – a cause for investor concern given
the sector’s contribution to water pollution. Just four companies
in the sector monitor total discharge volumes. Investors should
Measuring & Monitoring 31% ask questions about company procedures for measuring and
monitoring withdrawals, discharges, consumption and WASH
59% services for employees.
Risk Assessment 62% The sector must improve its public commitments on water
issues. The most common targets relate to water consumption
62% and product water intensity, but much more can be done on the
prevention of water pollution and WASH provision. Investors
should check for targets aligned with existing initiatives like Zero
Discharge of Hazardous Chemicals (ZDHC), and the Sustainable
Targets & Goals 38% Apparel Coalition.
29%
Encouragingly, the sector outperforms others on engaging the
value chain on water issues. This is a critical area for action, as
Value Chain Engagement 55% water use and pollution by suppliers can cause significant brand
damage and production disruptions. Furthermore, consumers
40% are increasingly aware of the impact of their clothes on the
environment.
21BIOTECH, HEALTH CARE & PHARMA
Response rate Biotech, Health Care & Pharma 62% 64/104
Biotech & Pharma 58% 39/67
Health Care Provision 69% 9/13
Medical Equipment & Supplies 67% 16/24
How is water material to the Biotech, Health Care & Pharma sector?
This sector is primarily comprised of pharmaceuticals companies, with some medical equipment and biotechnology companies and a smaller
contingent of health care services companies. For pharmaceuticals companies, water plays a critical and varied role as a reagent, solvent and
cleaning agent, and companies often require high quality and ultra-pure water in the production and delivery of products6. Monitoring water
discharge quality is also a key consideration as companies must comply with regulations concerning the removal of pharmaceutical compounds
from discharged water. The water-energy nexus is often explicit in this sector as manufacturing plants require cooling systems that can vary in
their water and energy efficiency. Companies may have to trade off emissions reductions goals against efforts to reduce water dependence.
Biotech, Health Care & Pharma
Cross-sector average
sector performance
The sector has the second highest disclosure rate, with large
multinationals such as AstraZeneca and Bayer making the
Transparency 62% 2018 Water A List.
51%
Governance & Strategy 39%
40%
Measuring & Monitoring 63%
59%
The sector must rapidly step up the ambition and number of the
Risk Assessment 60%
water related targets and goals that it sets. Just two reporting
62% companies have a water recycling target and none have set
a watershed remediation or ecosystem preservation goal.
Investors should challenge these companies to set ambitious,
public goals monitored at the corporate level.
Targets & Goals 31%
29%
It is encouraging to see that the sector outperforms the
average when it comes to engaging the value chain. For
example, Merck & Co. has a 2018 target to collect water use
Value Chain Engagement 47% data from at least 90% of strategic suppliers with the highest
environmental impacts. Merck is working with other members
40% of Pharmaceutical Supply Chain Initiative to obtain water
use data from suppliers. In 2017, the company surveyed 224
suppliers, covering approximately 37% of procurement spend.
This represents less than 1% of their total number of suppliers.
6. SUEZ (2017) Ultra-pure water use in semiconductor and pharmaceutical industries. [Online] Available: suezwaterhandbook.com/processes-and-technologies/treatment-and-conditioning-of-in-
dustrial-water/process-water-including-ultrapure-water/ultra-pure-water-used-in-semiconductor-and-pharmaceutical-industries
22FOOD, BEVERAGE & AGRICULTURE
Response rate Food, Beverage & Agriculture 58% 94 /163
Crop Farming 50% 6/12
Fish & Animal Farming 67% 2/3
Food Processing 58% 85/147
Logging & Rubber Tapping 100% 1/1
Why water is material for the Food, Beverage & Agriculture sector
The agricultural sector accounts for almost 70% of the world’s water consumption7, as water is as water is essential for the growing of crops and
animals. Water is also used in the washing, boiling, packaging and transportation of agricultural commodities. For example, cleaning water can
account for as much as 70% of overall water use in soft drinks manufacturing8. Water quality is also an issue: excessive or poor application of
fertilizers and pesticides can lead to nitrate and phosphorus run-offs, polluting waterways and contaminating groundwater. It is estimated that
better water management could boost crop production by 20% globally 9.
Food, Beverage & Agriculture
Cross-sector average
sector performance
The sector beats the average, but there are still some major
global food companies not disclosing water information to their
Transparency 58% investors, including Kweichow Moutai, ITC Limited and Pernod
51% Ricard. Investors must engage this critical sector on their water
use and management to ensure that risks are being managed
appropriately.
Governance & Strategy 51%
40%
Measuring & Monitoring 78%
59%
Risk Assessment 67%
The FBA sector leads on the setting of targets and goals, with
62% excellent examples from companies like AB InBev, which
includes water-related goals in executive targets and financial
rewards. The company’s two goals for 2025 are broken down
in annual milestones and evaluated on an annual basis. These
Targets & Goals 41% goals comprise between 10-25% of the annual monetary
incentives of the executives directly involved.
29%
Encouragingly, the sector is the best performer on value chain
Value Chain Engagement 53% engagement, with a clear majority of companies requesting
water-related information from value chain partners.
40%
7. http://www.fao.org/nr/water/aquastat/water_use/index.stm
8. WRAP. Drinks Resource Maps – Summary and overview. Available at: http://www.wrapcymru.org.uk/sites/files/wrap/Drinks%20Resource%20Maps%20Summary%20FINAL%20010512%20
AG%202_0.pdf
9. http://unesdoc.unesco.org/images/0026/002614/261424e.pdf
23FOSSIL FUELS
Response rate Fossil Fuels 31% 43/138
Coal Mining 28% 5/18
Oil & Gas Extraction 26% 11/43
Oil & Gas Marketing & Retailing 33% 3/9
Oil & Gas Midstream & Other 28% 7/25
Oil & Gas Processing 40% 17/43
Why water is material for the Fossil Fuels sector
Water underpins the exploration, production and refining of fossil fuels, being involved in most parts of the value chain from construction to
drilling, pumping, treatment and cooling. The International Energy Agency says that global water consumption for power generation and fuel
production is expected to more than double from 66 billion cubic meters (bcm) in 2010, to 135 bcm by 2035. Coal accounts for 50% of this
growth and is one of the most-water intensive methods of generating electricity. For some production techniques such as hydraulic fracturing
and oil sands, large volumes of water are required to extract the resource. A major risk within the industry is water pollution which can arise
from spills, cross-aquifer mixing, drill muds and cuttings, disruption and pollution of surface water and groundwater through water discharge,
contamination by pump leakages and oil spillages during transportation. The extraction of hydrocarbons also produces large volumes of water,
which must be safely managed. Oil & gas refining is a water-intensive process and there is also high water pollution potential if products are
spilled. Retailers, midstream, and oil & gas services companies share water pollution and reputational risk with their clients.
Fossil Fuels This sector has consistently had one of the lowest response
Cross-sector average
sector performance rates of all sectors since the inception of CDP’s Water Security
program. Investors should expect greater transparency from
oil and gas majors given the large volumes of water these
companies manage on a daily basis, and the well-documented
Transparency 31% potential for water pollution from their activities. Major non-
disclosers include Exxon Mobil Corporation, Royal Dutch Shell,
51% and Chevron Corporation.
Governance & Strategy 40%
40% The sector achieves average performance for the inclusion
of water issues into governance and strategy mechanisms,
but investors should expect this of all Fossil Fuel companies.
Climate change is now embedded into the strategy of these
62% companies, and water should be too. For example, the Task
Measuring & Monitoring
Force on Climate Related Financial Disclosures requests water
59% metrics from the energy sector.
Risk Assessment 62%
62%
Targets & Goals 26%
29%
Value Chain Engagement 21%
40%
24HOSPITALITY
Response rate Hospitality 50% 17/34
Fast Food Restaurants 50% 4/8
Food & Beverage Services 33% 3/9
Gambling 100% 5/5
Hotels & Lodging 40% 4/10
Recreation & Entertainment Facilities 50% 1/2
Why water is material for the Hospitality sector
Many companies in the hospitality sector have water intensive supply chains through agricultural production of the food and beverages that
they sell. Companies in this sector often have large real estate holdings that can be severely affected by water pollution and scarcity. For
example, water consumption for hotel chains can be high and hotels can be located in water stressed locations. Cost is also a factor: water
accounts for 10% of utility bills in many hotels. These companies can drive change and reduce water impacts through working collaboratively
with their value chain – suppliers and consumers alike.
Hospitality
Cross-sector average
sector performance
The sector does not achieve the average response rate, with
major names such as Oriental Land Co Ltd., Restaurant
Transparency 50% Brands International and Chipotle Mexican Grill not disclosing.
Investors must encourage a significant increase in transparency
51% from this sector, which relies heavily on water.
The sector is the worst performer on the integration of water
Governance & Strategy 25%
issues into business governance and strategy. Investors must
40% encourage restaurant chains and hoteliers to raise the strategic
importance of water issues within the business, ensuring that
the board has oversight of risks and opportunities.
Measuring & Monitoring 31%
59% Companies in this sector often have estates across the
world, for example, restaurants and hotel chains. It is
therefore concerning that companies are not undertaking the
comprehensive risks assessments necessary to map which
Risk Assessment 25% sites are in water-stressed areas, and understand the location
and magnitude of water risks. For example, Interncontinental
62% Hotels reports that they completed a comprehensive water risk
assessment across their global estate in 2016, finding that 2,414
facilities, or 47% of all their hotels, are exposed to substantive
water risk.
Targets & Goals 31%
29%
Value Chain Engagement 50%
40%
25INFRASTRUCTURE
Response rate Infrastructure 41% 44/107
Construction 46% 21/46
Energy Utility Networks 33% 17/51
Non-Energy Utility Networks 60% 6/10
Why water is material for the Infrastructure sector
The Construction sub-sector is dependent on cement and other water-reliant construction materials. Construction companies have also reported
that significant change in precipitation and increased sudden extreme rainfall is a risk for their sites. For Utility Networks, there is water-related
risk through potential issues with flooding, water access and water pollution. Energy Utility Networks often have water intensive supply chains
(coal, natural gas, shale gas fracking); and a potential risk to their business reputationally through media interest.
Infrastructure sector
Cross-sector average
performance
With the third lowest response rate, transparency is poor
within this sector. Major non-responding companies include
Transparency 41% Public Service Enterprise Group Inc., Larsen & Toubro, and
Consolidated Edison, Inc.
51%
Governance & Strategy 59%
40%
Measuring & Monitoring 56%
59%
Risk Assessment 73%
62% Outperforming the sector average, it is encouraging to see
the majority of companies undertaking comprehensive water
risk assessments that include contextual issues and key
stakeholders. 94% include regulators and 86% include river
basin management authorities into risk assessments.
Targets & Goals 26%
29%
It is deeply concerning that Infrastructure companies are failing
to adequately engage their value chain on water issues given
the water risks associated with cement and concrete for the
Value Chain Engagement 29% construction sub-sector, and coal and gas for energy utilities.
40%
26MANUFACTURING
Response rate Manufacturing 60% 304/503
Chemicals 61% 86/141
Electrical/Electronic Equipment 67% 114/171
Light Manufacturing 65% 37/57
Paper Products 58% 11/19
Powered Machinery 52% 30/58
Renewable Energy Equipment 50% 1/2
Transportation Equipment 45% 25/55
Why water is material for the Manufacturing sector
Manufacturing is a diverse sector, and key water uses in the major sub-sectors are outlined below.
{ The Chemicals sub-sector is highly water intensive: water is used for cooling purposes (90%) but also as a raw material, in cleaning,
transport, as a solvent and as part of the final product. The sector faces the risk of spillage of hazardous chemicals which can affect the
quality of local water resources.
{ Electrical Equipment covers components such as displays and touch screens as well as lighting, heating ventilation, air conditioning, power
tools, power management, control, automation and robotic actuators. Ultra-pure water is required to manufacture many of these items,
including semiconductors.
{ Light Manufacturing covers the manufacture of metal parts, which has a water-intensive supply chain via mining, and the manufacture of
plastic products among other things. Water is used primarily for cooling and cleaning, and ultra-pure water is required for some processes.
Furthermore, rinse water used in the production of aluminum, titanium and other composites produces high levels of hazardous wastes and
must be precisely treated.
{ Transportation Equipment covers auto manufacturing, which uses water for surface treatment and coating, paint spray booths, washing,
rinsing, hosing, cooling, air-conditioning systems and boilers. Wastewater then needs to be treated to high standards in order to meet
environmental regulations. This sub-sector also has a water intensive supply chain, as water is required to produce many auto components.
27Manufacturing sector
Cross-sector average
performance
Transparency is relatively high in this sector, but still 200
companies such as Apple Inc., Unilever Nv Cva and Broadcom
Transparency 60% Limited still fail to disclose critical water related information to
their investors.
51%
Given that most manufacturing processes are water-critical,
it is concerning that water issues are not yet widely integrated
Governance & Strategy 33% into company governance and strategy procedures. Some
companies however, are incentivizing positive change at the
40% highest levels of corporate governance such as Braskem S/A,
which provides incentives to the C-suite for the achievement of
company water targets.
Measuring & Monitoring 59%
59%
Risk Assessment 61%
62%
The Manufacturing sector should be leading the way in the
setting of targets and goals – both efficiency targets per
product and, crucially, reduction and elimination of water
Targets & Goals 27% pollution. Investors should challenge companies in this sector to
29% set reaching targets. For example, Ford Motor Company aims
to reduce water use per vehicle produced by 30 percent from
2015 to 2020, with the ultimate goal of manufacturing vehicles
without withdrawing any drinkable water.
Value Chain Engagement 39%
40%
28MATERIALS
Response rate Materials 49% 60/123
Cement & Concrete 36% 9/25
Metal Smelting, Refining & Forming 41% 21/51
Other Materials 50% 7/14
Wood & Rubber Products 69% 22/32
Why water is material for the Materials sector
{ For wood products such as pulp and paper, water is used to create the pulp and flush away unwanted impurities. Industrial effluent from mills can
contain toxic and non-biodegradable organic materials. Deforestation in service to this sector poses a substantial risk for water security worldwide.
{ Cement production requires significant amounts of water for cooling heavy equipment and exhaust gases, in emission control systems such
as wet scrubbers, as well as for preparing slurry in wet process kilns. Discharged water may be altered in terms of temperature, acidity or
suspended solids with potential impacts for the discharge environment.
{ Companies involved in Metal Smelting, Refining & Forming have a water-intensive supply chain (mining) and require large quantities of
cooling water. End products are used as raw materials in the Manufacturing and Infrastructure sectors, which also rely on water.
{ The ‘Other materials’ sector includes glass products and ceramics. Water is used in virtually all ceramic processes, and wastewater can
contain minerals and some heavy metals which must be treated carefully.
Materials
Cross-sector average
sector performance
Materials companies outperform the cross-sector average
for governance and strategy, but at 48% there is still room for
improvement, particularly in the adoption of water policies.
Transparency 49% For example, Saint-Gobain’s water policy, adopted in 2011,
affirms a long-term objective for zero discharge of industrial
51% water in liquid form, while avoiding generating new impacts
for other natural environments and for other parties involved.
The company has also defined a water standard that sets
out minimum requirements for industrial sites must on water
Governance & Strategy 48% management and the prevention of risks of water constraints,
pollution and flooding. The policy also requires that all
40% stakeholders throughout the value chain, including suppliers,
are condiered into consideration. The list of priority sites within
the framework of the Water policy is based on both water
withdrawals and the water stressed areas.
Measuring & Monitoring 64%
59%
Outperforming every other sector, 79% of companies in the
Materials sector such as Duratex S/A, LIXIL Group Corporation
Risk Assessment 79% and Tata Steel have a comprehensive water risk assessment in
place.
62%
Targets & Goals 34% The Materials sector ranks the third highest across sectors when
it comes to setting targets and goals, but there is significant
29% room for improvement. For example, companies can ratchet their
targets once achieved. In 2017, Cementos Argos achieved its
water consumption goal of using 455 litres per tonne of cement
compared with a baseline year of 2012, when the company used
Value Chain Engagement 42% 649 litres of water per tonne. The company has now ratcheted
40% that target, aiming to reach 256 litres per tonne by 2025.
29You can also read