Typological Differences in Railway Station Areas According to Locational Characteristics: A Nationwide Study of Korea - MDPI
←
→
Page content transcription
If your browser does not render page correctly, please read the page content below
sustainability

Article
Typological Differences in Railway Station Areas According to
Locational Characteristics: A Nationwide Study of Korea
Minho Seo * and Dongyoub Lee

                                           Urban Research Division, Korea Research Institute for Human Settlements, Sejong 30147, Korea; dy20@krihs.re.kr
                                           * Correspondence: mhseo@krihs.re.kr; Tel.: +82-44-960-0379

                                           Abstract: This study aims to explore whether railway station areas can be categorized according to
                                           locational characteristics on a nationwide level and whether the typological classification is valid
                                           for planning and development. Thirty-four railway station areas across Korea are analyzed and
                                           categorized using K-means clustering analysis. The results of the analysis prove that for all locational
                                           characteristics of land use, transit accessibility, and spatial form, station areas could be categorized
                                           into urban cores and suburbs. Moreover, the typological classification according to the location of
                                           urban cores and suburbs is valid in terms of development conditions and demand. This result implies
                                           that the role of the public and private sectors must be different in setting the space and size of areas
                                           of influence, and in forming and developing their use depending on the locational characteristics of
                                           station areas. This study contributes to the discussion on diversifying the planning and development
                                           of station areas as the heart of sustainable cities by verifying the types of station areas and their
                                           differences according to locational characteristics in East Asia, including Korea.

                                           Keywords: station area; land use mix; network analysis; K-means cluster; typology; TOD; Korea


Citation: Seo, M.; Lee, D. Typological
Differences in Railway Station Areas       1. Introduction
According to Locational                         With the growing interest in sustainability over the last few decades, constant efforts
Characteristics: A Nationwide Study
                                           have been made to reduce vehicle travel that leads to high carbon emissions, while increas-
of Korea. Sustainability 2021, 13, 4310.
                                           ing the use of environmentally friendly public transportation such as railways. In particular,
https://doi.org/10.3390/su13084310
                                           excluding Japan, which already has a dense railway network, many Asian countries such
                                           as China and Korea are making investments in transportation infrastructure that are as
Academic Editor: Giuseppe Inturri
                                           bold as their rapid economic growth, by quickly expanding their railroads. This change
                                           in spatial structure is expected to have a great impact on urban planning as well. Efforts
Received: 19 March 2021
Accepted: 7 April 2021
                                           to achieve transit-oriented development (TOD) with a focus on railway stations, such as
Published: 13 April 2021
                                           in the US and European countries [1,2], have been recently accepted as a fundamental
                                           premise for urban planning and development in not only Japan and Hong Kong [3], but
Publisher’s Note: MDPI stays neutral
                                           also in China and Korea [4,5].
with regard to jurisdictional claims in
                                                However, compared to countries that have been using TOD as a means of urban
published maps and institutional affil-    planning for a long time, such as the US and Japan, Korea is yet to diversify the use of
iations.                                   TOD in urban planning based on locational characteristics such as land use or the urban
                                           spatial structure of railway stations. The US has developed various types of TOD sites,
                                           such as centers, neighborhoods, and corridors, depending on the urban context in which
                                           the railway stations are located, actively considering these locations in urban planning [6].
Copyright: © 2021 by the authors.
                                           Japan is also using differentiated station area maintenance techniques that consider the
Licensee MDPI, Basel, Switzerland.
                                           relationship between railway stations and the surrounding urban spaces, density, and
This article is an open access article
                                           functions [7]. This implies that various types of TOD plans and project methods are needed
distributed under the terms and            to reflect the functions of the urban spatial structure or surrounding conditions so that
conditions of the Creative Commons         station area development can be pursued effectively.
Attribution (CC BY) license (https://           As argued by Sohn and Kim (2011) [8], Korea has been actively using the concept of
creativecommons.org/licenses/by/           TOD planning in station area development, but has been unable to establish a differentiated
4.0/).                                     plan and development model that can reflect the geographical status or land use of station

Sustainability 2021, 13, 4310. https://doi.org/10.3390/su13084310                                        https://www.mdpi.com/journal/sustainability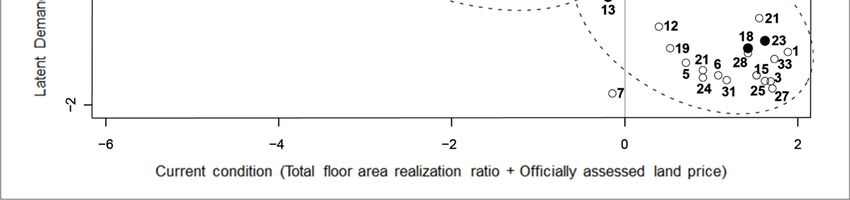
Sustainability 2021, 13, 4310 2 of 16
areas or travel behavior characteristics. As a result, Korea is still seeking the development
of railway station areas in the form of building new towns in suburbs. Consequently, there
are many difficulties in the process of pursuing redevelopment or regeneration to utilize
railway station areas as the new growth centers of urban cores. This is a concern not only
in Korea, but also in many other Asian countries such as China [4]. Therefore, comparative
research is needed in Asian countries such as Korea on how railway station areas can be
categorized according to the urban context, and how approaches to urban planning and
development projects must vary according to the type of railway station area.
This study investigates how railway station areas can be categorized in terms of land
use, transit accessibility, and spatial form, in the context of the spatial structure and location
of cities in Korea. In addition, it examines how development projects for the categorized
railway station areas must be approached differently based on the present and future
project conditions, such as development density or ridership. In Korea, major railway
stations that are connected nationally are divided into old railway stations that have served
as urban centers for decades, and new stations located in the suburbs that have mostly
been added after the 2000s with the implementation of high-speed railways. Therefore,
it is worth investigating whether the geographical location characteristics divided into
urban cores and suburbs can be typologically classified in association with land use, areas
of influence, and form of railway stations. In other words, this study suggests that railway
stations located in urban cores and suburbs vary in terms of general conditions related to
the urban context or station area development. Thus, the approach to urban planning or
development of station areas must also be differentiated.
Accordingly, this study fulfills two major objectives. First, this study verifies whether
types of railway station areas hold valid in the urban context in countries where railroad
networks are rapidly expanding, such as Korea and China, in comparison to countries
like the US and Japan that categorize TOD through cumulative station area development
experience and use it in urban planning and development. Second, this study considers
the different approaches suggested for the categorization of railway station areas in such
developmental projects. Categorization considering the urban context can be used as a
policy decision-making tool by policymakers or urban planners to promote more effective
railway station area planning and development. Moreover, information on urban spaces
and functional differences in railway station areas can contribute to further theoretical and
academic endeavors.
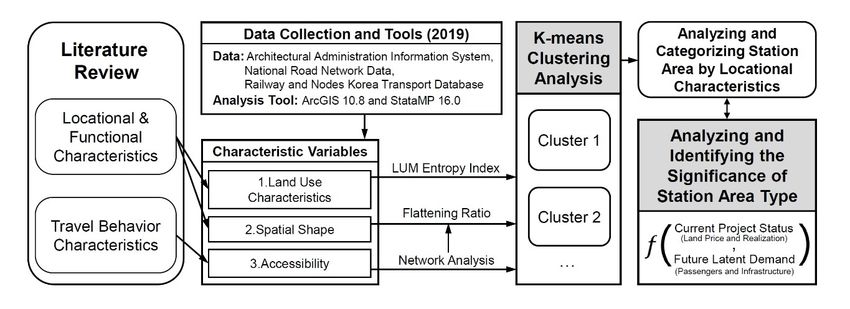
The remainder of this paper proceeds as follows and Figure 1 shows a flow of this
study. The next section reviews the key factors of consideration in the urban context for
the categorization of station areas and implications for urban planning and development
based on theoretical and empirical literature. The third section provides information on
the station areas included in the study, data, and analysis methodology for categorization.
The results of the analysis are provided in the fourth section, which discusses the typo-
logical characteristics of station areas and the differences in approaches to planning and
development. The suggestions based on the results and policy implications of this study
are presented in the final section.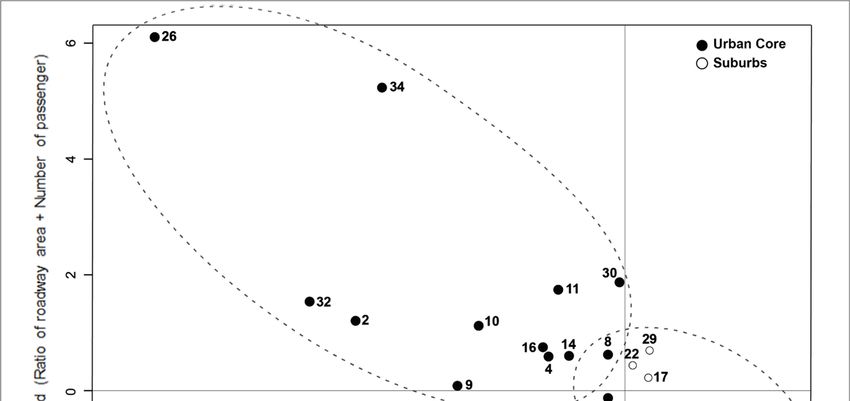
Sustainability 2021, 13, 4310 3 of 16
Sustainability 2021, 13, x FOR PEER REVIEW 3 of 16
Figure 1.
Figure 1. Study
Study flow
flow diagram.
diagram.
Literature Review
2. Literature Review
2.1. Station Area Scope Setting
2.1. Station Area Scope Setting and
and Location
Location Functional
Functional Characteristics
Characteristics
In general,
In general, station
station areas
areas are
are geographical
geographical areas
areas under
under the
the influence
influence of
of railway
railway station
station
areas where users of that railway station mostly reside or carry out various activities
areas where users of that railway station mostly reside or carry out various activities [9,10].
The process of analyzing and interpreting the characteristics of station areas begins
[9,10]. The process of analyzing and interpreting the characteristics of station areas begins with
defining
with the physical
defining boundaries
the physical of station
boundaries areas,areas,
of station as theasspatial structure
the spatial and functional
structure and func-
characteristics of station areas may vary depending on the geographical
tional characteristics of station areas may vary depending on the geographical range. Therefore,
range.
researchersresearchers
Therefore, generally define station
generally areas
define based
station on the
areas Euclidean
based distance ordistance
on the Euclidean about 10–or
15 min of walking time [11,12] and differentiate the physical boundaries of station areas
about 10–15 min of walking time [11,12] and differentiate the physical boundaries of sta-
based on the measure of the impact of public transportation and walking accessibility [13,
tion areas based on the measure of the impact of public transportation and walking acces-
14]. However, according to many studies (Table 1), the scope of station areas is difficult to
sibility [13,14]. However, according to many studies (Table 1), the scope of station areas is
define specifically through measures such as the Euclidean distance or walking accessibility.
difficult to define specifically through measures such as the Euclidean distance or walking
In order to determine the scope of station areas, it is important to consider their functional
accessibility. In order to determine the scope of station areas, it is important to consider
or locational context as well [15,16], and it is necessary to verify whether the characteristics
their functional or locational context as well [15,16], and it is necessary to verify whether
of the areas of influence vary significantly depending on physical boundaries.
the characteristics of the areas of influence vary significantly depending on physical
Table boundaries.
1. Studies on station area scope setting methods and spatial boundaries.
Areas (Radius) TableResearches
1. Studies on station area scope setting methods Contents
and spatial boundaries
(Method)
Surveying light-rail users at transfer stations
lessAreas
than (radius) O’Sullivan and Morrall Researches
(1996) [17]; Contents (Method)
(the points where the selection of walking as a mode sharply
500 m Kim et al. (2001) [18]
Surveying light-rail users at transfer stations
decreased)
less than O’Sullivan and Morrall (1996) [17];
Calthorpe (1993) (the points where the selection of walking as
500 m Kim et al.[19];
(2001) [18] Average walkingdecreased)
distance
500 m Ryan and Frank (2009) [12]; a mode sharply
(normatively stipulating walkable distance from a
–1 km Bertolini (1999) [20];Calthorpe
Lee and Song (2004)
(1993) [19];[21]; Average walking distance
station/distance reached by 90% walking trips)
500 m ChoiRyan
et al.and
(2008) [22](2009) [12];
Frank (normatively stipulating walkable distance
more than
–1 km Givoni and
Bertolini Rietveld
(1999) [20]; (2007)
Lee and[23];
Song (2004) [21]; from a station/distance reached by 90%
Calculating railway service areas for bicycles
Debrezion Choi
et al. et
(2009)
al. [24]; [22]
(2008) walking
1 km (modeling the joint access mode trips)
and railway station choice)
Lee and Leem (2010) [25]
Givoni and Rietveld (2007) [23]; Calculating railway service areas for bicycles
more than
Debrezion et al. (2009) [24]; (modeling the joint access mode and railway
1 km
The
Lee locational
and Leem (2010)and functional
[25] contexts of station areas have
station been generally analyzed
choice)
by categorizing the level of land use distribution or land use mix (LUM). Categorizations
are decided most generally
The locational by the difference
and functional contexts ofinstation
locational
areasconditions
have beenbetween
generally urban cores
analyzed
andcategorizing
by suburbs [19], thebut this
level ofdifference can be subdivided
land use distribution evenmix
or land use more finelyCategorizations
(LUM). by the ratio of
residence
are decided ormost
density of buildings
generally when comparing
by the difference station
in locational areas within
conditions a specific
between urbancity or
cores
limiting the scope to urban railway stations [26,27]. LUM is considered
and suburbs [19], but this difference can be subdivided even more finely by the ratio of first in station
area categorization
residence or densitybecause land use
of buildings whencorrelates with various
comparing factorswithin
station areas such as accessibility
a specific to
city or
commercial
limiting districts
the scope [28], walking
to urban railwayactivity
stations[29], andLUM
[26,27]. surrounding land value
is considered first in[30], thereby
station area
facilitating the because
categorization determination
land use of correlates
locational with
characteristics. Moreover,
various factors such as many studies on
accessibility toSustainability 2021, 13, 4310 4 of 16
station areas focus on discovering what kind of station area planning and development
will ultimately promote the use of public transportation and develop urban functions.
Therefore, analyzing the LUM of station areas allows for the investigation of the spatial
and functional characteristics of station areas to guide future planning and development,
and confirms the presence of other influencing factors such as ridership or travel behavior.
2.2. Travel Behavior Characteristics and Accessibility
However, some studies have attempted to categorize station areas by focusing on
travel behavior characteristics. The travel purpose distribution and behavioral charac-
teristics of station users are effective in categorizing station areas [31], and the radius of
influence, which is the scope of station area planning and development, is determined
by the level of accessibility [14,15]. However, categorizing station areas in terms of travel
behavior patterns poses difficulties in verifying the implications of spatial structure, devel-
opment density, and functional distribution of urban spaces. Therefore, urban planning
studies on the use of station areas mostly adopt the method of setting the travelable radius
of influence and then employing a three-dimensional analysis of how LUM and spatial
structure affect ridership [32,33] and accessibility [34,35].
As examined above, transit accessibility, such as land use characteristics or walking, is
an index used to comprehensively categorize station areas or determine their key charac-
teristics. However, existing researches using this index have several limitations, such as
their data being limited to specific cities, therefore these studies have failed to empirically
analyze the categorization patterns of station areas on a nationwide or metropolitan level.
Moreover, very few studies have specifically revealed whether types of station areas ac-
cording to physical influence or land use characteristics differ from those types that can be
used in planning and projects, or provided in-depth policy implications of the emerging
findings. Calthrope (1993) [11] and Cervero et al. (2002) [1] have provided information on
types of station area development on a nationwide level, but these types do not correspond
with categorizations based on land use and travel behavior characteristics. In particular,
most studies in Asian nations such as Korea have been limited to big cities like Seoul [5]
or been unable to attempt an overall categorization due to their analysis being limited
to individual evaluation indicators such as ridership [8,33], accessibility [29,36,37], and
land-use patterns [38,39]. Therefore, it is necessary to confirm whether the categorization
of station areas based on land use and transit accessibility is still valid on a nationwide
level. Furthermore, it is important to conduct additional research on whether the types of
station areas from the aforementioned method match the types of station areas according
to characteristics such as ridership and development density, which are directly linked to
planning or projects, and thus, can secure logical consistency.
Adopting this perspective, this study categorizes major station areas in Korea at
a nationwide level by considering land use, transit accessibility, and spatial structure
characteristics. It further verifies whether the categorized types of station areas can be
equally categorized in terms of station area planning and development through analysis,
and what the direction of planning and development should be for the different categories
of station areas.
3. Data and Methods
3.1. Selecting Station Areas for Categorization
This study addresses the question of whether railway station areas can be categorized
at a nationwide level. Studies on railway station areas in Korea have mostly focused on
urban railways, and comparative studies of railway station areas at a nationwide level
have been rare [15,21,39]. However, since the opening of the high-speed railways in Korea
in 2002, railway users have increased significantly, both on a nationwide and metropolitan
level. Consequently, there is an increasing interest in station area development around
major railway transfer points in big cities and provinces. Currently, there are 52 main
stations serving as transfer points and last terminals in Korea’s national railway network,Sustainability 2021, 13, x FOR PEER REVIEW 5 of 16
Sustainability 2021, 13, 4310 5 of 16
level. Consequently, there is an increasing interest in station area development around
major railway transfer points in big cities and provinces. Currently, there are 52 main sta-
tions serving as transfer points and last terminals in Korea’s national railway network,
including
including high-speed
high-speed rail.
rail. Of
Of these,
these, 34
34 stations
stations currently
currently have
have plans
plans for
for the
the station
station area
area or
or
development
development projects. Accordingly, this study selected these 34 major railway stations as
projects. Accordingly, this study selected these 34 major railway stations as
targets for analysis.
targets for analysis.
The railway station areas analyzed in this study are geographically distributed in
The railway station areas analyzed in this study are geographically distributed in the
the Korean national territory, as shown in Figure 2 and Table 2, comprising 17 urban core
Korean national territory, as shown in Figure 2 and Table 2, comprising 17 urban core
stations and 17 suburbs stations depending on location. Urban core stations are mostly
stations and 17 suburbs stations depending on location. Urban core stations are mostly
used in Seoul and big provincial cities such as Busan and Daejeon because of the formation
used in Seoul and big provincial cities such as Busan and Daejeon because of the formation
of urban cores around the existing railway stations and for user convenience. However,
of urban cores around the existing railway stations and for user convenience. However,
for other regions, large high-speed railway stations have been established in the suburbs
for other regions, large high-speed railway stations have been established in the suburbs
close to the city in the process of creating a high-speed rail network. As a result, stations
close to the city in the process of creating a high-speed rail network. As a result, stations
in the suburbs are distributed substantially in areas other than big cities, and station area
in the suburbs are distributed substantially in areas other than big cities, and station area
development in these areas remains an important pending regional issue.
development in these areas remains an important pending regional issue.
Figure 2.
Figure 2. Major
Major railway
railwaystation
stationareas
areasininKorea
Koreaand
andtheir location
their types.
location Railways
types. andand
Railways nodes werewere
nodes obtained using
obtained the 2019
using the
data from railway GISDB(Geographic Information System Data Base) provided by The Korea Transport Institute, Korea
2019 data from railway GISDB(Geographic Information System Data Base) provided by The Korea Transport Institute,
Transport Database (KTDB). The administrative boundary is obtained using the 2019 data of administrative districts pro-
Korea Transport Database (KTDB). The administrative boundary is obtained using the 2019 data of administrative districts
vided by the Ministry of Land, Infrastructure, and Transport.
provided by the Ministry of Land, Infrastructure, and Transport.Sustainability 2021, 13, 4310 6 of 16
Table 2. Names of each railway station area and their location types (n = 34).
Location Type Station Area
2 (Busan); 4 (Cheonan); 8 (Daegu); 9 (Daejeon); 10 (DMC, Digital Media City);
Urban center 11 (Dongdaegu); 13 (Gangneung); 14 (Geoje); 16 (Gwangju); 18 (Gyeongju); 23 (Mokpo);
26 (Seoul); 28 (Suncheon); 30 (Suseo); 32 (Wangsimni); 34 (Yongsan)
1 (Andong); 3 (Changwon-Jungang); 5 (Cheonan-Asan); 6 (Chuncheon);
Suburb 7 (Daegok); 12 (Donong); 15 (Gimcheon); 17 (Gwangmyeong); 19 (Iksan);
20 (Jecheon); 21 (Jije); 22 (Kwangwoon University); 24 (Osong); 25 (Pohang);
27 (Singyeongju); 29 (Susaek); 31 (Ulsan); 33 (Wonju)
Note: Railway station areas are listed in alphabetical order.
3.2. Variables Included under Locational Characteristics and their Measurement Methods
As mentioned in Section 2, the key variables that categorize the locational charac-
teristics of station areas are land use, transit accessibility, and spatial structure form. In
this study, the land use of station areas was analyzed based on LUM using the entropy
index. Moreover, transit accessibility was obtained by analyzing the accessible walking
time through network analysis, and the spatial structure form was analyzed using the
flattening ratio.
First, land was defined as an index to measure the diversity of two or more uses [40],
and the most general index that verifies the land use patterns in the city [41,42]. LUM
was indexed through the entropy index as in Equation (1); the entropy index had a value
from 0 to 1, with a value closer to 1 indicating favorable LUM [43,44]. As can be seen in
Equation (1):
∑ny=1 Pu ln( Pu )
LUM = − (1)
ln(n)
where Pu represents the area ratio for u, and n denotes the number of types of use for
analysis.
This study classified the types of use into residential, commercial, business, public,
cultural, and others. The areas of buildings for each use were obtained using the 2019
data from the Internet Architectural Administration Information System provided by the
Ministry of Land, Infrastructure, and Transport.
Second, transit accessibility was based on accessible areas grounded on walking time
and analyzed using network analysis. The radius of influence in railway station areas is
measured in various ways, such as radius based on the Euclidean distance, living zone,
or influence area of land use. However, the standard for this scope is defined differently
among researchers or is merely set in physical boundaries. Thus, recent studies have
generally analyzed pedestrian service areas using network analysis [45,46].
Network analysis is a geographic information system (GIS) spatial analysis technique
that analyzes the accessibility of amenities and the areas in which they are used by analyz-
ing the connectivity and paths of networks such as roads [47]. A network is composed of
nodes and links, and the service area is calculated by establishing a triangular irregular
network (TIN) based on the limit point (Dk ) and network in a certain travel time with
a focus on the starting point (O0 ) designated on the network, and adding TIN, which
is the network path from the designated point to the limit point [48]. This is shown in
Equation (2):
n
RA a = ∑ ∆ti (2)
i=1
where RA a represents the possible range of walking accessibility for Station a, ∆T represents
the overall TIN established based on the pedestrian network, and ∆ti represents the TIN
included in the social network distance (SND).Sustainability 2021, 13, 4310 7 of 16
The path from the center of the designated station (O0 ) to the limit point (Dk ) satisfying
a certain transit time is defined as O0 Dk , as shown in Equation (3):
j
O0 Dk = l1 , l2 · · · l j | ∑ f ( li ) = M (3)
i=1
where l1 , l2 · · · l j represents the set of links that constitute the path O0 Dk , and f (li ) repre-
sents the transit time calibration function.
The path O0 Dk is the sum of link sections (l1 , l2 · · · l j ), each of which comprises links
in which the sum of the transit time derived from the transit time calibration function ( f (li )
is M, thereby satisfying SND. In this study, the average walking speed of adults was set
to 4 km/h, and the standard walking time was measured at 5 min, 10 min, and 15 min to
calculate the walkable zone. The pedestrian network was obtained from the 2019 national
road network data based on the road name address system provided by the Ministry of
Land, Infrastructure, and Transport to reflect both vehicle roads and pedestrian roads.
ArcGIS 10.8 was used for network analysis.
Third, the spatial structure of the station areas was analyzed using the flattening ratio.
The flattening ratio represents the flatness of an ellipse, calculated by subtracting the semi-
minor axis (the shortest distance from the center of the ellipse) from the semi-major axis (the
longest distance from the center of the ellipse) and dividing it by the semi-major axis. The
flattening ratio is an index used to verify the types of spatial forms under the assumption
that the actual station area of influence may not be determined in the form of simple circles
using the Euclidean distance. According to previous studies, the spatial form of station
areas is a major factor to be considered for future development potential [20], and many
actual station areas of influence are in oval or atypical polygonal shapes, suggesting the
need to distinguish squares and rectangles in setting the station areas [49]. Accordingly, this
study analyzed the flattening ratio to identify whether locational types can be distinguished
by the form of the station area’s spatial structure. The longest and shortest distances
derived from the service area of the network analysis were used as the semi-major axis and
semi-minor axis, respectively, of each station area.
3.3. K-Means Clustering Analysis for Categorization
Clustering analysis is a technique used commonly in statistics and machine learning
for categorization as it uses similarity among independent variables without a dependent
variable. There are various methods of clustering analysis, such as hierarchical, K-means,
and DBSCAN (Density-Based Spatial Clustering of Applications with Noise); this study
used K-means clustering analysis to categorize station areas. K-means clustering can
determine the number of groups and is based on distance; thus, it can be used easily
without much consideration of the statistical values—such as the mean, variance, or
median—of the variables [50].
K-means clustering analysis is an algorithm that groups the given data into k clusters,
minimizing the variance of each cluster and distance. Moreover, data within the cluster
have similar properties, whereas the data in different clusters have different properties.
In other words, grouping can be possible with just distribution of observed data, which
meets the purpose of this study, i.e., categorization of the station areas based only on
various locational characteristics without considering the dependent variables for specific
purposes.
The analysis employed in K-means clustering is shown in Equation (4):
N K
argmin
r, c ∑ ∑ rnk || Xn − Ck || 2 (4)
n=1 k=1
Assuming that the number of clusters (k) is determined in advance, rnk is expressed as
a binary variable with a value of 0 or 1 if the nth data belong to the kth cluster, Ck representsSustainability 2021, 13, 4310 8 of 16
the center of the kth cluster, and Xn represents an n number of d-dimensional data. Here,
the distance was measured based on the Euclidean distance. This study standardized
and used three variables of locational characteristics to eliminate bias caused by different
variable units. The statistical program Stata 16.0 was used for K-means clustering analysis.
4. Results and Discussion
4.1. Results of Analyzing Station Area Categorization according to Locational Characteristics
Table 3 summarizes the results of K-means clustering with locational characteristics as
the variables. Two clusters were derived: Cluster 1 comprising 14 station areas, and Cluster
2 comprising 20 station areas. The t-test revealed a statistically significant difference in
all three locational characteristics, as shown in Table 4. Noteworthily, all station areas
under Cluster 1 were located in urban cores, and most station areas under Cluster 2 were
located in the suburbs, indicating the strong typicality of station areas depending on their
location. More specifically, station areas categorized in Cluster 2 had a lower level of LUM
and shorter walking accessibility radius per unit of time than station areas under Cluster
1. In contrast, the station areas in Cluster 2 tended to have a high flattening ratio. This
indicates that while station areas in urban cores are close to a circular shape and form a
mix of various uses with relatively broad areas of influence, those in the suburbs are close
to an oval shape and form less mixed uses with relatively smaller areas of influence.
Table 3. Clustering analysis results (N = 34).
Type Station Area N
2 (Busan); 4 (Cheonan); 8 (Daegu); 9 (Daejeon); 10 (DMC); 11 (Dongdaegu);
Cluster 1 13 (Gangneung); 16 (Gwangju); 18 (Gyeongju); 23 (Mokpo); 14
26 (Seoul); 28 (Suncheon); 32 (Wangsimni); 34 (Yongsan)
1 (Andong); 3 (Changwon-Jungang); 5 (Cheonan-Asan); 6 (Chuncheon);
7 (Daegok); 12 (Donong); 14 (Geoje); 15 (Gimcheon); 17 (Gwangmyeong); 19 (Iksan);
Cluster 2 20
20 (Jecheon); 21 (Jije); 22 (Kwangwoon University); 24 (Osong); 25 (Pohang);
27 (Singyeongju); 29 (Susaek); 30 (Suseo); 31 (Ulsan); 33 (Wonju)
Note: Railway station areas are listed in alphabetical order.
Table 4. T-test results.
Variables. Cluster Obs.1 Mean SD 2 T P
1 14 −0.96 0.79
LUM 3 2 20 0.67 0.39
−7.96 0.000 *
1 14 0.95 0.63
Walking Accessibility Radius 7.73 0.000 *
2 20 −0.66 0.57
1 14 0.82 0.45
Flattening Ratio 5.51 0.000 *
2 20 −0.57 0.86
* p < 0.01, all variables were standardized for analysis. 1 Obs.: observations, 2 SD: standard deviation, 3 LUM: land use mix.
The patterns of each cluster according to the locational characteristics are shown in
Figure 3. First, based on the LUM variables, the average LUM of Cluster 1 was 0.72, while
that of Cluster 2 was 0.55, and this difference was statistically significant. Considering that
each cluster has a similar character based on the station areas’ location in either urban cores
or suburbs, the LUM of station areas located in urban cores is diverse, whereas that of
station areas located in suburbs tends to be homogeneous. In particular, station areas with
a high level of LUM were big provincial cities such as Busan, Daejeon, and Gwangju; these
station areas had a high level of LUM for residential, commercial, and business uses. In
contrast, most station areas located in the suburbs had a relatively high ratio of functions
and uses when planning and developing suburban station areas in the future.Sustainability 2021, 13, x FOR PEER REVIEW 9 of 16
Sustainability 2021, 13, 4310 9 of 16
In contrast, most station areas located in the suburbs had a relatively high ratio of func-
tions and uses when planning and developing suburban station areas in the future.
Variables Scatter Diagram Box Plot
LUM 1
Walking Accessibility
Radius
Flattening Ratio
Figure 3. Cluster patterns according to locational characteristics. 1 LUM: land use mix.
Figure 3. Cluster patterns according to locational characteristics. 1 LUM: land use mix.
Second,there
Second, therewas
wasaadifference
differenceininthe
thedistribution
distribution ofof areas
areas of of influence
influence through
through walk-
walking
ing network analysis by cluster. The average radius of influence of station
network analysis by cluster. The average radius of influence of station areas in Clusters areas in Clus-
ters 1 and 2 was 787 m and 580 m, respectively, with the difference between
1 and 2 was 787 m and 580 m, respectively, with the difference between the two being the two being
statisticallysignificant.
statistically significant. Station
Station areas
areas inin Cluster
Cluster 22 showed
showed consistent
consistent results
results with
with the
the 500–
500–
600 m influence areas set as station areas in many studies [11,13]. However,
600 m influence areas set as station areas in many studies [11,13]. However, station areas station areas
inCluster
in Cluster11proved
provedthat
thatthe
theradius
radiusofofinfluence
influence can
can be
be expanded
expanded to to more
more than
than 800800 m. m. In
In
linewith
line withthe
thearguments
argumentsby byBertolini
Bertolini (1999)
(1999) [20]
[20] and
and Lee
Lee and
and Song
Song (2004)
(2004) [21],
[21], for
for station
station
areaslocated
areas locatedin inurban
urbancores
coreswith
withtightly
tightly oror densely
densely packed
packed urban
urban blocks,
blocks, such
such asas inin the
the
urban spatial structures of Korea or Europe, it might be more valid to set
urban spatial structures of Korea or Europe, it might be more valid to set a larger radius ofa larger radius
of influence.
influence. Moreover,
Moreover, station
station areas
areas located
located inin thesuburbs,
the suburbs,asasshown
shownin inCluster
Cluster 2, 2, lacked
lacked
walking accessibility as the road network was not as densely created as those in urbanurban
walking accessibility as the road network was not as densely created as those in areas.
areas.
Third, the spatial form of the station areas varied between clusters. The average
flattening ratio of station areas in Cluster 1 was 0.57, while that of station areas in Cluster 2
was 0.77. The closer the flattening ratio is to 0, the more a space is considered to resemble aSustainability 2021, 13, 4310 10 of 16
perfect circle. The results show that station areas under Cluster 1 resembled a spatial form
closer to a more compressed ellipse than did station areas under Cluster 2. This may be
partially due to the topographical features of Korea, in which station areas located in the
suburbs such as Pohang Station, Chuncheon Station, or Geoje Station, are adjacent to the
mountains or waterfront.
4.2. Results of Identifying the Significance of Station Area Types Classified by
Locational Characteristics
This study also identified the significance of the types classified by the locational
characteristics of station areas in planning and development. The analysis results proved
that there is a difference in land use, transit accessibility, and spatial form depending on
the type of station area. In terms of urban planning, reflecting this difference is sufficient to
partially improve the existing approach; however, it is important to come up with clearer
implications for each type to improve the development methods.
Therefore, this study identified whether the types classified by locational characteris-
tics are still valid from the viewpoint of development, with a focus on a few key variables of
development. Seo et al. (2018) [51] provided an analytical framework that revealed project
tendency through expert group interviews with private developers and policy-making
authorities using the parameters of current project status and future latent demand. The
key indicators that determine the current project conditions in Korea include the total floor
area realization ratio compared to the regulated total floor area and officially appraised
land prices. This is because it is easy to carry forward the project in station areas with
relatively low total floor area realization ratios and land prices due to large density changes
from the development project as well as the low initial capital required [51]. Moreover, the
key indicators to estimate the future latent demand are represented by the ridership of the
station and the density of infrastructure such as roads. Since a considerable amount of
the profit from station area development is reinvested in maintaining the infrastructure,
the project feasibility can be improved by securing the infrastructure, and the estimated
number of station area users is the most important factor that determines project feasibility.
The judgment related to the effect of the station area development project based on these
indicators is consistent with the results of previous studies investigating this phenomenon
in Korea [15,38,52]. Therefore, this study used the total floor area realization ratio and
officially appraised land prices as the indicators representing the current project status, and
the ratio of roadway areas and the number of passengers as the indicators representing the
future latent demand, and verified whether similar typological characteristics are found in
the same station areas after standardization.
The results showed that there was a clear tendency between station areas located in
urban cores and those located in the suburbs, as shown in Figure 4. More specifically, in
terms of current project status, station areas located in urban cores showed higher total
floor area realization ratios and officially appraised land prices than those located in the
suburbs. This may be due to the constant increase in demand and land value in business
and commercial districts and functions around railway stations during the process of the
expansion of urban sprawl around railway stations in the past [1,7]. Thus, station areas
located in the suburbs may seem relatively more favorable in terms of current project
feasibility. Meanwhile, in terms of future latent demand, station areas located in urban
cores showed a larger number of passengers and a higher density of infrastructure than
those located in the suburbs. Therefore, in terms of future latent demand, station areas
located in urban cores are relatively more favorable.expansion of urban sprawl around railway stations in the past [1,7]. Thus, station areas
located in the suburbs may seem relatively more favorable in terms of current project
feasibility. Meanwhile, in terms of future latent demand, station areas located in urban
Sustainability 2021, 13, 4310 cores showed a larger number of passengers and a higher density of infrastructure11than
of 16
those located in the suburbs. Therefore, in terms of future latent demand, station areas
located in urban cores are relatively more favorable.
Figure 4.
Figure 4. Results
Results of
of analyzing
analyzingthe
thecurrent
currentproject
projectstatus
statusand
and future
future latent
latent demand
demand of of station
station areas.
areas. Statistics
Statistics for for
eacheach
variable
variable used in the analysis are presented in Appendix A.
used in the analysis are presented in Appendix A.
It is notable
It is notable that
that Clusters
Clusters 11 and
and 2,2, classified
classified byby locational
locational characteristics
characteristics of
of station
station
areas, couldbebe
areas, could easily
easily divided
divided into cores
into urban urbanand cores andrespectively.
suburbs, suburbs, respectively. This
This classification
classification is also valid in the types of station area development considering
is also valid in the types of station area development considering project conditions and project
conditions and demand.
demand. Therefore, Therefore,
in the urban contextin ofthe urban
Korea, thecontext of Korea,
typological the typological
classification of station
classification of station areas into urban cores and suburbs can be applicable
areas into urban cores and suburbs can be applicable to locational characteristics to locational
as well as
characteristics
to planning and asdevelopment
well as to planning and development conditions.
conditions.
Discussion on
4.3. Discussion ona aDifferential
DifferentialApproach
Approachof theofStation Area Type
the Station Areain Type
Planning and Development
in Planning and
Development
The above analysis results show several implications as follows. First, it may be
difficult
Thetoabove
adoptanalysis
an approachresultssimilar
showtoseveral
that of urban cores for
implications asthe allocation
follows. First,ofitfunctions
may be
and usesto
difficult when
adopt planning and developing
an approach similar to station
that of areas
urbanofcores
the suburbs in the future.
for the allocation Because,
of functions
in theuses
and urban context
when of Korea,
planning and station areas located
developing stationin areas
the suburbs
of theare based on
suburbs in the
thepremise
future.
of the formation of large-scale new satellite towns, and division of the
Because, in the urban context of Korea, station areas located in the suburbs are based land in large blocks.
on
Therefore,
the premise of the formation of large‐scale new satellite towns, and division of the landthe
it is better to maintain the spatial scope at a certain level, considering in
function
large of railway
blocks. stations
Therefore, it in
is the process
better of planning
to maintain theand developing
spatial scope station areas in
at a certain the
level,
suburbs. It isthe
considering alsofunction
necessary of to consider
railway designing
stations theprocess
in the scope ofofplanning
planningand anddevelopment
developing
of station
station areasininthe
areas the suburbs.
suburbs in It light of their
is also expansion
necessary in a longdesigning
to consider rectangle shape,
the scope rather
of
than recklessly setting it in a circular form, considering the surrounding topographical
conditions. This is because in the case of railway station areas in the suburbs where
pedestrians or the road network is not evenly formed, planning and developing the station
area in a circular shape based on Euclid distance may be inefficient as it forms areas with
weak accessibility.Sustainability 2021, 13, 4310 12 of 16
In addition, even if the current business conditions are relatively unfavorable, station
areas located in urban cores have a high future latent demand and can be developed more
quickly if the regulations on building density are relaxed through incentives in terms
of urban planning. Japan, which has a similar urban space context as Korea, has been
applying this method for developing station areas in urban cores, such as those in Tokyo
and Osaka, and showing outcomes in development [3,7]. Therefore, it may be effective
to approach the planning and development of station areas located in urban cores by
attracting private sector entities to make investments, while the public sector focuses on
institutional support. In contrast, station areas located in the suburbs may have advantages
in the current project conditions, but it may be difficult to attract investment from the
private sector for these projects due to low future latent demand. Moreover, according to
the results of the clustering analysis, there is a low possibility of expansion in these station
areas in terms of LUM or infrastructure. Therefore, to encourage development in station
areas located in the suburbs, it is necessary for the public sector to first make investments
and improve land use with a focus on public functions; the effect of private investment
can then be anticipated within a limited range. Especially, since the station area in the
urban core has high potential demand in the future, the private sector should take the
initiative to expand public facilities and public spaces that are insufficient in the urban core,
while securing construction density and incentives for use in the public to secure business
feasibility. On the other hand, in the case of station areas in the suburbs, the private sector
does not have enough development feasibility to promote the project alone, so in the short
term, it is necessary to jointly secure anchor facilities in combination with public projects.
In addition, if demand expands in the future, a strategy to gradually expand the business
from a long-term perspective is expected to be effective.
5. Conclusions
The goal of this study was to explore whether railway station areas can be categorized
on a nationwide level based on the urban context of East Asian countries, including Korea,
and whether categorization according to locational characteristics is still valid in planning
and development conditions. This study contributes to the discussion on station areas in
East Asia, especially Korea, where station areas are gaining importance with the expansion
of high-speed rail networks. Furthermore, it contributes to setting the direction for the
planning and development of station areas by investigating the typological characteristics
of station areas in terms of locational characteristics such as land use, walking accessibility,
and spatial form.
In summary, a clear pattern that can classify the major railway station areas in Korea
into urban cores and suburbs was found for all three locational characteristics. Station
areas located in urban cores formed relatively broader areas of influence and had a high
level of LUM, while those located in the suburbs formed relatively smaller areas of influ-
ence and had a low level of LUM with a high ratio of residential use. There was also a
statistically significant difference between urban cores and suburbs in the form of station
areas. Moreover, both types showed a shape closer to an ellipse than a circle. This result
shows that it is necessary to take a differential approach to the planning and development
of station areas. Furthermore, the spatial location of urban cores and suburbs in the urban
context may be considered to have a considerable effect on the function and influence of
station areas.
Categorization according to the locational characteristics of station areas was found to
be valid in terms of the project approach for development. The typological classification of
urban cores and suburbs showed a statistically significant difference in terms of the current
and future project conditions. Station areas located in urban cores had an advantage in
future latent demand, whereas those located in the suburbs had an advantage in the present
project conditions. These results imply that setting an effective policy direction for station
area development in the future should involve attracting private investment combined
with institutional support from the public sector for urban core station areas, attractingSustainability 2021, 13, 4310 13 of 16
public investment, and securing optimum use for station areas in the suburbs. Above all, it
is necessary to differentiate the planning and development strategies depending on the
type of station area. For the station area in the urban core, it is effective for the private sector
to lead planning and development by offsetting investment in public facilities that are
insufficient with incentives such as density. In addition, for the station area in the suburbs,
the private sector is effective to support public-led projects to secure anchor facilities first
and expand demand and development areas in the long term.
This study also had a few limitations, which need to be addressed in future research.
First, while this study focused on analyzing station areas on a nationwide level, the
typological pattern may be different if the spatial scope is limited to the city level. Therefore,
it is necessary to identify whether the typological classification of urban cores and suburbs
is still valid for intercity units that have been a major geographical measure in studies
related to station areas. Second, it is necessary to identify how the typological characteristics
of station areas in the context of Asian countries, including Korea, are different from those
of station areas in the US, Japan, and Europe. Such international comparative studies
can contribute to improving the planning model for station areas, including TOD and
typological diversification of station area development strategies. Finally, since this study
reflects the specific context of an Asian country undergoing rapid expansion of high-
speed railways and cities, further research must verify the impact of the development of
high-speed railways and cities in association with the changes in station areas.
Author Contributions: M.S. designed this study, performed the analyses, and wrote the first draft;
D.L. performed the analyses jointly and improved the methodological part. Both authors have read
and agreed to the published version of the manuscript.
Funding: This research was funded by a research grant entitled “The Revitalization of the Develop-
ment Project and the Improvement of Legal System in the Station Area” from the Ministry of Land,
Infrastructure, and Transport in Korea.
Institutional Review Board Statement: Not applicable.
Informed Consent Statement: Not applicable.
Data Availability Statement: The data will be made available upon request to the corresponding
author.
Acknowledgments: This research is a part of a broader research entitled, “A Study on Facilitation of
Urban Regeneration in Station Areas towards Energy Efficient Cities” to be published by the Korea
Research Institute for Human Settlements at the end of 2019.
Conflicts of Interest: The authors declare no conflict of interest.
Appendix A
Cities and Counties Listed for Each of the Functional Urban Regions.
Table A1. Variable of the current project status and future latent demand of station areas.
Current Project Status Future Latent Demand
Cluster Type Station Area Total Floor Area Officially Appraised Ratio of Roadway Number of
Realization Land Price Areas Passengers
(%) (Thousand Won */m2 ) (%) (Millions/Year)
Busan 18.1 4960 30.1 24.13
Cheonan 21.7 1560 25.0 6.02
Daegu 18.3 3060 19.5 5.41
Cluster 1
Daejeon 18.1 1510 23.6 19.54
DMC 19.4 4150 23.1 17.38
Dongdaegu 30.1 2080 8.9 25.65Sustainability 2021, 13, 4310 14 of 16
Table A1. Cont.
Current Project Status Future Latent Demand
Cluster Type Station Area Total Floor Area Officially Appraised Ratio of Roadway Number of
Realization Land Price Areas Passengers
(%) (Thousand Won */m2 ) (%) (Millions/Year)
Gangneung 19.2 420 21.1 3.46
Gwangju 24.5 910 29.8 0.43
Gyeongju 11.5 850 9.1 0.98
Mokpo 13.8 320 7.8 0.58
Seoul 26.1 11210 36.1 42.10
Suncheon 12.5 320 7.9 2.55
Wangsimni 21.1 4720 29.3 31.02
Yongsan 28.1 13100 19.3 34.72
Andong 11.5 710 5.5 0.52
Changwon-
8.9 210 5.8 2.25
Jungang
Cheonan-Asan 9.4 1030 10.6 7.08
Chuncheon 9.5 310 12.8 1.78
Daegok 7.1 310 22.4 1.13
Donong 11.5 2010 14.5 5.52
Geoje 22.3 1340 26.8 1.19
Gimcheon 9.3 360 8.6 0.57
Gwangmyeong 16.5 2610 12.0 10.06
Cluster 2
Iksan 10.6 1240 13.4 5.43
Jecheon 16.8 260 7.7 1.42
Jije 10.1 320 13.3 1.36
Kwangwoon Univ. 19.6 1960 17.6 4.81
Osong 8.6 610 9.1 6.76
Pohang 8.2 510 6.1 2.62
Singyeongju 8.1 180 6.8 0.87
Susaek 17.5 3630 18.6 1.35
Suseo 16.1 7830 10.9 15.12
Ulsan 8.5 460 8.7 4.28
Wonju 10.7 620 6.2 1.36
* One thousand won is about 0.87 US dollars in 2019.
References
1. Cervero, R.; Ferrell, C.; Murphy, S. Transit-oriented development and joint development in the United States: A literature review.
In Transit Cooperative Research Program Research Results Digest; Transportation Research Board: Washington, DC, USA, 2002.
2. Ren, T.; Dorina, P.; Sander, L.; Luca, B.; Dominic, S.; Erwin, K. Is transit-oriented development (TOD) an internationally
transferable policy concept? Reg. Stud. 2018, 52, 1201–1213. [CrossRef]
3. Zacharias, J.; Zhang, T.; Nakajima, N. Tokyo Station City: The railway station as urban place. Urban Des. Int. 2011, 16, 242–251.
[CrossRef]
4. Wangti, X.; Andrew, G.; Yingling, F.; Yongling, L. Transit-oriented development in China: Literature review and evaluation of
TOD potential across 50 Chinese cities. J. Transp. Land Use 2017, 10, 743–762.
5. Sung, H.; Choi, C. The link between metropolitan planning and transit-oriented development: An examination of the Rosario
Plan in 1980 for Seoul, South Korea. Land Use Policy 2017, 63, 514–522. [CrossRef]
6. Reconnecting America’s Center for Transit-Oriented Development. Station Area Planning: How to Make Great Transit-Oriented
Places; Department of Transportation, USA: Washington, DC, USA, 2008; pp. 4–14. Available online: http://reconnectingamerica.
org/assets/Uploads/tod202.pdf (accessed on 4 March 2021).
7. Nikken Sekkei ISCD Study Team. Integrated Station-City Development. Archit. Urban 2013, 13, 64–69.
8. Sohn, D.; Kim, J. An Analysis of the Relationship between the Morphological Characteristics of Transit Centers and Transit
Riderships in Seoul Metropolitan Region. J. Archit. Inst. Korea Plan. Des. 2011, 27, 177–184.
9. Park, S.; Sohn, D.; Lee, J. A Spatial Analysis of Transit Centers in Seoul Metropolitan Region for Developing Transit Oriented
Urban Environments. J. Korean Soc. Civ. Eng. 2009, 29, 111–120.
10. Lim, H. A Study on Transit-Oriented Development Method to Activate Transit Use for High Urban-Density Multi-Nucleated
Seoul. J. Korean Soc. Transp. 2005, 23, 93–104.Sustainability 2021, 13, 4310 15 of 16
11. Cervero, R.; Kockelman, K. Travel demand and the 3Ds: Density, diversity, and design. Transp. Res. D Transp. Environ. 1997, 2,
199–219. [CrossRef]
12. Ryan, S.; Frank, L.F. Pedestrian environments and transit ridership. J. Public Trans. 2009, 12, 39–57. [CrossRef]
13. Debrezion, G.; Pels, E.; Rietveld, P. The impact of railway stations on residential and commercial property value: A meta-analysis.
J. Real Estate Finan. Econ. 2007, 35, 161–180. [CrossRef]
14. Lee, Y.S.; Sohn, D.W. A Relationship Analysis between Subway Transit Demand and Urban Spatial Characteristics in the Subway
Station Area. J. Urban Des. Inst. Korea 2012, 13, 23–32.
15. Kim, H.; Nam, J. The size of the station influence area in Seoul, Korea: Based on the survey of users of seven stations. Int. J. Urban
Sci. 2013, 17, 331–349. [CrossRef]
16. Tong, X.; Wang, Y.; Chan, E.H.; Zhou, Q. Correlation between transit-oriented development (TOD), land use catchment areas, and
local environmental transformation. Sustainability 2018, 10, 4622. [CrossRef]
17. O’Sullivan, S.; Morrall, J. Walking Distances to and from Light-Rail Transit Stations. J. Transp. Res. Board 1996, 1538, 19–26.
[CrossRef]
18. Kim, S.H.; Lee, C.M.; An, K.H. The influence of walking distance to transit stop on modal choice. J. Korea Plan. Assoc. 2001, 36,
297–307.
19. Calthorpe, P. The Next American Metropolis: Ecology, Community, and the American Dream; Princeton Architectural Press: Toronto,
ON, Canada, 1993.
20. Bertolini, L. Spatial development patterns and public transport: The application of an analytical model in the Netherlands. Plan.
Pract. Res. 1999, 14, 199–210. [CrossRef]
21. Lee, J.Y.; Song, T.S. The analysis of the change of subway access area and subway user’s behaviors in the new town of the capital
region. J. Korea Plan. Assoc. 2004, 39, 93–103.
22. Choi, Y.; Kim, T.H.; Park, J.S. Development of selection model of subway station influence area (SIA) in Seoul city using chi-square
automatic interaction detection (CHAID). J. Korean Soc. Railw. 2008, 11, 504–512.
23. Givoni, M.; Rietveld, P. The access journey to the railway station and its role in passengers’ satisfaction with rail travel. Transp.
Policy 2007, 14, 357–365. [CrossRef]
24. Debrezion, G.; Pels, E.; Rietveld, P. Modelling the Joint Access Mode and Railway Station Choice. Transp. Res. Part E 2009, 45,
270–283. [CrossRef]
25. Lee, J.Y.; Leem, Y.T. The establishment of B-TOD and setting up transit access distance by cycling choice. J. Korea Plan. Assoc.
2010, 45, 149–160.
26. Dittmar, H.; Poticha, S. Defining transit-oriented development: The new regional building block. In The New Transit Town: Best
Practices in Transit-Oriented Development; Island Press: Washington, DC, USA, 2004; pp. 19–40.
27. Kim, S.Y.; Eom, S.Y.; Lee, M.H. A Study on Spatial Range of Seoul Subway Station Area on Characteristics of Land Use. J. Korea
Plan. Assoc. 2013, 48, 23–37.
28. Park, K.M.; Choi, C.K. Influence of Neighborhood Land Use on Residents’ Choices of Shopping and Leisure Facilities. J. Korea
Plan. Assoc. 2012, 47, 249–263.
29. Sung, H.; Lim, B.; Bessell, M.S.; Kim, J.S.; Hur, H.; Chun, M.Y.; Park, B.G. Sejong open cluster survey (SOS). 0. Target selection
and data analysis. J. Korean Astron. Soc. 2013, 46, 103–123. [CrossRef]
30. Jin, E.A.; Kim, D.Y.; Jin, J.I. The Effects of Mixed Land Use on Housing Price—Focused on the Apartment and General Housing
Prices. J. Korea Plan. Assoc. 2016, 2011, 77–92. [CrossRef]
31. Sung, H.; Kim, T. A Study on Categorizing Subway Station Areas in Seoul by Rail Use Pattern. J. Korean Soc. Transp. 2005, 23,
19–29.
32. Ewing, R.; Cervero, R. Travel and the built environment: A meta-analysis. J. Am. Plann. Assoc. 2010, 76, 265–294. [CrossRef]
33. Vale, D.S. Transit-oriented development, integration of land use and transport, and pedestrian accessibility: Combining node-
place model with pedestrian shed ratio to evaluate and classify station areas in Lisbon. J. Transp. Geogr. 2015, 45, 70–80.
[CrossRef]
34. Berawi, M.A.; Saroji, G.; Iskandar, F.A.; Ibrahim, B.E.; Miraj, P.; Sari, M. Optimizing land use allocation of Transit-Oriented
Development (TOD) to generate maximum ridership. Sustainability 2020, 12, 3798. [CrossRef]
35. Oh, Y.T.; Kim, T.H.; Park, J.J.; Rho, J.H. An Empirical Analysis of Influencing Factors towards Public Transportation Demand
Considering Land Use Type Seoul Subway Station Area in Seoul. J. Korean Soc. Civ. Eng. 2009, 29, 467–472.
36. Lee, Y.S.; Choo, S.H.; Kang, J.M. Setting Spatial Ranges and Analysing Characteristics of the Adjacent Areas of Seoul Subway
Stations. J. Korea Plan. Assoc. 2011, 46, 57–72.
37. Lee, J.W.; Kim, H.Y.; Jun, C.M. Analysis of Physical Environmental Factors that Affect Pedestrian Volumes by Street Type. J. Urban
Des. Inst. Korea 2015, 16, 123–140.
38. Kang, J.; Shung, H. Temporal Reaction of House Price Based on the Distance from Subway Station since Its Operation: Focused
on 10-year Experience after Opening of the Daejeon Urban Transit Line. J. Korea Plan. Assoc. 2019, 54, 54–66. [CrossRef]
39. Lew, S.H.; Kang, J.M. A Study on the Influence Factors of Land Value by Urban Spatial Constitution. J. Korean Soc. Civ. Eng. 2012,
32, 61–69.
40. Kim, S.H.; Kim, T.H.; Im, H.N.; Choi, C.G. Pedestrian Volume and Built Environmental Factors on Sales of Convenience Stores,
Cosmetic Shops and Coffee Shops in Seoul. J. Korea Plan. Assoc. 2015, 50, 299–318. [CrossRef]You can also read