UAV Photogrammetry, Lidar or WebGL? A Comparison of Spatial Data Sources for Landscape Architecture
←
→
Page content transcription
If your browser does not render page correctly, please read the page content below
220                                                                                              Full Paper

UAV Photogrammetry, Lidar or WebGL?
A Comparison of Spatial Data Sources for
Landscape Architecture
Radim Klepárník1, Jozef Sedláček2
1
  The Department of Landscape Planning, Mendel University in Brno/Czech Republic ·
radim.kleparnik@mendelu.cz
2
  The Department of Landscape Planning, Mendel University in Brno/Czech Republic ·
jozef.sedlacek@mendelu.cz

Abstract: This article deals with a comparison of spatial data from different sources for the needs of
landscape architecture. These include data acquired from public providers, the government (geoportals)
and commercial map servers utilising WebGL (Mapy.cz, Google), and data obtained using UAV
(drone) photogrammetry. The motivation for this is that the development of UAVs has allowed us to
get new data very quickly and cheaply. However, in order to clearly justify the need for their use in
landscape architecture projects, we need to compare them to other commonly available and used data
sources. Emphasising the possibilities and appropriateness of using UAV data is important, but it is
equally important to know when other data sources are more appropriate.
Keywords: UAV photogrammetry, WebGL, spatial data

1      Introduction
This article deals with a comparison of publicly available spatial data with UAV (Un-
manned Aerial Vehicle) data obtained by the photogrammetry method. In the beginning, we
asked the following questions: What spatial data are available to us? How do they compare
to the data acquired from a UAV?
We currently use a variety of digital technologies that allow us to improve workflow in land-
scape architecture. One of them is UAVs – drones that offer us a variety of different options.
These options are often unexplored, and so there is an effort to look into them more deeply.
This gives us a literally new perspective, especially in relation to digital landscape modelling.
The basis for all landscape planning is spatial data. Spatial data from the perspective of this
article are those that capture real space in exact XYZ coordinates from which a surface (mesh)
can be generated and/or directly provided data in the form of a surface model. Such data
allow us to analyse the surface differently, to measure accurately and perhaps even to create
visualisations of the landscape. There are a number of possible ways to obtain spatial data.
We can divide the methods of acquiring these data into direct and indirect. The aim of this
article is not to describe and compare all known methods, just the most accessible and most
frequently used ones. The difference between these methods is shown in Table 1. Price data
provided in the table are relative and should be seen in the context of area size and level of
accuracy (the larger the area – the higher the price, the greater the accuracy – the higher the
price). All data are based on the conditions present in the Czech Republic. € represents very
cheap acquisitions, €€ and more represents higher prices.

Journal of Digital Landscape Architecture, 6-2021, pp. 220-229. © Wichmann Verlag, VDE VERLAG GMBH ·
Berlin · Offenbach. ISBN 978-3-87907-705-2, ISSN 2367-4253, e-ISSN 2511-624X, doi:10.14627/537705019.
This article is an open access article distributed under the terms and conditions of the Creative Commons
Attribution license (http://creativecommons.org/licenses/by-nd/4.0/).
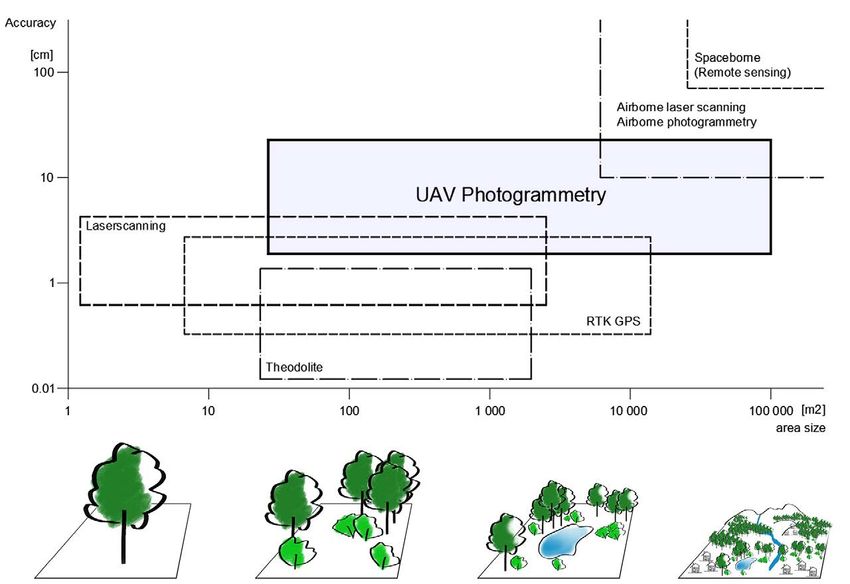
R. Klepárník, J. Sedláček: UAV Photogrammetry, Lidar or WebGL?                              221

Table 1: A table comparing direct and indirect data acquisition methods

Direct methods are those methods whose parameters we can directly influence. The form of
influence can either be that we directly choose when and how the data are acquired, or we
obtain such data by taking hand measurements. The conditions we can directly influence
include acquisition time (day, time of day, time of year), the level of precision of the tech-
nique or method used, prioritisation of capturing certain elements or properties more pre-
cisely, and others. Examples of these methods are theodolite, GPS RTK, laser scanning, and
UAV photogrammetry. Aerial laser scanning and aerial photogrammetry are at the frontier
of both direct and indirect data acquisition methods. Such data can often already be bought
pre-made for a specific territory, or we can have them processed – flown, but this solution is
very expensive. Indirect methods are those that do not allow us to directly define our require-
ments. We need to be satisfied with the quality and form of processing that the provider has
designated.

2     Spatial Data Acquisition
It should be said at the outset that we focused on the size of objects and on the scale of the
landscape. For the purposes of this article, this scale was set to range from hundreds of square
meters to the low tens of hectares. For objects within a few hundred meters, other methods,
such as precise GPS measurements, would more often be appropriate, and for the needs of
higher tens to hundreds of hectares, UAV use no longer makes any sense. This paper is fo-
cused on the use of 3D models, therefore the term spatial data is used for elevation (digital
surface and digital terrain models) and orthophotomaps.
The potential of UAV use and the current possibilities associated with it have been addressed
by a wide range of authors such as Rekittke (REKITTKE, NINSALAM & PAAR 2015), Girot (LIN
& GIROT 2014), Gerke (GERKE 2018), Siebert (SIEBERT 2014), Yazici (YAZICI 2018) and
many others. The authors of this article sampled dozens of sites across hundreds of images
in several examples, and so can compare these methods with various other methods, such as
geodetic measurements, laser scanning, and others. To evaluate the potential, we used and
modified a chart published by Eisenbeiß (EISENBEIß 2009).
222                                           Journal of Digital Landscape Architecture · 6-2021

Fig. 1: The potential to use UAV in terms of precision and scale of object solutions. Mod-
        ified and updated after Eisenbeiß (EISENBEIß 2009)

2.1   The Potential Use of UAV Photogrammetry as a Direct Method
UAV photogrammetry as a method for accurately capturing space is well established in the
field of landscape architecture (CURETON 2016, KULLMANN 2018). This method consists of
an automated viewing of the area under consideration along a pre-defined route at a specific
height and by providing an overlay of individual images. We can use both classic RGB cam-
eras and various special cameras such as multispectral and thermal cameras. Subsequently,
such images are processed by specialised photogrammetry software using the structure ob-
tained from motion (SFM) and multi-view stereo methods. Although all current UAVs write
GPS coordinates onto each individual image, this information is not accurate enough for pre-
cise processing and subsequent use for taking accurate measurements or making designs.
Either ground control points (GCPs), or precisely targeted points identifiable in images taken
by GPS RTK (real-time kinematic positioning), or if the drone itself already possesses GPS
RTK, need to be used for those activities that require precision.
The UAV photogrammetry method has a number of advantages, such as the timeliness of the
data (both the imaging and processing are very fast), the easy repeatability of the imaging,
its relative cheapness, high degree of accuracy (about 5 cm vertically and approximately 5-
10 cm horizontally) and the primary data source itself – the point cloud is composed of tens
of millions of points (depending on the technique and settings chosen). We can thus obtain
good evidence useable for various design processes (concept, design, studies, project, presen-
tation). One of the main drawbacks, or rather characteristics of the method, is that only the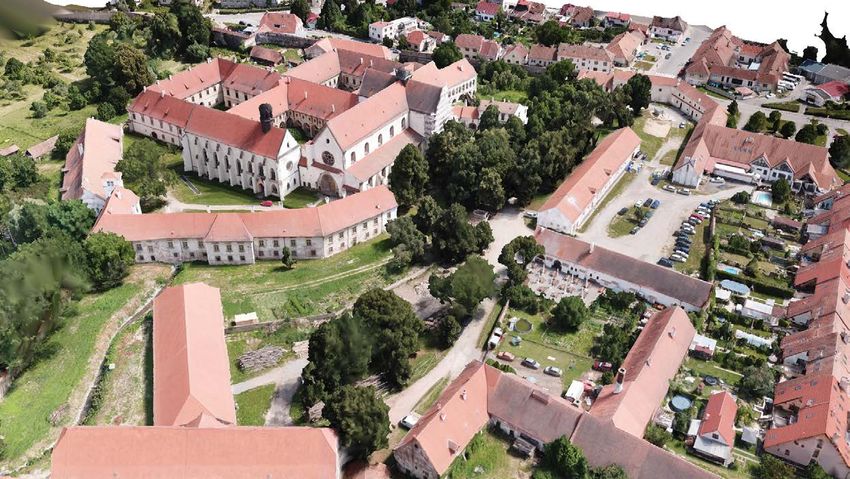
R. Klepárník, J. Sedláček: UAV Photogrammetry, Lidar or WebGL?                               223

surface is captured in the images. It is therefore not possible, for example, to capture under-
growth, other objects under trees, an individual tree within a group, the terrain when vegeta-
tion overlaps, etc. Other disadvantages are their limited or problematic use in certain loca-
tions such as in cities or legislatively protected natural areas. There are also limits in the
processing of vegetation (great simplification of complex structures) and this method uses
sophisticated techniques that quickly become obsolete (drones, cameras, batteries).

2.2   Data from Public Providers or the Government
The first source used for making a data comparison with UAV data is that obtained from
public providers. In Europe, there are a variety of local services, both public and private, that
provide such data, but whether they are available, at what level of accuracy and under what
conditions (free or paid) varies from one country to another. This article primarily addresses
the situation in the Czech Republic. In respect of elevation data, the most prevalent method
used for obtaining such spatial data is aerial imaging using Lidar. The resulting data types
are a digital terrain model (DTM) and digital surface model (DSM). The accuracy is deter-
mined both by the parameters of the method chosen and by the resolution provided (points
per 1m2). Standard accuracy is from 10-30 cm or more depending on land cover at a resolu-
tion 2 × 2 meters to one point. These data are most often aggregated into Geoportals that
allow us to view these data online. We can often work with these using GIS via connecting
WMS (Web Map Service) services in preview quality, or buying them in full quality. One
great advantage is that they are often available in preview quality for free, and even this
allows for making complex analyses in GIS. Another advantage is their coverage across the
entire landscape. Drawbacks include the fact that they are updated only every few years, they
have no surface texture and their level of accuracy is too low for some needs such as visual-
isations.

2.3   Data from Web GL
The second potential public resource is from publicly available map portals that provide a
3D view. Examples of such a resource include Google 3D Maps, Google Earth, Mapy.cz and
Apple’s 3D Maps. These data can be viewed using the WebGL, JavaScript API for rendering
interactive 2D and 3D graphics within any compatible web browser without the need to use
any plug-ins.
Their acquisition and further use is possible thanks to this type of web view. For the purposes
of this article, we used a process created by Élie Michel and available via github (ÉLIE 2020).
The process consists of creating a screen shot using RenderDoc and then importing it into
Blender, where we can directly work with it or export it for use in other 3D programs such
as Sketchup, 3DS Max, Rhino and others. To be able to import into Blender, Elie Michel has
created the MapsModelsImporter plugin (ÉLIE 2020), which transforms data captured as print
screens using RenderDoc. The main drawback of these data sources is that they are not
georeferenced and need to be manually georeferenced. So the level of accuracy is always
lower. Another drawback is that these data are currently available primarily for large cities,
and their updates, like DTM/DSM, occur only every few years. Their greatest advantage is
their very high level of quality and easy accessibility (compliance with the licensing condi-
tions of each provider).
224 Journal of Digital Landscape Architecture · 6-2021
3 Methods for Making Comparisons of Spatial Data Sources
As general criteria for making comparisons, we chose their suitability for each design phase
(concept, design, studies, project and presentation), their free availability, and above all, their
level of accuracy. As mentioned earlier, the article looks at the size of objects on a landscape
scale that is hundreds of square meters to the low tens of hectares. Planning and designing
projects on this scale generally does not require very high spatial data accuracy for the whole
territory. The requisite level of precision is very different depending on the type of project
and intent (adjusting the surfaces x creating new structures), but in general it can be said that
the requested level of precision will be in units of 10-20 cm so that we can work with these
data appropriately. The level of accuracy itself is determined by the measurement error and
by the number of points per square metre.
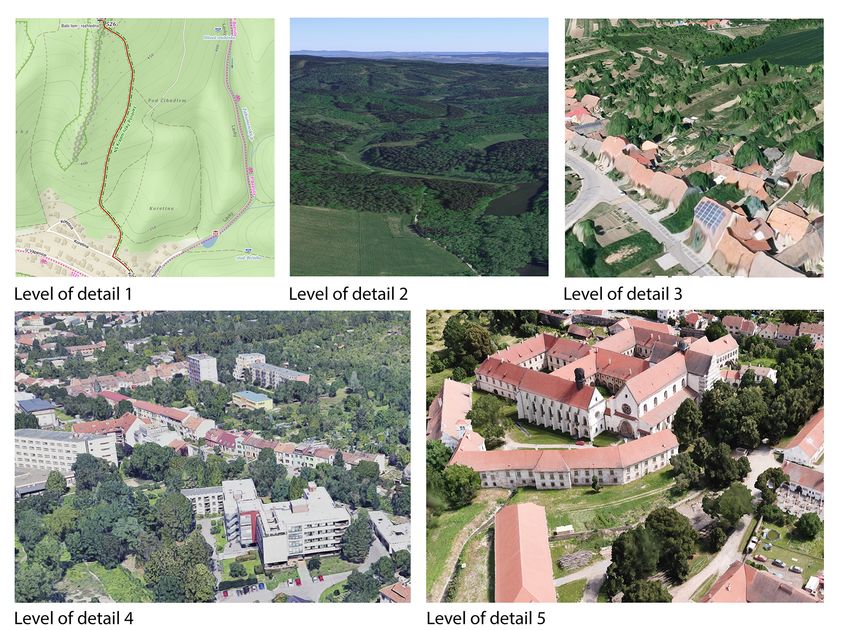
Fig. 2: Examples of models according to LOD 1-5
LOD 1: 2D data only, spatial data only as contour and shadow terrain
LOD 2: Basic 3D view – An orthophotomap on the surface from contour lines
LOD 3: DSM covered by an orthophotomap (Low detail, problematic vegetation
display)
LOD 4: Processed by photogrammetry, high level of detail, low geometric
precision
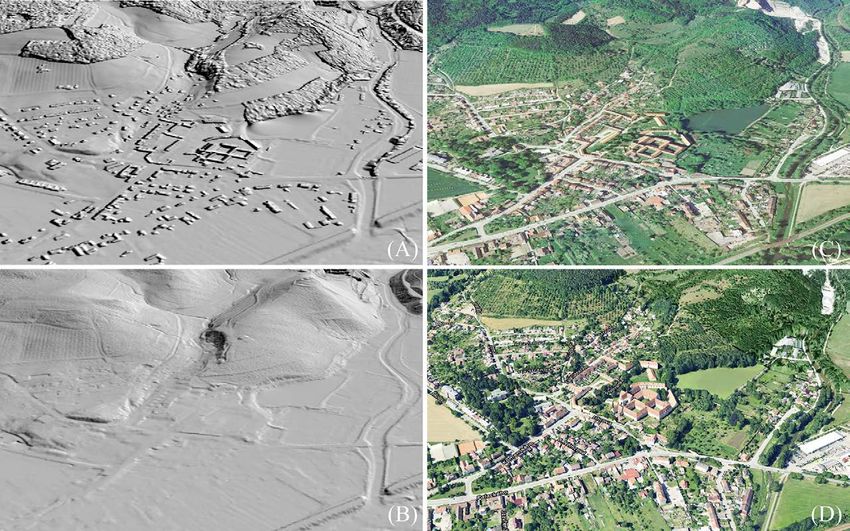
LOD 5: Very precise and a high level detail, comparable to photographyR. Klepárník, J. Sedláček: UAV Photogrammetry, Lidar or WebGL? 225 This determination of accuracy (deviation and resolution) is not appropriate when assessing WebGL data, where the accuracy itself is determined by the georeferencing method and will therefore always be very small relative to other types of data. However, these data are often very valuable for their “appeal” because they often contain very good texture. Similarly, data obtained by Lidar (DMT, DSM) can be very accurate, but if they do not contain texture, for example, they are unsuitable for visualisation. As a result, to make a comprehensive comparison we chose a modified method – level of detail (LOD) according to CityGML. This method was published by the Karlsruhe Institute of Technology (KIT) and can be considered the standard (VO 2019, AGUGIARO 2015). We adapted this method for our needs primarily from the perspective of “appeal” precision and type of data. 4 Case Study The selection of the area was based on criteria such as the significance of the object from the perspective of landscape architecture, the fact that it contains different types of compositional elements (structures, trees, shrubs, roads, etc.), there are data available for making a compar- ison and the object has not been renovated, so its current state needs to be captured well. Porta Coeli Convent The selected area is located in the city of Předkláštěří, approximately 25 km from the city of Brno, in the Southern Moravian Region in the Czech Republic. It is a historic monastic com- pound that was established in the 13th century. The current state of public spaces is not good and they need to be revitalised. For this purpose, it was necessary to prepare a study that incorporated the requirements of various institutions and users of the area (monument pro- tection, the Cistercian Order, the forest administration, a museum and a brewery). As a result, to process the study, it was necessary to have basic spatial data of the current state. Due to the size of the area, a solution was sought that could be more efficient and cheaper than a detailed classical geodetic survey. The question was asked whether or not it was possible to use commonly available spatial data from public providers if it was necessary to use the acquisition of spatial data using UAVs. A capture using UAV photogrammetry was primarily to examine the use of such data for the design stage Design-study and presentation using visualisations. Data Acquisition From freely available data, we used data obtained from the Czech Geodetic and Cadastral Office (CUZK [online]). They provide a variety of mapping materials such as a digital ca- dastre, digital and raster maps, orthophotomaps, archival imagery and, for our purposes, pri- marily DSM referred to as DMP 1G (Fig. 3 part A) and DTM referred to as DMR 5G (Fig. 3 part B). For DMP 1G, the reported data deviation is 0.4-0.6 m for DMR 5G, and the reported data deviation is 0.18-0.3 m. The available resolution via WMS in ArcGIS is 5 x 5 meters to one point, and after purchasing full quality (10 euros for a 2.5x2 km map sheet), this resolu- tion is 3-5 points per meter. The quality of this data from the LOD point of view is LOD 3 for DMP 1G and LOD 2 DMR 5G (if we texturise them using an orthophotomap).
226                                              Journal of Digital Landscape Architecture · 6-2021

The second source of data used for making a comparison was data from WebGL. For this
area, they are available from the map portals Google Maps (Fig. 3 part C) and Mapy.cz (Fig.
3 part D), but only the data from Mapy.cz have good quality LOD 4. Google only has a
quality LOD 2. For the obtained data, we used the Élie Michel (ÉLIE 2020) method mentioned
above. For georeferencing, we used data obtained from DSM DMP 1G.

Fig. 3: (A) Digital surface model DMP 1G – LOD 3 maps, (B) digital terrain model DMR
        5G – LOD 2 maps, (C) Google Maps 3D view, (D) Mapy.cz 3D view

To obtain data from a UAV, we used a DJI Matrice 210 with an X4S camera. In general, if
you want to fly in this type of territory, a license to fly is required (it is a “specific” category
according to EU rules), and you need to have a permit from the facility administrator to op-
erate the flight. The Pix4D capture planning application was used for the flight planning,
which enables users to precisely set flight parameters for automated flying. Flight altitudes
of 60 and 80 meters was chosen. The camera angle was chosen to be 70 °, and the overlap of
individual images was 80% forward and 70% sideways. The flight was planned in a double
grid. Ground control points were targeted using GPS Trimble Catalyst D1. The acquired im-
ages were processed using Reality Capture. One great advantage of this program, in addition
to having good calculation results, is the good possibilities it offers for editing the data ob-
tained in this way. For example, you can delete trees, smoothen areas, reduce the number of
polygons, and then have them re-textured again. The output we get is relatively good quality,
but not a large mesh with very good texture. Of course, we can also work with an original
point cloud, such as choosing individual points, generating contour lines and otherwise ana-
lysing and measuring them. Furthermore, we can also export this data to AutoCad, GIS,
Sketchup and other commonly used design software.
R. Klepárník, J. Sedláček: UAV Photogrammetry, Lidar or WebGL? 227 Fig. 4: Mesh created with Reality Capture 5 Results In our case study, Porta Coeli Convent, we verified what data are freely accessible and also acquired data from a drone using DJI Matrice 210. Further work with the data after their acquisition consisted in modifying the data with Auto- Cad, on the basis of which a proposal was prepared. For this purpose, a combination of data from the digital cadastre, a contour generated from DSM – DMP 1G and orthophotomaps obtained by UAV photogrammetry was used. The contour lines generated from the UAV point cloud are much more accurate, but they do not cover the terrain under the trees, which is unsuitable for design purposes. After removing the vegetation, we get DTM, but it is very inaccurate compared to DMP 1G. The orthophotomap obtained from the UAV was used to redraw the edges of surfaces, draw the positions of trees and specify the boundaries of build- ings (more accurate than the digital cadastre). Based on the data acquired in this way, a design was prepared and was transferred to a 3D model. A modified mesh model from the UAV was used as the basis of the model. This model was first modified and simplified in Reality Capture and then the design in Sketchup was modelled into it. By comparison, the WebGL model had very few polygons and a much worse surface texture. However, for some purposes, such as having a simple concept or a basic bird's-eye view, this method would be sufficient. In general, we can say that for the chosen location there is a variety of data available such as the digital cadastre, DMT, DSM, Google 3D Maps, and the Mapy.cz 3D view. But because the data had to be much more accurate for the chosen purpose, UAV photogrammetry proved to be the appropriate solution. An overall comparison of the publicly available data with the data captured by the UAV is shown in Table 2. This table shows that other data are suitable or sufficient for different uses. It can therefore be concluded that for some uses where it is not necessary to have accurate background, we have a plethora of other sources available. However, for obtaining a more accurate background, a method using UAV photogrammetry may be appropriate.
228                                             Journal of Digital Landscape Architecture · 6-2021

Fig. 5: (A) A cleaned 3D model before adding the design, (B) a 3D model with added sur-
        faces, vegetation and outdoor furniture, (C) the final 3D model with texture

Table 2: A comparison of spatial data sources according to given criteria
         *   The accuracy depends on the georeferencing method
         ** According to the resolution provided by the map server
         *** The usual accuracy is hundreds to thousands of points depending on the se-
             lected processing method, shooting distance and resolution of the camera used
         Ø   symbols represent the usability scale, where Ø represents poor, ØØ represents
             okay, and ØØØ represents good

6        Discussion
To conclude, it may be problematic to transfer the results and workflow we used to another
model territory, and more importantly, to another country. In the country where this study
was performed, there is generally a large amount of available data and mapping material of
a sufficient quality. As for the WebGL method itself, it is particularly suitable for use in large
cities, which are mainly available on Google with a good level of quality, and it can be ex-
pected that this trend will continue to expand as individual methods improve. One advantage
R. Klepárník, J. Sedláček: UAV Photogrammetry, Lidar or WebGL? 229 of the country in which this study was performed, Czech Republic, is that it is completely covered by a 3D view in Mapy.cz in LOD 3-4, so it is often possible to choose a better quality map table. Regarding the use of UAV photogrammetry, this method can be problematic in many countries depending on the local legislative rules. Another problem associated with the use of UAVs in populated and built-up areas is the potential for high hazards. This should also be kept in mind when choosing a suitable method for obtaining spatial data. Acknowledgements This paper was funded by IGA – ZF/2020 – DP011 Potential of using UAV by research of landscape architecture monuments and by project CZ.02.1.01/0.0/0.0/16_017/0002334 Re- search Infrastructure for Young Scientists; this is co-financed from the Operational Pro- gramme Research, Development and Education. References AGUGIARO, G., HAUER, S. & NADLER, F. (2015), Coupling of CityGML-based semantic city Models with energy simulation tools: some experiences. EISENBEIß, H. (2009), UAV photogrammetry. ÉLIE, M. (2020), MapsModelsImporter. Github [online]. https://github.com/eliemichel/MapsModelsImporter (10.11.2020). CURETON, P. (2016), Strategies for Landscape Representation: digital and analogue tech- niques. Routledge, London. CUZK (2020), https://www.cuzk.cz/ (07.03.2021). KULLMANN. K. (2018), The drone’s eye: applications and implications for landscape archi- tecture. Landscape Research, 43 (7), 906-921. doi:10.1080/01426397.2017.1386777. LIN, E. & GIROT, C. (2014), Point Cloud Components Tools for the Representation of Large Scale Landscape Architectural Projects. In: BUHMANN, E. et al. (Eds), Peer reviewed pro- ceedings of Digital Landscape Architecture 2014 at ETH Zurich. Wichmann, Berlin/Of- fenbach, 208-218. GERKE, M. (2018), Developments in UAV-Photogrammetry. Journal of Digital Landscape Architecture, 3-2018. 262-272. doi:10.14627/537642028. REKITTKE, J., NINSALAM, Y., PAAR, P. (2015), Using Massive Field Data for Large-size De- sign Action. In: BUHMANN, E. et al. (Eds), Peer reviewed proceedings of Digital Land- scape Architecture 2015 at Anhalt University of Applied Sciences. Wichmann, Berlin/Of- fenbach, 318-327. SIEBERT, S. & TEIZER, J. (2014), Mobile 3D mapping for surveying earthwork projects using an Unmanned Aerial Vehicle (UAV) system. Automation in Construction, 41, 1-14. doi:10.1016/j.autcon.2014.01.004. VO, T. T., NICHERSU, A. & WENDEL, J. (2019), Modeling, Monitoring, and Validating Green Roof and Green Facade Solutions with Semantic City Models Using Low Cost Sensors and Open Software Infrastructures. Urban Science, 3 (2), 39. doi:10.3390/urbansci3020039. YAZICI, K., ÖNAÉ, A. K. & Aslan, B. G. (2018), The Importance of UAV (Drone) Usage According to Landscape Architecture. Imascon, 1428-1438.
You can also read