Upper North West Regional Economic Development Strategy - 2023 Update - Department of Regional NSW
←
→
Page content transcription
If your browser does not render page correctly, please read the page content below
Department of Regional NSW

Upper North West Regional Economic Development Strategy
– 2023 Update

regional.nsw.gov.au
Upper North West Regional Economic Development Strategy – 2023 Update 2
Published by the Department of Regional NSW
Title: Upper North West Regional Economic Development Strategy - 2023 Update

First published: February 2023

Acknowledgements
The Department of Regional NSW would like to acknowledge the significant contribution of many stakeholders in the Upper
North West region to the development of the 2023 REDS Update, with particular thanks to staff from Gwydir, Inverell, Moree
Plains and Narrabri Councils. The Department of Regional NSW also acknowledges the assistance provided by
PricewaterhouseCoopers and ProjectsJSA to help deliver the 2023 REDS Update project.

On Country – Artwork by Mumbulla Creative
"On Country" captures the many different countries located within the Department of Regional NSW footprint. Only part of the
image is shown on the Acknowledgement of Country page. The regions included in this partial image are detailed below.

The Far West region of NSW is represented by red earth plains, mallee scrubs and an abundant emu population. Freshwater
countries are referenced by the expansive network of rivers stretching through the regions. The Riverina Murray region is
represented by the roots of a river redgum on the banks of a river, and a large Murray Cod can be seen in the river. The night sky
features as it plays an important navigational and story-telling role in traditional life.

Cover image: Kaputar Ranges. Photo credit: Narrabri Shire Council

© State of New South Wales through the Department of Regional NSW 2023. You may copy, distribute, display, download and otherwise freely
deal with this publication for any purpose, provided that you attribute the Department of Regional NSW as the owner. However, you must obtain
permission if you wish to charge others for access to the publication (other than at cost); include the publication in advertising or a product for
sale; modify the publication; or republish the publication on a website. You may freely link to the publication on a departmental website.

Disclaimer: The information contained in this publication is based on knowledge and understanding at the time of writing (February 2023) and
may not be accurate, current or complete. The State of New South Wales (including the Department of Regional NSW), the author and the
publisher take no responsibility, and will accept no liability, for the accuracy, currency, reliability or correctness of any information included in
the document (including material provided by third parties). Readers should make their own enquiries and rely on their own advice when making
decisions related to material contained in this publication.

Upper North West Regional Economic Development Strategy – 2023 Update                                                                                   3
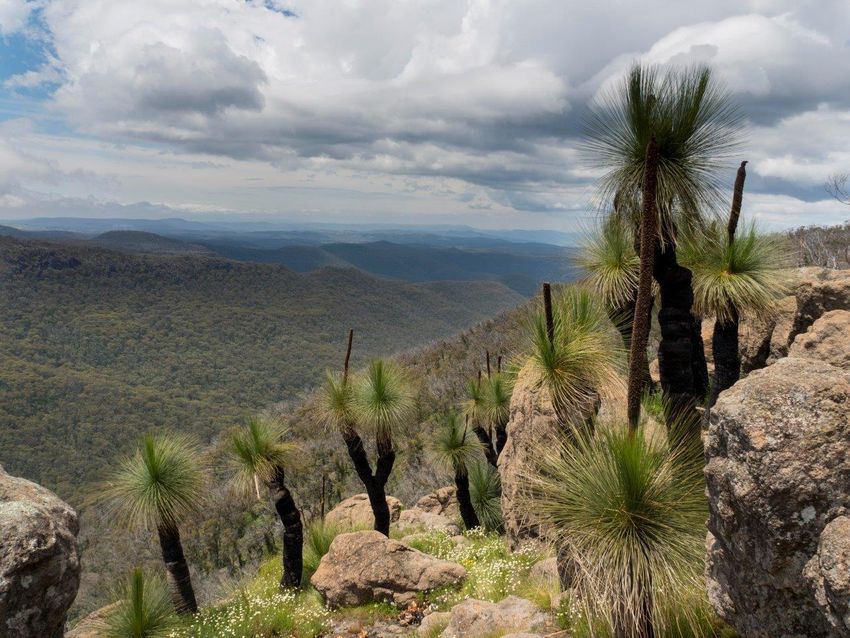
Table of contents
Table of contents.............................................................................................................................................................................................. 4
1.        Executive summary.................................................................................................................................................................................5
     Changes in the Upper North West region since 2018 ..................................................................................................................................................... 5
     Key themes from local consultation ...................................................................................................................................................................................... 6
     Upper North West REDS – 2023 Update strategies and enablers ............................................................................................................................ 7
2.        About the 2023 REDS Update............................................................................................................................................................... 8
3.        About the Upper North West region ..................................................................................................................................................... 9
4.        The 2018 Upper North West REDS and 2020 Bushfire Addendum................................................................................................ 10
5.        The big picture: Shocks and trends impacting the Upper North West region since 2018.......................................................... 12
     Significant events impacting major industries.................................................................................................................................................................12
     Macroeconomic trends shaping the region’s future ..................................................................................................................................................... 14
6.        Responding to change: Initiatives and investments since 2018 .................................................................................................... 16
     Significant investments since 2018 ......................................................................................................................................................................................17
7.        Upper North West 2023 economic snapshot ....................................................................................................................................20
     Demographics. ..............................................................................................................................................................................................................................20
     Housing.............................................................................................................................................................................................................................................21
     Employment ...................................................................................................................................................................................................................................22
     Upper North West region 2023 engine and emerging industries ............................................................................................................................24
     Upper North West region 2023 endowments ..................................................................................................................................................................26
8.        Looking ahead: Strategic opportunities for growth, resilience and liveability ...........................................................................27
     Opportunities and vulnerabilities in engine and emerging industries ...................................................................................................................27
     Key themes in stakeholder consultation............................................................................................................................................................................ 31
     Upper North West REDS – 2023 update strategies ...................................................................................................................................................... 31
     Key enablers of economic growth ........................................................................................................................................................................................32
9.        References............................................................................................................................................................................................. 34

Upper North West Regional Economic Development Strategy – 2023 Update                                                                                                                                                                                   4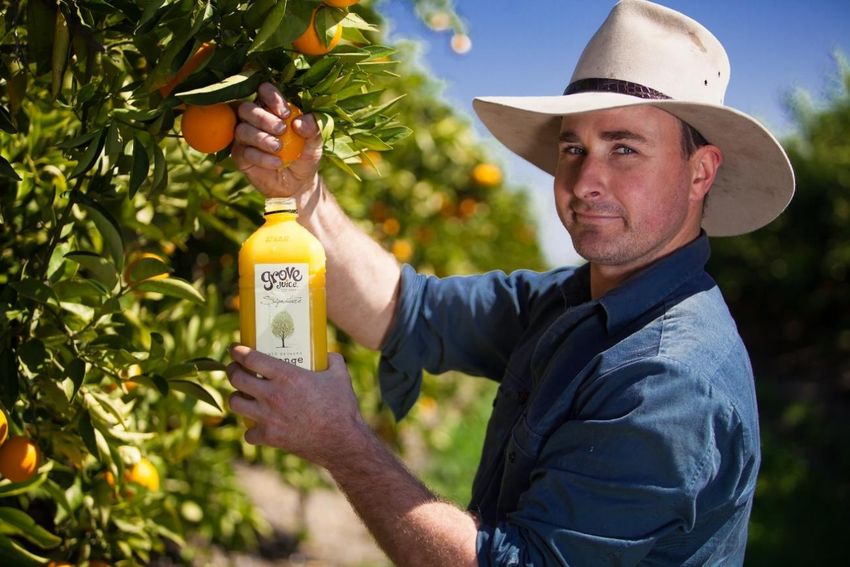
1. Executive summary
Changes in the Upper North West region since 2018
In 2018, the NSW Government developed Regional Economic Development Strategies (REDS) for 38
Functional Economic Regions (FERs) across regional NSW. Since publication, regional NSW has endured
shocks including bushfires, floods, COVID-19 and the mouse plague, and significant new economic
opportunities have emerged. The 2023 REDS Update provides an updated evidence base to guide
governments in making policy and investment decisions to enhance resilience and drive sustainable,
long-term economic growth in regional NSW.

The Upper North West region has seen significant investment delivered since 2018,
with additional projects in the planning or delivery stages

              $194 million initial investment in the Moree Special Activation Precinct and ongoing
              master planning underway for the Narrabri Special Activation Precinct.

              More than $1 billion committed to deliver a number of major renewable energy projects.

              Investment of $140 million to deliver upgrades to Moree and Inverell hospitals.

              Major transport infrastructure upgrades across the region worth over $350 million

The Upper North West region has experienced increasing job vacancies and reductions
in housing vacancy rates since the COVID-19 pandemic

              -2.1% population growth since 2018.

              Housing vacancy rates sit around 1%, with median house prices having risen by an
              average of 25% since 2018.

              The proportion of the population over 55 years old has increased by 1.1 % since 2018.

              Unemployment rates across the region vary between 5.4% and 8.5%, while job vacancies
              reached a record 1,456 in August 2022.

Upper North West Regional Economic Development Strategy – 2023 Update                                  5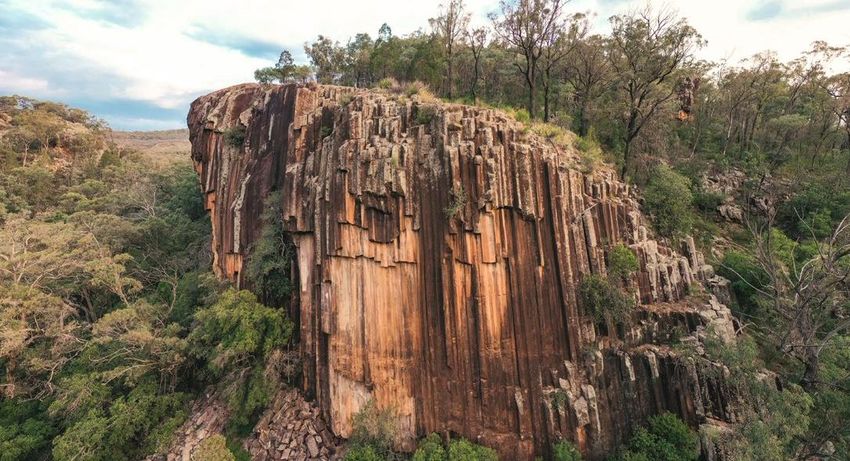
The Upper North West region’s key industries (agriculture, mining and manufacturing)
have remained resilient, while electricity supply is an emerging industry.

                 Agriculture

 + 5.4 % year on year (YoY) growth            $ 591 million gross value
                                                                            3,938 jobs supported in 2021
 from 2011-2020                               added (GVA) in 2020

                 Mining

 + 18.4 % YoY growth from 2011-2020           $ 1,284 million GVA in 2020   545 jobs supported in 2021

                 Manufacturing

 + 0.6 % YoY growth from 2011-2020            $ 182 million GVA in 2020     1,069 jobs supported in 2021

                 Electricity supply (including renewables)

 + 3.2 % YoY growth from 2011-2020            $ 102 million GVA in 2020     225 jobs supported in 2021

Key themes from local consultation
Stakeholders from the Upper North West region have highlighted housing availability, building
resilience and maximising benefits from major projects as key priorities for the region.

 Housing availability and affordability

              The region faces current housing availability shortages and reduced housing affordability,
              presenting challenges to population growth.

 Taking a long-term view on major projects

              A keen desire was expressed around focusing on delivering long-term benefits from major
              investments, so to ensure projects do not lead to a ‘boom-bust’ sequence of events.

 Building resilience

              Recent shocks have highlighted the importance of incorporating principles of resilience
              into planning for population growth.

Upper North West Regional Economic Development Strategy – 2023 Update                                      6
Upper North West REDS – 2023 Update strategies and enablers

  Strategies                                Enablers

  Improve freight efficiency of            •   Develop a regional transport plan to ensure agriculture and
  engine industries of agriculture             mining freight distribution routes have optimised access to
  and mining.                                  inland rail.

  Encourage and deliver                    •   Facilitate uptake of technology in agriculture and
  investments, increased                       manufacturing to improve efficiency and output, including
  productivity and value-adding                advanced manufacturing and robotics in food processing.
  activities within the region.

  Invest in people, skills,                •   Align with current work underway by undertaking demand
  community and lifestyle to                   studies for future regional housing supply needs which
  address the region's skills gap.             account for the impacts of major projects and include
                                               scenario planning across relevant potential growth
                                               trajectories.

                                           •   Invest in liveability and amenities to attract relocating
                                               workers and families, including local retail and commercial
                                               offerings, recreational facilities, tourism infrastructure and
                                               transport connectivity.

  Diversify the economy through            •   Support research and feasibility studies, including in
  emerging sectors including                   collaboration with Aboriginal land holders, to identify areas
  renewable energy.                            of the region which can support additional or expanded
                                               renewable energy generation and storage projects.

                                           •   Enhance the economic resilience of the agricultural industry
                                               by encouraging diversification, use of alternate sources of
                                               water and industry climate adaptation, as outlined in the
                                               Gwydir and Namoi Regional Water Strategies.

                                           •   Support a diverse visitor economy by developing nature
                                               tourism opportunities and infrastructure through private,
                                               commercial and government partnerships.

Upper North West Regional Economic Development Strategy – 2023 Update                                           7
2. About the 2023 REDS Update

In 2018, the NSW Government and local councils developed
a series of REDS for 38 Functional Economic Regions
(FERs) across regional NSW. FERs are made up of one or
more Local Government Areas (LGAs) that work together to
create smaller economies with strong economic links.
Supporting the 20-Year Economic Vision for Regional NSW,
the REDS set out a place-based vision and framework for
economic development for each FER. The REDS identify
each FER's endowments, industry specialisations and key
vulnerabilities and opportunities, and outline economic
development strategies and actions to leverage these
strengths.
Since 2018, regional NSW has endured many challenges
including drought, bushfires, floods, COVID-19 and the
mouse plague. At the same time a range of broader
state-wide trends and actions continue to change the
economic landscape across regional NSW, including digital
transformation, increased remote working and the shift
towards net zero. These challenges and trends have altered
the landscape of economic development in many regions
                                                                        Figure 1: Kwiambal National Park, Macintyre River.
and created new opportunities for growth.                               Photo credit: David Waugh.

The 2023 REDS Update provides an updated evidence base
to guide governments in making policy and investment
decisions to enhance resilience and drive sustainable, long-
term economic growth in regional NSW. The objectives of
the update are to:
1.   Highlight progress: reflect on significant initiatives and
     investments that have supported progress against the
     key strategies and actions in the 2018 REDS.

2. Capture major changes: identify and assess the impacts
   of major changes to regional economies since 2018,
   including the effect of recent ‘shocks’ such as bushfires/
   droughts, floods, mouse plagues and the COVID-19
   pandemic.

3. Identify strategic opportunities: identify key strategic
   opportunities and vulnerabilities for engine and
   emerging industries, as well as any changes to local
   endowments.

4. Set the foundation for the future: review, affirm and/or
   adjust the 2018 strategies, including consideration of               Figure 2: CSIRO telescopes in Narrabri LGA. Photo
   new strategies to meet emerging priorities, to ensure                credit: Narrabri Shire Council.
   they remain relevant.

5. Identify key enablers to guide future action: develop a non-exhaustive list of priority enabling
   actions that will support the 2023 REDS Update strategies.

Upper North West Regional Economic Development Strategy – 2023 Update                                                        8
3. About the Upper North West region
The Upper North West region is located in northern NSW and forms the north-western corner of the
New England North West region. The region covers an area of 48,778 square kilometres and spans the
Namoi, Gwydir and Border River catchments, which are part of the broader Murray Darling Basin. The
region includes the Local Government Areas (LGAs) of Moree Plains, Inverell, Gwydir and Narrabri.

  Total area covered (km2)                                          48,778

  Population (2021)                                                 48,600

       Gwydir                                                       4,911

       Inverell                                                     17,919

       Moree Plains                                                 12,961

       Narrabri                                                     12,809

  Size of the economy (2020)                                        $4.042 billion

  Total employment (2021)                                           19,642

 Source: ABS (2021) Estimated Resident Population, REMPLAN (2020), ABS Census (2021)

Figure 3: Map of the Upper North West Functional Economic Region.

Upper North West Regional Economic Development Strategy – 2023 Update                                9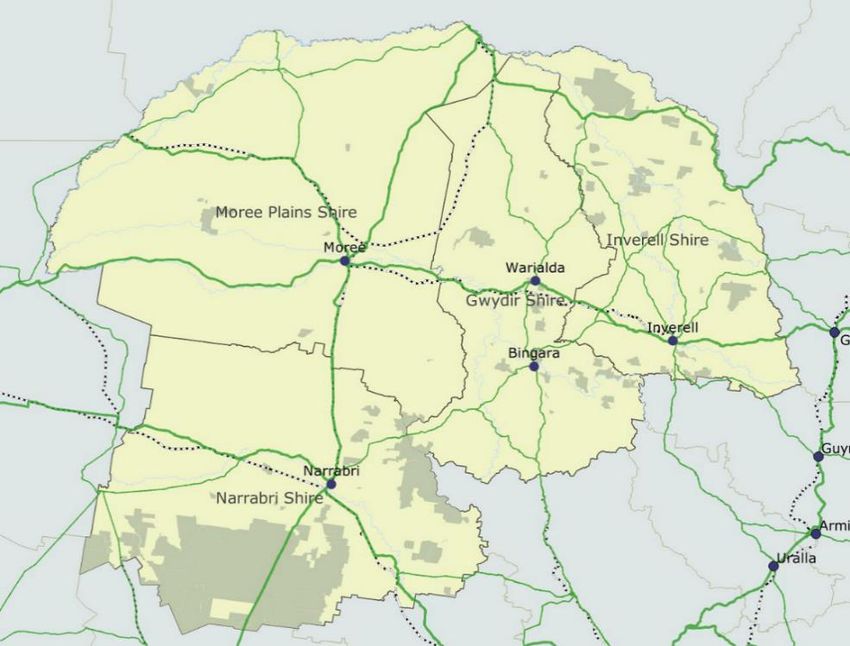
4. The 2018 Upper North West REDS and 2020 Bushfire
   Addendum
In the 2018 REDS, the region was actively pursuing growth of its key industry specialisations,
particularly agriculture and mining. Endowments recognised in the document spanned natural, social
and infrastructure assets, many of which were central to the strategy’s approach to enabling economic
development for the region. These endowments and specialisations are highlighted below.
Following the 2019-2020 bushfires, the NSW Government developed the 2020 Upper North West
Bushfire Impact Addendum, which offered additional areas of strategic focus to support resilience.

2018 Upper North West strategies

           Improve freight efficiency of engine industries of agriculture and mining.

           Encourage investment, increased productivity and value-adding.

           Invest in people, skills, community and lifestyle to address the region's skills gap.

           Diversify the economy through emerging sectors.

           The 2020 Upper North West Bushfire Impact Addendum outlined a series of additional
           short, medium and long-term priorities focused primarily on enhancing economic and
           community resilience, including by pursuing growth and diversification in the region.

2018 Upper North West specialisations
The industry specialisations below were identified as comparative advantages for the Upper North West
region in the 2018 REDS, based on employment concentrations in industry sectors.

             Agriculture, forestry, and fishing

             Manufacturing

             Mining

Upper North West Regional Economic Development Strategy – 2023 Update                                   10
2018 Upper North West endowments
The Upper North West is home to a wealth of physical, institutional, built and human endowments.
These endowments play a key role in enabling success and growth across its 2018 industry
specialisations of agriculture, mining, and manufacturing.
Relative 2018
Endowment
specialisation
Highly productive agricultural land and know-how
Access to water
Location and transport access
Mineral and gas resources
Renewable energy resources
Quality cultural, natural, and tourism assets and experiences
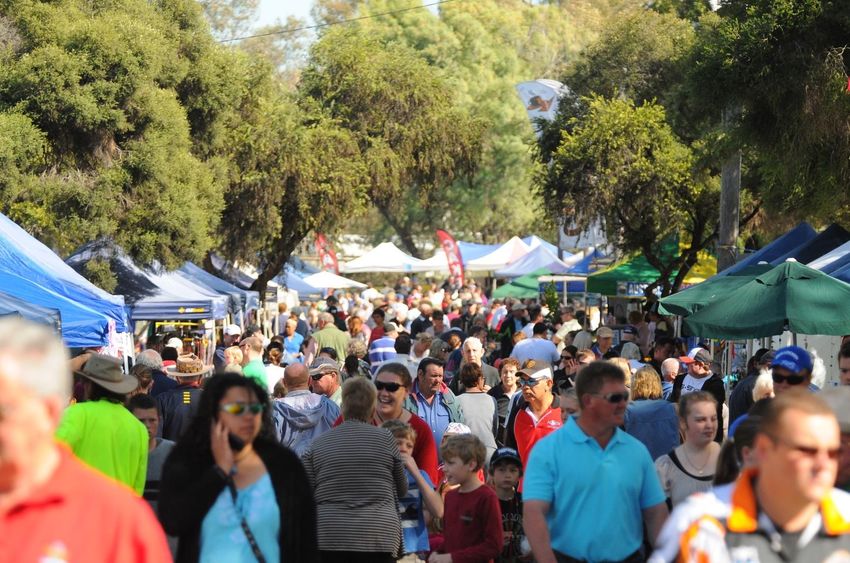
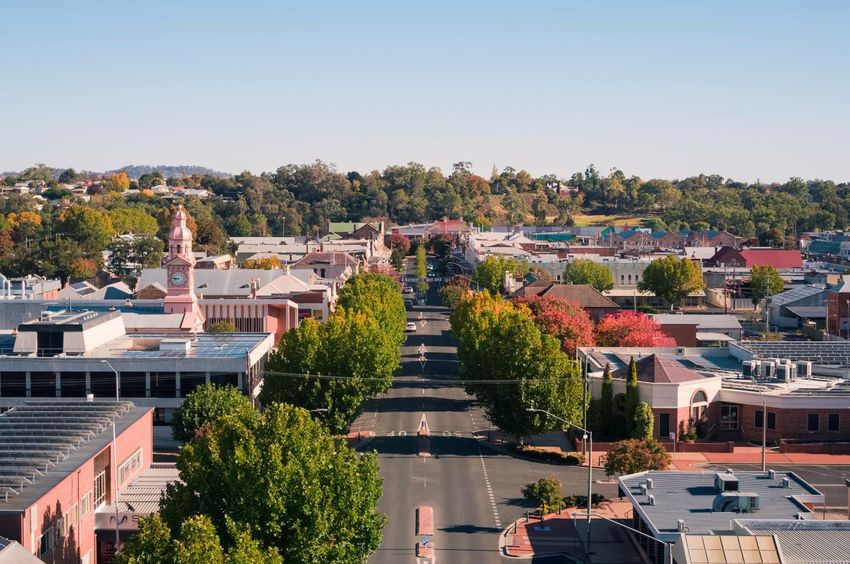
Figure 4: The town of Inverell. Photo credit: Destination NSW.
Upper North West Regional Economic Development Strategy – 2023 Update 115. The big picture: Shocks and trends impacting the Upper
North West region since 2018
Figure 5: Sawn Rocks in Narrabri LGA. Photo credit: Andrew Pearson.
Significant events impacting major industries
A sustained period of drought, followed by major bushfires and flooding had severe environmental and
economic implications for the region. The COVID-19 pandemic further challenged the region, with local
businesses suffering, particularly those in the visitor economy, who felt the impacts of movement and
operating restrictions. From the period 2018 to 2022, the region had nine disaster declarations[1] and
received $20.17m in disaster recovery grants.[2] Recovering from these events and developing both
industry and community resilience has been a priority for the region since 2018.
Drought
During the 2017-20 drought, the Upper North
West’s main catchment/ the Copeton Dam, had its
worst 24-month period on historical record.[3] By
May 2019, severe drought saw the Copeton Dam at
just 10% capacity, meaning the Gwydir region
entered Stage 3 – severe drought water
restrictions.
The drought had a significant impact on the
agricultural sector, with native fish needing to
relocate to survive, fish deaths downstream of
Moree, and restrictions on commercial pumping
introduced in 2020.[3] This affected the broader
Figure 6: Combined drought indicator, 12 months to 31
economy given the agricultural specialisation of December 2019 (Department of Primary Industries (DPI), 2022).
the Upper North West region, translating to a
spike in unemployment in 2018-19 (see page 22).
Upper North West Regional Economic Development Strategy – 2023 Update 12Bushfires
The 2019-20 bushfires also impacted parts of the
Upper North West region, as shown in Figure 7. Key
impacts included: [4]
• 474 square kilometres burnt with
four properties damaged or destroyed.
• Impacts on the agricultural sector with damage
to key assets including fencing, sheds,
machinery and infrastructure,
• Short-term impacts on tourism through the
temporary closure of national parks in the Fire affected
region. Figure 7: Fire impacted areas in the Upper North West region.
COVID-19
COVID-19 significantly impacted business-as-usual activities, with 37% of businesses reporting the
pandemic negatively affected their business. [5] Consequently, there was a sustained increase in income
support recipients in the acute phase of the pandemic in 2020, with Jobseeker recipients rising by 27%
while healthcare card recipients rose by 16% from March to June 2020.[6]
Border restrictions also restricted the traditional movement of people, workers and goods, with a
negative impact on the visitor economy. Tourism Research Australia data indicates 2021 spending levels
were down $125 million on 2019 levels as a result of decreased day and overnight travel.[7]
Mouse plague
Along with a large part of regional NSW, the breaking of the drought and bumper crops, along with
wetter than normal conditions provided the perfect environment for an explosion in mice numbers,
leading to a major mouse plague in 2021. Parts of the Upper North West region were significantly
impacted by the plague, with widespread damage to crops, agricultural machinery and infrastructure,
as well as broader impacts on residential property and community health and wellbeing.[8][9]
To support impacted communities, the NSW Government made available up to $95 million for primary
producers in financial need, and $45 million for the Small Business and Household Mouse Control
Rebate. In the Upper North West region, a total of $2.62 million was paid to 5,055 households and small
businesses recipients as part of the program.[10]
Floods
Since 2018, eight of the 11 natural disaster declarations across the Upper North West region have been
caused by severe storm and flooding events.[1] In 2021, major flooding occurred throughout Narrabri,
with water levels peaking at around 7.6 metres, resulting in major road closures. [11] Flooding events have
caused damage to local infrastructure, particularly local roads and visitor facilities, and have resulted in
the temporary closure of many national parks for visitor safety reasons.
In October 2022, all LGAs in the Upper North West region were again severely impacted by further
major flooding. The floods caused widespread damage to properties and infrastructure, with more than
390 properties inundated in Moree alone and more than 1,200 structures damaged, a range of key
transports links cut and properties in rural areas isolated for weeks. [12][13] The impact on key industries
was substantial, with it estimated that in Moree Plains Shire alone the loss of income to the agricultural
sector may have been as high as $500 million.[14]
Upper North West Regional Economic Development Strategy – 2023 Update 13Macroeconomic trends shaping the region’s future
Macroeconomic trends related to climate and migration have played a significant role in the Upper
North West region since 2018 and are likely to continue to have a strong influence on its future. With a
growing population of remote workers, the impacts of successive natural disasters and the progression
towards net zero, the region faces both opportunities and risks associated with these key trends.
Trend Opportunities and risks
The recent COVID-19 pandemic has accelerated The digital economy can
development of the digital economy in Australia, support opportunities to
Digital with increased uptake of remote working enhance innovation and
Transformation arrangements as well as online services such as support growing
education and telehealth.[15] industries.
As industries diversify and innovate, the need for Remote working and
reliable and efficient telecommunications digital service provision
infrastructure to support business growth and to can enable access to a
secure and retain a skilled workforce continues to greater labour pool for
increase. the region, noting it also
increases the ability for
Investment in improved infrastructure since 2018
local workers to remotely
include new mobile towers around Inverell and
work in roles elsewhere.
Narrabri will assist, but additional investment will
be required as demand increases, and to address
current connectivity and coverage shortfalls.
The continuing spread of urbanisation has seen A boost in population can
unprecedented migration to regional NSW. This is boost local economic
Changing evident in the population shift in 2020-21, with activity and attract new
Migration regional NSW gaining an additional 26,800 businesses and industries
Patterns residents while Sydney declined by 5,200.[16] to the region.
Migration has led to increased housing pressures Population increases
and brought an increased demand for place upward pressure on
metro-competitive services and infrastructure. existing infrastructure
Retaining a sufficient working population, and services, such as
especially in healthcare, also typically requires housing and care
high-quality placemaking and amenity.[17] economy services.
Although coal mining and gas reserves in the Opportunities for a range
region are expected to remain a key contributor to of renewable
the Upper North West regional economy in the investments, particularly
Towards Net short- to medium-term, the region will be in the Moree Special
Zero impacted by a broader shift towards renewables Activation Precinct.
in the medium to long term.
There is a need to ensure
The region has an emerging renewable energy the local community sees
sector given its natural endowments, with a range benefits from renewable
of wind and solar projects. investments beyond the
construction phase.
Upper North West Regional Economic Development Strategy – 2023 Update 14Trend Opportunities and risks
The region has seen a succession of extreme Elevated risk of damage
climatic events since 2018, including drought and to infrastructure assets
the mouse plague brought on by wet conditions given increased climate
Rising after several years of drought. Climate events variability.
Uncertainty have had a significant impact on local businesses
Risks of supply chain
and industries, particularly within agriculture.
unreliability impeding key
With the frequency and intensity of these events local industries in the
projected to increase in coming decades,[18] there region, including
is a need to enhance climate resilience in the agriculture and
region, with a focus on building community manufacturing.
resilience in relation to health and wellbeing, as
well as resilience of physical infrastructure.
Figure 8: The Village Store (built in 1911) at Inverell Pioneer Village. Photo credit: Destination NSW.
Upper North West Regional Economic Development Strategy – 2023 Update 156. Responding to change: Initiatives and investments since 2018
Figure 9: Producing ‘grove juice’ in Moree Plains LGA. Photo credit: Moree Plains Shire Council.
Since 2018, local councils, the NSW Government and other key organisations have delivered new and
updated key strategic documents and plans that help guide economic and community development in
the region. These documents support the development of local enabling actions that contribute to
progress against key REDS priorities and strategies.
Relevant 2018
Strategies and plans
strategies
The New England North West Regional Plan 2041 provides a long-term planning
framework for the broader region, and includes a focus on ensuring sufficient
supply and diversity of housing to service the needs of the region.
The region’s councils’ Local Strategic Planning Statements set out the strategic
planning objectives for each LGA, aligning with the Regional Plan. This is
complemented by each council’s Community Strategic Plan, which sets out actions
to address and support the community’s main priorities and future aspirations.
The Moree Special Activation Precinct (SAP) Draft Master Plan outlines pathways
to attract and grow businesses and employment opportunities to catalyse the SAP,
including streamlined planning and delivery of enabling infrastructure.
The Moree Plains Economic Development Strategy and Action Plan 2021-2031
seeks to capitalise on recent investments in the region to diversify the local
economy, attract investment and create employment opportunities. This work is
supported by the Moree Plains Local Housing Strategy, which seeks to achieve a
balanced approach to managing population growth and housing needs, particularly
for the delivery of large infrastructure projects such as the Moree SAP.
Upper North West Regional Economic Development Strategy – 2023 Update 16Relevant 2018
Strategies and plans
strategies
The Namoi Regional Job Precinct will focus on improvements in planning to support
the sustainable growth of intensive agriculture and livestock production.
The Narrabri Special Activation Precinct masterplan (under development) will
leverage the region’s strategic location to inland rail, Narrabri West Walgett line
and Narrabri Northern inland port to target energy-intensive manufacturing, value-
add agricultural production, recycling, and freight and logistics.
The Destination Country and Outback Destination Management Plan 2022-2030
establishes an approach to grow the region’s visitor economy and create
meaningful connections between communities, businesses and visitors to the
region.
The Royalties for Rejuvenation Fund and North West Expert Panel (established
under the Mining Act 1992) will support long term economic diversification for coal
mining regions, including funding infrastructure, services and programs.
The draft Gwydir and Namoi Regional Water Strategies set out the long-term water
plan for the Upper North West region.
Significant investments since 2018
2
9
8 2
16
8 4
1 7
15
10 9
8 3 4
1
8 15 11 8x
5
12 14
17 1
7
6 5 10 3
3 13
3 8
6
Figure 10: Map of significant investment in the Upper North West region since 2018.
Upper North West Regional Economic Development Strategy – 2023 Update 17As shown in Figure 10 above, since 2018 the region has received significant local, state and federal
funding through public investments, as well a range of private investment. These investments are at
varying stages of progress, with some delivered, some underway, and some still in the planning stage.
Public investments have focused on major health facilities, as well as a range of projects to increase
amenity for the local community, as well as the major projects of Inland Rail and the Moree SAP. Grant
funding has played a key role in the delivery of many of these projects.
Major private investment since 2018
Investment Estimated total Relevant 2018
project value strategies
1 Silverleaf Solar Farm $191 million
2 Bonshaw Solar Farm $238 million
3 Sapphire Solar Farm $280 million
4 White Rock Wind Farm – Stage 2 $300 million
5 Narrabri Gas Project $3.5 billion
6 Whitehaven Coal – Vickery extension project $607 million
7 Austin Mining – Ashford coal mine Not available
8 Bindaree Beef1 >$8 million
9 Boss Engineering facility upgrades1 $8 million
10 Australian Recycled Plastics expansion2 $4.3 million
0
Major public investment since 2018
Investment Estimated total Relevant 2018
project value(s) strategies
1 Moree SAP initial investment $194 million
2 Inland Rail >$2 billion
3 Northern NSW Inland Port $24.6 million
4 Moree Hospital redevelopment $80 million
1 Supported by funding from the NSW Government’s Regional Job Creation Fund.
2 Supported by funding from the NSW and Commonwealth Governments.
Upper North West Regional Economic Development Strategy – 2023 Update 185 Inverell Hospital upgrade $60 million
6 Wee Waa High School redevelopment $49 million
7 International Centre of Crop and Digital Agriculture $12 million
Major transport projects - Newell Highway >$360 million
8 upgrades, Moree Overpass, Narrabri to Turrawan
rail, Gwydir Highway intersection Inverell, County
Boundary Road resealing
9 Roads to Home – Stanley Village and Mehi Crescent Not available
10 Inverell Aquatic Centre Redevelopment $25.7 million
11 Myall Creek cultural precinct $1.1 million
12 Big River Dreaming Bingara projects >$2 million
13 Mount Kaputar walking tracks and campground $650,000
14 Copeton Northern Foreshores Upgrade $5.7 million
15 Gwydir Shire sporting facility upgrades >$2 million
16 Moree Civic Precinct development $2.4 million
17 Wee Waa Community and Business Hub $2.5 million
Regional grant programs
The region has received $109.58 million in grants since 2018. Key programs in the Upper North West
region have included the Growing Local Economies Fund, with $23.11 million provided to support major
transport and industrial development projects, and the Resources for Regions program, with
$22.45 million provided to support a range of transport infrastructure and community amenity projects.
Grant category Approved funding
Community $50.48 million
Economic $38.94 million
Disaster recovery $20.17 million
Note: Total grant funding outlined above only includes programs managed by the Department of Regional NSW, accurate as at January 2023.
Upper North West Regional Economic Development Strategy – 2023 Update 197. Upper North West 2023 economic snapshot
The Upper North West has experienced a declining rate of population growth in
recent years, which will present challenges given major projects in the region.
The region has seen a declining rate of population growth over the past five years. This highlights a key
need to focus on developing social infrastructure that can support attraction and retention of people in
their prime working age. This need is compounded by the pressures that can result from the workforce
needs of major projects, such as the Moree SAP.
Population growth
As displayed in Figure 11, the
region saw an average annual
population growth rate of -0.7%
between 2018 and 2021, with a
total decrease in population of
2.1% over the period. This equates
to a net loss of 1,025 residents
between 2018 and 2021.
While the region has experienced a
decrease in population in recent
years, NSW population projections Figure 11: Upper North West FER population growth, 2011-2021 (ABS ERP, July 2022).
forecast a return to positive
population growth in coming years.
It is forecast that there will be around a 4% increase in total population in the region during the period
up to 2031.[19] Given transformational investments including the Moree and Narrabri SAPs, the Namoi
Regional Jobs Precinct and Inland Rail, a strong foundation is being established to deliver sustained
economic growth in the region, which will also support population growth into the future.
Demographic profile
In 2021, the proportion of the Upper North West region’s population in their prime working years (20-54
years) was 6% lower than the NSW average, while the over 55 age group cohort was 5% higher. A key
challenge for the region will be providing sufficient workforce training and skills development to ensure
that labor supply can match the demand from key sectors such as healthcare, engineering trades and
legal, social and welfare professionals. In addition, there will be significant labour demand generated by
major projects such as the SAPs in the region, which will only heighted the need for a strong focus on
developing workforce capability and capacity in the region.
Figure 12: Upper North West FER population by age, 2021 (ABS ERP, July 2022).
Upper North West Regional Economic Development Strategy – 2023 Update 20Housing availability and affordability has tightened during the pandemic, posing challenges for future growth The region has faced a modest decline in housing availability and affordability since 2018. The delivery of the Moree and Narrabri SAPs is likely to place further pressure on housing supply in the region, and ensuring a sufficient and affordable housing supply will be critical for enabling long term growth. Housing availability Residential vacancy rates in the region have dropped from 3% in March 2020 to 1.2% in August 2022 (see Figure 13). As with much of regional NSW, this heightened demand has seen growth in house prices. Residential building approvals in the broader region continue to fluctuate greatly, with no evident increase in-line with observed demand for housing. While there is always a degree of lag between supply and demand for housing, there is a need to ensure that state and local planning systems (and other land development enablers such as infrastructure provision) are appropriately calibrated to keep pace with the projected demand for housing, especially as major projects in the region move towards the labour intensive construction phase. Housing affordability Between June 2018 and June 2022, the median house prices increased in parts of the region, with significant variation between LGAs. In Narrabri LGA median prices increased by 25% to $370,000 and in Inverell prices grew by 51% to $375,000. In Moree Plains LGA the median price was flat at $175,000, while in Gwydir Shire, the estimated median prices in June 2022 were $220,000 in Warialda and $238,750 in Bingara, with insufficient data available to estimate the change in prices since 2018.[20][21] Despite significant price rises in recent years, in 2021 the price to income ratio for the region was estimated to be 3.38, less than half the NSW average of 8.12, indicating the region maintains a relative cost advantage in relation to housing.[22] However, sustained house price growth, in particular in Narrabri and Inverell, may act as an increasing constraint for the region in attracting and retaining key workers, with flow on impacts for major project delivery and overall economic growth. Figure 13: Upper North West FER vacancy rate and building approvals, 2018-2022 (REINSW, 2022). Note: REINSW vacancy data collection is not aligned with the FER boundary map, resulting in an overlap with other FERs. These results are therefore intended to provide an indication of housing vacancies in the region. Upper North West Regional Economic Development Strategy – 2023 Update 21
Job vacancies in the region have increased significantly, yet unemployment rates
remain above the NSW average
The Upper North West unemployment rate remains relatively high, despite job vacancies more than
doubling since 2018. The region identified a need to further develop skilled workforce attraction and
retention initiatives in the 2018 REDS, and this priority remains critical going forward, given the need to
ensure a sufficient workforce to support major project delivery in the region.

Employment
As at June 2022, unemployment rates varied across Upper North West (see Figure 14). Narrabri and
Gwydir had unemployment rates of 5.4% and 5.0% respectively, while Moree Plains and Inverell had
unemployment rates of 7.5% and 8.4% respectively, compared to the NSW unemployment rate of 3.3%.
Throughout the pandemic, the region’s unemployment rates fluctuated in line with COVID-19 restrictions,
but unemployment rates in all 4 shires have been above the NSW average since December 2021. This
suggests there is room to source more local labour to support major projects and industry growth,
provided the right training is offered in the region to match the skills demanded.
As shown in Figure 15, job vacancies in the broader Tamworth and North West region have climbed to
reach a record 1,456 in August 2022, having risen significantly from approximately 544 in December
2018. Occupations with a particularly acute need for workers include sales assistants (106), carers and
aides (107), administrative workers (114), legal, social and welfare professionals (79), automotive and
engineering trade workers (70), and medical practitioners (75). This represents a particular challenge for
a region seeking growth while facing population growth and an ageing population, all of which bring
about increased demand for health and care services.
                            10.0
                             9.0
    Unemployment rate (%)

                             8.0
                             7.0
                             6.0
                             5.0
                             4.0
                             3.0
                             2.0
                             1.0
                             0.0

                                   Gwydir   Inverell     Moree Plains             Narrabri             NSW

Figure 14: Upper North West FER unemployment rates (%), 2016-2022 (National Skills Commission, 2022; ABS Labour Force, 2022).

Figure 15: Job vacancies, Tamworth and North West region (2018-2022) (Regional IVI, National Skills Commission, 2022).
Note: The regional IVI – National Skills Commission job vacancy data collection is not aligned with the FER boundary map, resulting in an overlap with
other FERs. Job vacancy data only includes online job vacancies. These results are therefore intended to provide an indication of job.

Upper North West Regional Economic Development Strategy – 2023 Update                                                                                22
Aboriginal employment
Aboriginal unemployment in the Upper North region was measured as 13.5% in 2021, a significant
reduction from 23.1% in 2016 and 27.4% in 2011. The rate remains above the NSW average Aboriginal
unemployment of 9.8% and the NSW general unemployment rate of 4.9%, but demonstrates that
sustained improvements related to Aboriginal economic participation have been achieved.
The SAPs in the region will unlock new employment opportunities across a range of skillsets that could
further support improved Aboriginal employment outcomes. The Moree SAP in particular seeks to open
up economic opportunities through land based activities associated with Aboriginal owned land, which
could present significant opportunities to support broader Aboriginal economic development in the
region.
Aboriginal unemployment rate: Upper North West 2011 27.4%
2016 23.1%
2021 13.5%
NSW Aboriginal unemployment rate 2021 9.8%
NSW unemployment rate 2021 4.9%
Source: ABS Census 2021
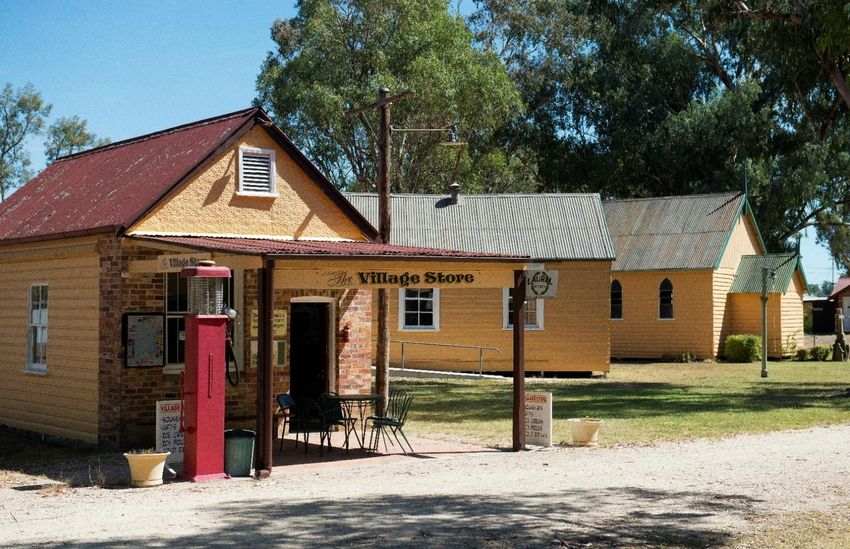
Figure 16: Moree Markets. Photo credit: Moree Plains Shire Council.
Upper North West Regional Economic Development Strategy – 2023 Update 23Upper North West region 2023 engine and emerging industries
The Upper North West is a $4.27 billion economy, driven largely by its specialisations in agriculture and
mining. Despite significant shocks since 2018, including bushfires, floods and the COVID-19 pandemic,
the region’s engine industries have remained a source of stability. The relative strength of industries in
the region is highlighted through Location Quotient (LQ) analysis3 as displayed in Figure 17, in which the
size of the bubbles correlates with industry size.
Engine industries
The region’s engine industries have remained consistent since the 2018 REDS/ with each demonstrating
growth and continuing to make a major contribution to the Upper North West’s regional economy.
Mining (LQ of 6.69) remains the dominant driver of economic output in the region, contributing $1.284b,
representing 30% of the local economy in 2020. Coal mining is the dominant sub-sector, contributing
$1,182m in 2020, equal to 92% of the industry’s value-add with a LQ of 7.4. Oil and gas extraction is the
second largest subsector, contributing $80m in 2020 with a LQ of 11.4.
Agriculture is another core engine industry for the region, generating $591m of GVA in 2020 with an LQ
of 7.13. This is driven largely by a strong sheep, grains, beef and dairy sector, which generates 71% of the
industry’s output in the region. Cropping and cotton production is another major contributor to the sector.
The region has also demonstrated consistent growth in the manufacturing sector (LQ of 0.71), in spite of a
state-wide decline in the industry across the same period, with the sector as a whole adding $182m to the
regional economy in 2020. The dominant sub-sector is meat product manufacturing (LQ of 5.5), a key
downstream industry associated with the region’s livestock specialisation.
20% Quadrant 1:
Mining
Small and growing
(potentially emerging
industries) Administrative and
support services
Administrative and
15% Support Services
Quadrant 2:
Specialised and growing
(engine industries)
GVA growth (% year on year)
Professional, scientific Health care and social
10% and technical services Public Administration and
assistance
Arts and Recreation
Health Care and Social
Safety Agriculture, Forestry and
Services Assistance
Public administration and Fishing
Arts and recreation Education and Other services
safety
services training
Education and Training Electricity,
ConstructionTransport, gas, water
Postal and…
5% and waste
Wholesale
Other Trade
Services services
Financial and Electricity,…
insurance Accommodation and Accommodation and
services Transport, postal Food Services food services
Construction
and warehousingInformation Media and
Retail Trade Location quotient (LQ)
Retail trade
0% Telecommunications
0.00 0.20 0.40 Professional,
0.60 … Scientific
0.00
Financial 1.000.80 2.00 1.00 3.00 1.204.00 1.40
5.00 6.00 7.00 8.00 9.00
and Technical
WholesaleServices
trade
Manufacturing Quadrant 4:
Quadrant 3:
Manufacturing Important/specialised but
Information media and Small and declining
telecommunications declining
-5%
Industrial Knowledge intensive Health and education Population serving
Figure 17: Location Quotient (LQ) Analysis by GVA, 2011-2020 (REMPLAN, 2020).
Note: While the 2018 REDS used employment data as the basis for LQ analysis, the 2023 Update used GVA data. This allows for a clear demonstration
of the changing economic impact of both engine and emerging industries across the regions.
3 LQ analysis is used to measure industry specialisation by comparing the relative size of an industry in the region versus the whole of NSW.
Upper North West Regional Economic Development Strategy – 2023 Update 24Emerging industries
The region’s emerging specialisations have remained consistent since the 2018 REDS (see Figure 18).
Electricity, gas, water and waste services, particularly renewable energy, is a growth sector for the
region at 3.6% over the past decade. The dominant industry sub-sector is electricity distribution,
accounting for 75% of the industry value-add in 2020. Gas supply is a growing specialisation for the
region with LQ of 1.2.
Additionally, population-serving sectors including health care and social assistance and education
demonstrate strong growth and potential as emerging specialisations for the region, particularly with
ongoing investments and collaboration with tertiary education institutions such as the University of New
England, Country University Centres in Narrabri and Moree, and TAFE.
Although not a specialisation, tourism is an important emerging industry for the region, generating cash
flow year round for the region. Nature-based tourism and national parks are estimated to have
contributed $41.3 million in economic value in 2018, and $123 million of estimated direct and indirect
recreation expenditure.[23] This emerging industry could be further developed by coordinated promotion
and development of tourism assets to encourage visitation and foster community and economic
resilience through a more diversified economic base for the region.
Mining
Mining 0.4%
18.4%
6.4%
Administrative
Administrativeand
andsupport
Supportservices
Services 12.6%
4.8%
Arts
Artsand
and recreation
Recreation services
Services 5.7%
Agriculture, forestry
Forestry and
and Fishing 7.2%
Agriculture, fishing 5.4%
Public Administration and Safety 6.9%
Public administration and safety 5.1%
Health Care and Social Assistance 5.2%
Health care and social assistance 4.4%
Otherservices
Services 4.0%
Other 3.9%
Construction 5.8%
Construction 3.9%
4.4%
Educationand
Education and training
Training 3.7%
1.2%
Professional,scientific
Professional, Scientificand
andtechnical
Technical services
Services 3.6%
3.2%
Electricity,
Electricity,gas,
Gas,water
Waterand
andwaste
Wasteservices
Services 3.6%
3.8%
Despite the broader NSW wide trend of
Accommodation
Accommodationand
andfood
Foodservices
Services
2.0% decline, manufacturing has maintained
Financial and
Financial insurance
and Insuranceservices
Services
2.0%
3.7% positive growth in the Upper North
0.5% West region.
Wholesale
Wholesale trade
Trade 1.3%
Retail
Retail trade
Trade 2.7%
-0.7% 0.8%
Manufacturing
Manufacturing 0.6%
Transport,
Transport,postal and Warehousing
Postal and warehousing -1.0% 3.2%
Information
Informationmedia
Media and telecommunications
and Telecommunications 6.1%
-2.6%
-5% 0% 5% 10% 15% 20%
NSW growth 2011-2020 Upper North West growth 2011-2020
Figure 18: Change in GVA by industry (% YOY), 2011-2020 (REMPLAN, 2020).
Upper North West Regional Economic Development Strategy – 2023 Update 25Upper North West region 2023 endowments
Review of the 2018 endowments
The 2018 REDS identified a diverse range of endowments underpinning Upper North West's economy and
regional competitiveness (see page 11). Despite recent shocks impacting many key endowments,
consultation confirmed that most of them remain valid, with key endowments including:
• highly productive agricultural land and know-how
• access to water
• location and transport access
• mineral and gas resources
• renewable energy resources
• quality cultural, natural and tourism assets and experience
New endowments
While not yet reflected in the employment and industry specialisation (LQ) analysis, recent investments
and policy efforts have led to the creation of new endowments which will underpin new economic
opportunities and future specialisations.
Narrabri Special
The Narrabri SAP will be a business hub specialising in
+ Activation Precinct
manufacturing, agriculture, recycling, and freight and logistics.
(SAP)
Moree Special
The Moree SAP will be a business hub specialising in agribusiness,
+ Activation Precinct
logistics, and food processing.
(SAP)
Inland rail will improve freight efficiency and access to external
+ Inland rail
markets for the region’s key engine industries.
New England The New England REZ will provide significant renewable energy
+ Renewable Energy generation capacity, which will support the push towards net zero
Zone (REZ) and provide opportunities for key energy reliant industries.
The Namoi RJP will have a focus on enabling growth of
Namoi Regional Jobs sustainable farming practices to support industry resilience and
+
Precinct (RJP) productivity, with a focus on growth in the intensive agriculture
sector and livestock production.
Upper North West Regional Economic Development Strategy – 2023 Update 268. Looking ahead: Strategic opportunities for growth, resilience
and liveability
Opportunities and vulnerabilities in engine and emerging industries
Agriculture
The Moree SAP, and ongoing investment to deliver inland rail will support further growth in the
agriculture sector by improving freight efficiency in the region.
GVA (2020, $m) 591
Employment (2021) a 3,938
LQ score (2020) 7.13
LQ Sheep, grain, beef and dairy (2020) 10.1
LQ Other agriculture (2020) 4.9
a ANZSIC 1 digit Agriculture, forestry and fishing
Strengths
• Sheep, grain, beef & dairy is the dominant sub-sector, accounting for 71% of sector output in 2020.
• The region has long been a leader in agricultural research and crop development, with the University
of Sydney Plant Breeding Institute a key local endowment that was first established in 1960.
• Major facility upgrades at Wee Waa in 2016 support seed distributors to grow other crops, in particular
cotton.
• Continued innovation from farmers and producers has enabled efficiency and productivity gains, for
instance the shift towards increased use of round bailing for cotton.
• The region benefits from co-location with downstream food product manufacturing businesses.
Vulnerabilities
• The industry relies on viable climatic conditions for production which may present vulnerabilities in the
face of rising incidence of extreme climate events.
• Farm labour shortages continue to challenge the sector, driven by lingering impacts from COVID-19
border restrictions given the traditional reliance on international migrants, and a lack of affordable
accommodation in parts of the region.
Opportunities
• The Moree and Narrabri SAP, as well as the Namoi RJP will attract investment and support growth in
agribusiness and food processing sectors, while access to inland rail will improve freight efficiency.
• The quality of soil in Moree produces high quality protein grain which is supporting the emerging
market of plant-based protein.
• Ongoing investment in the uptake of agtech in farming processes can help offset ongoing workforce
shortages and drive efficiencies going forward.
Upper North West Regional Economic Development Strategy – 2023 Update 27Mining
The region benefits from a range of natural endownments to support the mining industry, including major
coal reserves, deposits of gemstones, industrial minerals and extractive minerals. While the shift towards
net zero will present challenges for the sector, it remains a critical part of the regional economy.
GVA (2020, $m) 1,284
Employment (2021) 545
LQ score (2020) 6.69
LQ Coal mining (2020) 7.4
LQ Oil & gas extraction (2020) 11.4
Strengths
• The Gunnedah coal basin is the state's third largest coal reserve with a potential for coal seam gas.
• The Upper North West region also has a range of deposits of gemstones, industrial minerals and
extractive minerals.
• The sector continues to see significant growth in the Upper North West, averaging growth of 18.4%
per annum in GVA between 2011 and 2020.
Vulnerabilities
• While investment in coal mines continues, state and national net zero targets will require the industry
to adapt.
• The sector remains susceptible to supply chain disruptions, fluctuations in input costs, energy supply
and freight costs.
• Workforce shortages continue for the sector, and there is strong competition between mining
companies for labour.
• A lack of worker accommodation in some parts of the region also represents an impediment to the
mine expansion projects.
Opportunities
• The recently approved Narrabri Gas Project for the exploration and extraction of coal seam gas from
the Pilliga State Forest is expected to generate 170 direct jobs in the gas sector and could help
support the establishment of additional local manufacturing facilities.
• Collaboration with education and training providers such as the University of New England, the
Country University Centres and local TAFEs can be leveraged to develop the relevant skills base
needed for the sector, in particular for key roles such as mine engineers.
• The NSW Government’s Royalties for Rejuvenation Fund will provide opportunities to access support
for long term economic diversification in the region, including through the funding the infrastructure,
services, programs and other activities.
Upper North West Regional Economic Development Strategy – 2023 Update 28Manufacturing
Manufacturing remains a strength in the region’s economy/ with a primary part of the sector dedicated to
meeting the needs of the region’s mining and agriculture sectors.
GVA (2020, $m) 182
Employment (2021) 1,069
LQ score (2020) 0.71
LQ Meat & meat products (2020) 5.5
LQ Oil and fats (2020) 12.5
Strengths
• The manufacturing sector primarily services the region’s strong mining and agriculture sectors.
• The dominant sub-sector is meat product manufacturing, with $79 million GVA in 2020.
• Other food-based manufacturing with significant export markets active in the region include cotton
seed, canola oil, pet food, flour milling and soft drinks.
Vulnerabilities
• The manufacturing sector is susceptible to supply chain disruptions, which was highlighted in many
parts of NSW during the COVID-19 pandemic.
• Upwards pressure on prices for key inputs such as energy supply and freight transport costs can
significantly impact on the sector, and workforce shortages remain a key challenge.
Opportunities
• Significant opportunity will exist to leverage the investment attraction and logistics improvements
associated with the development of the Moree SAP, the Narrabri SAP and Inland Rail.
• The Narrabri Gas Project can improve the availability of lower-cost gas supply resources in the region,
which can support manufacturing industry expansion in the region.
• Opportunities exist in niche speciality manufacturing of recycled plastics, including possibilities for
further investment in operations and upgrades to machinery to allow for better throughput.
• Emerging opportunities exist for advanced manufacturing and robotics in food processing,
particularly around the Namoi Regional Job Precinct.
Upper North West Regional Economic Development Strategy – 2023 Update 29You can also read