Uranium incorporation in fluorite and exploration of U-Pb dating
←
→
Page content transcription
If your browser does not render page correctly, please read the page content below
Uranium incorporation in fluorite and exploration of U-Pb dating
     Louise Lenoir1, Thomas Blaise1, Andréa Somogyi2, Benjamin Brigaud1, Jocelyn Barbarand1, Claire
     Boukari1, Julius Nouet1, Aurore Brézard-Oudot3, Maurice Pagel1
     1
       Université Paris-Saclay, CNRS, GEOPS, Orsay, 91405, France
 5   2
       Université Paris-Saclay, Synchrotron SOLEIL, Saint-Aubin, 91190, France
     3
       Université Paris-Saclay, CNRS, CentraleSupélec, Group of electrical engineering Paris (GeePs) Gif-sur-Yvette, 91192,
     France

     Correspondence to: Louise Lenoir (louise.lenoir@universite-paris-saclay.fr)

10
     Abstract. The age of ore deposits constitutes a decisive element in understanding their formation. Deciphering their precise
     chronology may be a challenge in the absence of mineral phases that can be dated by conventional geochronometers. Fluorite
     is very common either as the major or accessory mineral in a wide variety of ores and may provide information regarding the
     origin and timing of mineralizing fluid flows. In this contribution, we explore U-Pb dating on fluorite crystals from the world-
15 class carbonate strata-bound fluorite ore of Pierre-Perthuis in Burgundy (Morvan massif, France). Uranium distribution within
     fluorite is mapped using induced fission-track and sSynchrotron radiation X-Ray fFluorescence nano-imaging, showing that
     higher uranium content is measured in an overgrowth of fluorite (Flog) as a discrete band. Preservation of a micrometer-thick
     zonation in U, associated with other substituted elements such as Sr, Y, Fe and Zr implies that neither solid-state diffusion nor
     dissolution-recrystallization did occur. These U-bearing external fluorite overgrowths contain solid inclusions of about 30 µm
20 globular pyrite crystals with a mean δ34S of –23.6 ± 0.4‰ V-CDT. We propose that the U incorporation in the fluorite lattice
     results from the development of a redox front its reduction mediated by H2S release during bacterial sulphate reduction. Flog
     generation sampled and analyzed by LA-ICP-MS on four different crystals provides identical U-Pb ages within the limits of
     analytical uncertainty. Considered altogether, these four crystals yield an age estimate of 40.0 ±1.7 Ma, not corrected for
     matrix-related elemental fractionation. Our results show that fluorite LA-ICP-MS U-Pb geochronology has potential for dating
25 distinct crystal growth stages, although further research should be conducted to evaluate its accuracy.

     1 Introduction

     Sedimentary rocks lying unconformably upon a crystalline basement may host large concentrations of authigenic F, Ba, Pb,
     Zn and U minerals that are of economic interest (Boiron et al., 2002; Gigon et al., 2020; Gigoux et al., 2015; Leach et al.,
     2005; Sizaret, 2006). These unconformity-related deposits are usually the result of multiple fluid flows inducing mineral
30 dissolution-recrystallization, remobilization and precipitation (Chi et al., 2018; Walter et al., 2018). Knowing the timing
     of these successive fluid flows is essential for building robust genetic models for mineral deposits. Fluorite, one of the 27

                                                                    1
critical raw materials defined as crucial for the economy of the European Union (European Commission, 2017), is commonly
     associated in mineral assemblages in veins or strata-bound deposits. Fluorite Sm-Nd geochronology (Galindo et al., 1994; Dill
     et al., 2011) might help to reconstructitute the geological scenario which led to the mineral deposition, together
35 with other direct radiometric dating of authigenic phases, either by bulk dissolution, (e.g., Rb-Sr on sphalerite (Nakai et al.,
     1993), Re-Os on molybdenite (Markey et al., 1998; Stein et al., 2001) and Re-Os on pyrite (Cardon, 2007; Mathur et al.,
     2000)) or by in situ sampling and analysis (e.g., Ar-Ar on adularia (Cathelineau et al., 2012; Mark et al., 2005) Ar-Ar on Mn
     oxides (Deng and Li, 2017) or U-Pb on uraninite (Alexandre et al., 2009; Martz et al., 2019)).

     However, it is frequent that fluorite Sm-Nd geochronology produces errorchrons, and additionally, when the age estimation is
40 considered as geologically consistent, results may be unreliable due to poor analytical precision. Moreover, it is sometimes
     difficult to interpret Sm-Nd ages when they are obtained from the bulk dissolution of a crystal fragment that may be composed
     of several growth stages. To overcome these issues, a non-radiometric method based on the acquisition of chemical remnant
     magnetization in fluorite has been developed and employed to date fluorite deposits in areas where the geodynamic evolution
     and the apparent polar wander path are well documented (Kawasaki and Symons, 2008; Symons, 1994; Symons et al., 2017).
45 Along with other elements, fluorite accepts the incorporation of uranium and lead in its crystal lattice in substitution for
     Ca2+ (typically at low concentrations, from a few ppm to a few ‰, (Piccione et al., 2019)). As a result, fission-track (Grønlie
     et al., 1990) and (U-Th)/He (Evans et al., 2005; Wolff et al., 2015) thermochronology have been tested in fluorite. Wolff et
     al., (2016) show that He diffusion in fluorite varies depending on metalelemental substitution in the crystal lattice.

     In recent years, in situ U-Pb geochronology has been successfully applied to a growing number of mineral matrices, including
50 calcite and dolomite (Burisch et al., 2017), hematite (Walter et al., 2018), opal (Nuriel et al., 2019), cassiterite (Moscati and
     Neymark, 2020), Mn-rich chrysocolla and pseudomalachite (Kahou et al., 2020), epidote (Peverelli et al., 2020), nacrite and
     fluorite (Piccione et al., 2019). Piccione et al., (2019) reported for the first time LA-ICP-MS U-Pb ages acquired on fluorite
     that are consistent with those of adjacent nacrite crystals, showing that fluorite U-Pb geochronology can constrain the timing
     of fluid flows, providing favorable U/Pb. However, the incorporation and retention of U and Pb in the crystal structure of
55 CaF2 are very poorly documented, hence currently limiting the reliability of fluorite U-Pb dating. Moreover, compared to other
     common lead-bearing minerals, fluorite sampling by laser ablation presents some additional analytical challenges, such as
     laser-induced damage (De Bonis et al., 2014; Jia et al., 2005; Rafique et al., 2012) and ejection of solid fragments causing
     variable ablation rates (Gogoll et al., 1996).

     The aim of this study is to examine the spatial distribution of uranium and lead and to further explore small-scale LA-ICP-MS
60 U-Pb geochronology in fluorite crystals. The unconformity-related F-Ba ore in Pierre-Perthuis (Morvan massif, France) was
     chosen as a case study. This ore has been investigated in previous studies (Gigoux et al., 2015, 2016) and a generation of
     macroscopic geodic fluorite has been dated at 130 ± 15 Ma by Sm-Nd geochronology (Gigoux et al., 2015). As in many other
     F-Ba deposits, the most commonly used geochronometers are lacking in Pierre-Perthuis, making it an idealinteresting target
     to gain knowledge on fluorite precipitation ages through for testing fluorite U-Pb dating. Through the use of various petro-

                                                                    2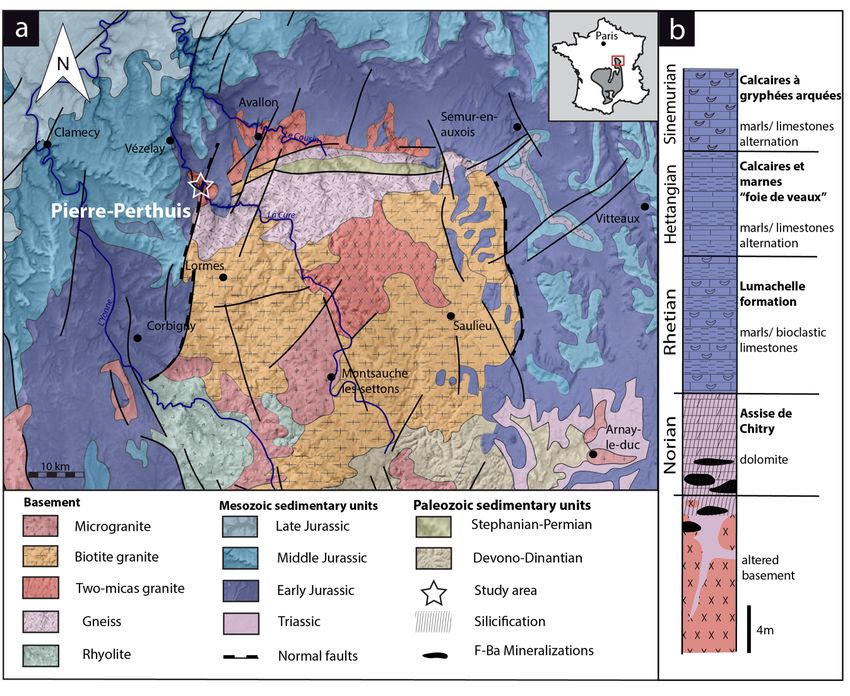
65 geochemical investigations involving multiple analytical methods, including induced fission-track mapping, sSynchrotron
     radiation X-Ray fFluorescence nano-imaging, secondary ion mass spectrometry and LA-ICP-MS, this paper will address the
     following questions:

     - How are U and Pb spatially distributed within micrometer-thick fluorite growth bands?

     - How is uranium incorporated in fluorite?

70 - Are U and Pb effectively retained in fluorite?
     - Can we use fluorite U-Pb geochronology to gain knowledge of the chronology of fluid flows?

     2 Geological settings

     The studied area is located at the interfaceunconformity between the Paris Basin and the French Massif Central (FMC), about
     200    km    south     east   of        Paris.   The   Paris   Basin   is   an intracratonic sedimentary     basin   that   formed
75 above Cadomian and Variscan basement rocks (Guillocheau, 2000). The FMC was structured during the Variscan orogeny
     (Lardeaux et al., 2014; Vialette, 1973). The northern edge of the FMC corresponds to the Morvan Massif made up mostly of
     granitic rocks emplaced during the Early and Late Carboniferous (Lardeaux et al., 2014; Vialette, 1973). The
     northern Morvan basement           is      composed      of    three    granitic    units    namely        the Avallon, Lormes and
     Les Settons and a metamorphic unit (Lower Gneiss Unit). The Pierre-Perthuis ore is spatially related to an unconformity
80 between the Avallon granite basement and the Late Triassic sediments on the northwestern part of the Morvan Massif (Fig.ure
     1a). Two main geological units compose out crop atthe Pierre-Perthuis outcrop: (1) the Avallon two-mica granite which shows
     a weathered zone of about 0.5 to 3 m thickness at its top, and (2) 4 to 8 m of silicified dolostone that corresponds to the Assise
     de Chitry Formation (Fm), a Carnian/Norian dolomite formation (235–208 Ma), silicified after the deposition (Fig.ure
     1b). The main fluorite mineralization forms euhedral (cubic habits) fluorite crystals dispersed within the silicified dolomite
85 rock. A second occurrence forms centimeter cubic fluorite in geodic cavities that crystallized under relatively stablenarrow
     temperatures range of 80-100°C (Gigoux et al., 2016). These Both fluorite mineralizations are complemented by two barite
     stages (an early small blade-shaped barite stage and a late fan-shaped pink barite stage), three quartz stages (a microcrystalline
     stage responsible for the silicification of the Assise de Chitry Fm co-precipitated with chalcopyrite followed by a quartz fringe
     stage, and a late granular stage) and at least four sulphide stages.

                                                                       3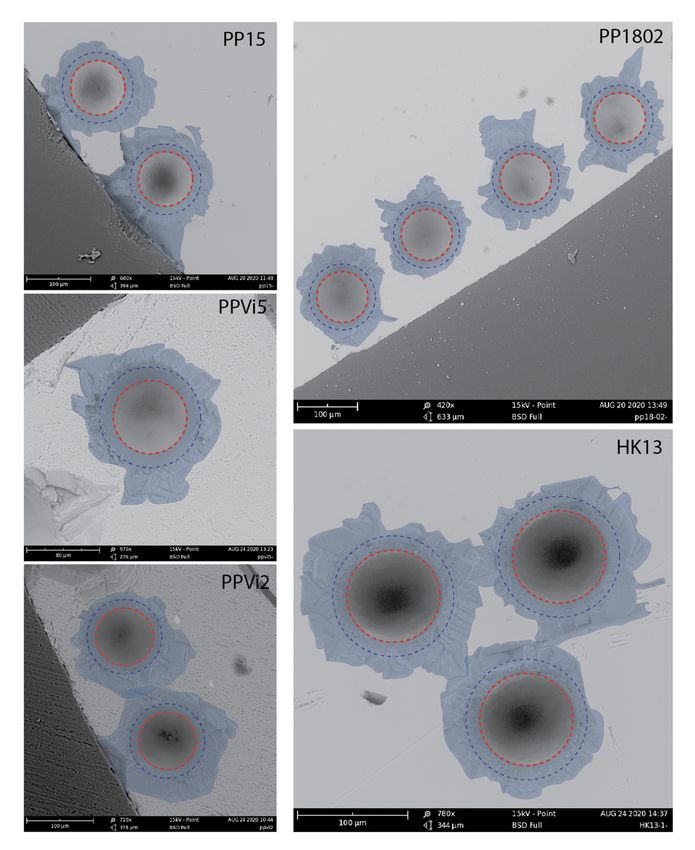
90

     4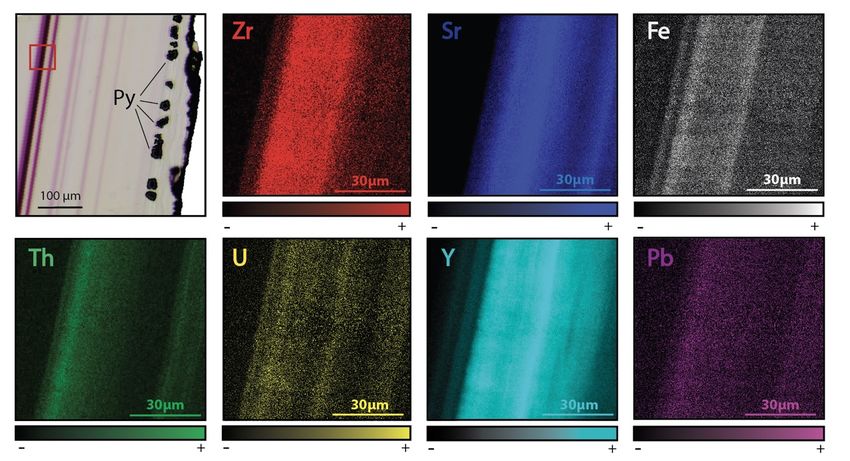
Figure 1: (a) Geological map of the Morvan Massif with the location of the strata-bound fluorite ore of Pierre-Perthuis (modified
    according to the 1/1.000.000 geological map, BRGM) and its (b) stratigraphic log modified according to Soulé de Lafont and Lhégu
    (1980).

95 3 Materials and methods
    3.1 Sampling strategy

    The Pierre-Perthuis district is   composed     of    three    areas:    (1) Bois Dampierre,     (2) Bois de l’Epenay and     (3)
    La roche percée (Fig.ure 2a). All samples were collected at the Pierre-Perthuis ore from outcropping rocks in the weathered
    granite (Fig.ure 1c2b) close to the sedimentary cover and are summarized in Table 1.

                                                                   5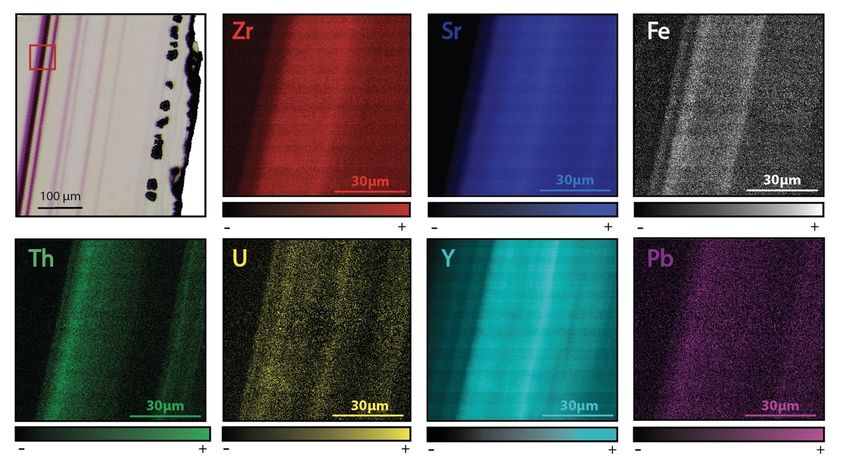
100
      Figure 2: a) Location of the mineralized outcrops at Pierre-Perthuis and b) a W-E geological profile localized on the geological map
      by the red line, modified according to the 1/50.000 geological map of Avallon (Horon et al., 1966) and , (Gigoux et al., 2016; Soulé de
      Lafont and Lhégu, 1980b).

                                                                        6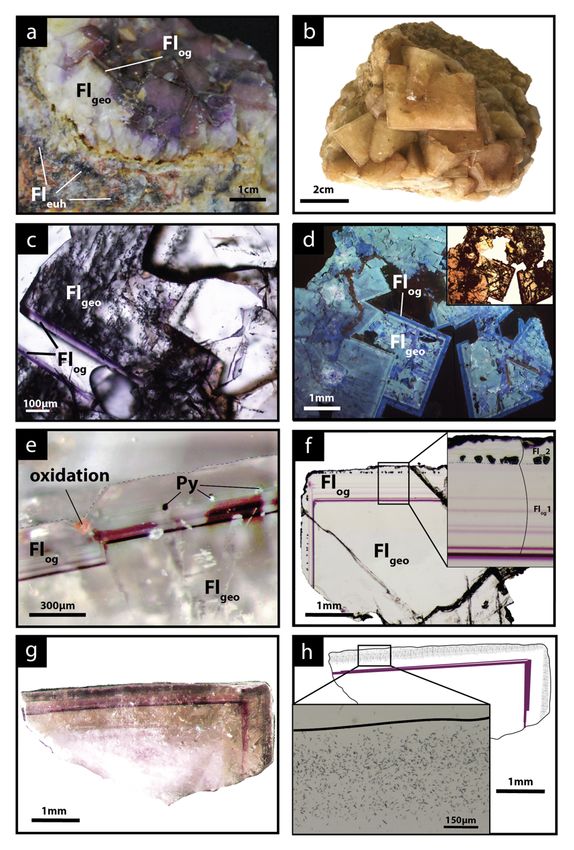
Location                                                    Applied Method
        Sample                                                34
                                                             δ S by SIMS         U-Pb dating by         Fission track
                                                                                                                             Scanning
         Name       Geographic sector   Lat. X Long. Y         (‰V-CDT)         LA-ICP-MS (Ma)            mapping
                                                                                                                             SR-XRF
                                                              δ34S    2σ         Age         2σ      Tracks nb Area(µm2)
         PP18S3      Bois Dampierre        47.43   3.792     –24.2    0.3        N.D.       N.D.       N.D.      N.D.           N.D.
                                                                                                                           Zr, Fe, Th, Sr,
         PP18S7      Bois Dampierre        47.43   3.792     –23.6    0.3        N.D.       N.D.       N.D.        N.D.
                                                                                                                              Pb, Y, U
                                                                                                                           Ca, Fe, Th, Sr,
        PP18S15      Bois Dampierre        47.43   3.792     N.D.    N.D.        N.D.       N.D.       N.D.        N.D.
                                                                                                                              Pb, Y, U
         PP1802     Bois Dampierre         47.43   3.792     N.D.    N.D.          40.8        3.4     1276    51.5x.103        N.D.
                         Roche
         PP1801                         47.436 3.784         N.D.    N.D.        N.D.       N.D.       196      24x.103         N.D.
                         percée
                         Roche
          PPVi2                         47.435 3.786         N.D.    N.D.          38.7        1.8     N.D.        N.D.         N.D.
                         percée
                         Roche
          PPVi5                         47.435 3.786         N.D.    N.D.          41.1        2.2     N.D.        N.D.         N.D.
                         percée
          PP15      Bois de l’Epenay    47.431 3.786         N.D.    N.D.          41.8        2.8     N.D.        N.D.         N.D.

      Table 1: Sample location, sulfur stable isotopic composition of pyrite, fluorite U-Pb age, fission track and Scanning SR-XRF of
105   fluorite. (N.D. = not determined)

      3.2 Petrographic observations

      Polished    thin   sections   were     observed      investigated     with     optical     microscopy   in    transmitted   and    reflected
      light, and under cathodoluminescence (CL) equipment composed of a BX41 microscope coupled to a cold cathode
110 from NewTec operating at 12 kV and 200-300 µA and a Qicam Fast 1394 digital camera. More details about the
      cathodoluminescence activators and inhibitors in fluorite can be found in Baele et al., (2012) and Kempe et al., (2002).
      Uncoated polished thin sections were also observed and analyzed by scanning electron microscopy (SEM, Phenom X
      Pro) using a charge compensation sample holder in backscattered electron mode (BSE). Images were produced at an
      acceleration voltage of 15 keV. Semi-quantitative elemental compositions were measured through energy dispersive X-ray
115 spectrometry (EDS) at an acceleration voltage of 15 keV and an accumulation time of 30 s.

      3.3 Uranium distribution mapping

      To map the uranium distribution in fluorite crystals of the Pierre-Perthuis ore, the fission track cartography based on the
      induced fission of 235U was carried out using the external detector method (Gleadow, 1981). Fluorite crystals were mounted in
      an epoxy resin and polished. Polished sections were covered by muscovite detectors in close contact and irradiated in the
120 Research Neutron Source Heinz Maier-Leibnitz (FRM II) of the Technical University of Munich (Garching, Germany).
      Thermal neutron fluence was 1 x 10¹⁶ n/cm2. Track densities are calibrated using the standard reference glass CN5 with a total
      U concentration of 12.17 ppm. After irradiation, the external detectors were detached and etched in 48% HF at

                                                                            7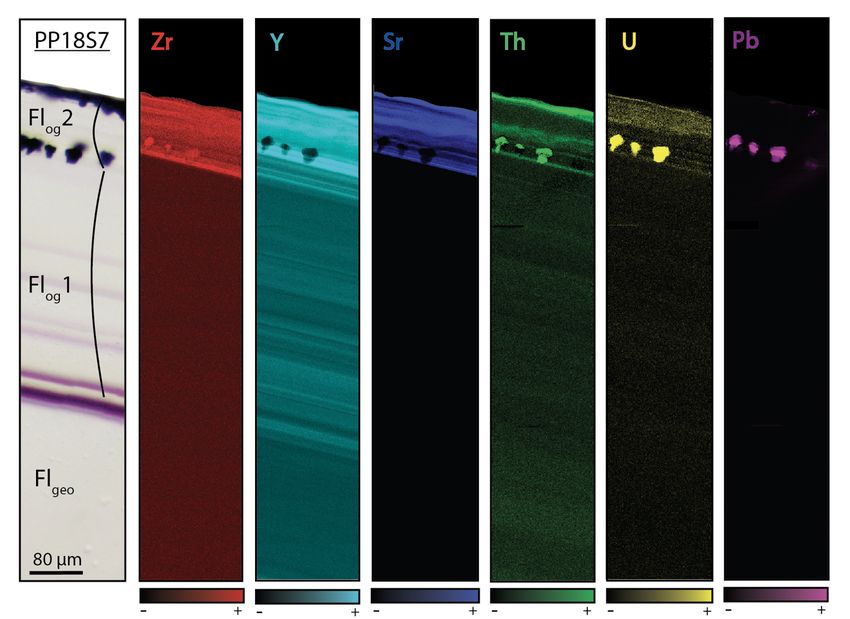
20 ± 1°C for 20 minutes. Induced fission tracks revealed on detectors were observed and counted using a LEICA DMLM
       optical microscope in transmitted light with a x1000 magnification.

125 According to Enkelmann et al., 2005, the correction factor for uranium concentration between a standard and any unknown
       geological material depends on the range of latent track lengths and the density of materials. The latent track lengths of fission
       particles (2R) in fluorite have been simulated using SRIM® software (Ziegler et al., 2010). Numerical data employed and
       results of these simulations are summarized in Table A1. The calculated correction factor (Fcorr) for uranium concentration in
       fluorite is 0.866.

130 3.4 Scanning sSynchrotron radiation X-Ray fFluorescence nano-imaging
       Fluorite crystals were mounted in an epoxy resin, polished on both sides to a thickness of a hundred micrometersns and cut
       into 5mm -edge squares. These preparationsmounts were fixed on Teflon rings and positioned perpendicularly to the incoming
       X-ray beam.

       Seven fluorite samples were scanned by sSynchrotron radiation X-ray fluorescence (SR-XRF) using the Nanoscopium hard
135 X-ray nanoprobe beamline (Bergamaschi et al., 2017; Somogyi et al., 2015) of sSynchrotron SOLEIL (Université Paris-Saclay,
       Saint Aubin, France). Elemental distribution mapping was acquired from these polished sections in different areas at a spatial
       resolution varying from 50 nm to 1 µm and with an integration time per pixel varying from 150 ms to 20 ms. The 18 keV
       monochromatic X-ray beam was focused on the crystal samples by a Kirckpatrick-Baez nano-focusing mirror. This excitation
       energy of 18 kKeV was chosen farther away from the U-L3 absorption edge (17.168 keV) in order to avoid the overlapping of
140 the U-L3 X-ray lines and the Compton scattering peak of the incident X-ray beam from the sample. This allows the
       optimization of the analytical sensitivity of U due to the reduced spectral background below the U-L3 lines. To obtain
       nanometer-scale resolution elemental maps on mm2 sized samples, a fast-continuous scanning technique (FLYSCAN) has been
       employed (Lanzirotti et al., 2010; Medjoubi et al., 2013). Full XRF spectra were collected at each pixel of the scans by two
       silicon drift detectors of 50 mm2 useful area (KETEK H50, KETEK GmbH) used with XMAP (XIA LLC) fast digital
145 multichannel analyzer cards. The XRF detectors were placed at 20° relative to the sample surface (Somogyi et al., 2015).
       The high-resolution scans consisted of 100 000 - 300 000 individual XRF spectra corresponding to an XRF spectrum at each
       image pixel. In order to treat this data-set, as a first step we used the XRF sum-spectrum of the entire scanned area to identify
       the main elements present. The distribution maps of these elements were reconstructed by an in-house Matlab® code. Because
       the scanned areas sometimes included different mineral matrices (fluorite and pyrite), or successive growth bands of distinct
150 chemical composition in the same mineral, sub-zones were defined by the Matlab® code from the elemental distribution maps
       in order to extract the average XRF spectrum corresponding exclusively to the targeted mineral matrix or growth band. These
       sub-zones, or regions of interest (ROIs), were selected by using ImageJ® software (Schneider et al., 2012). The mean XRF
       spectra of the ROIs was fitted using PyMCA® software (Solé et al., 2007). This allowed us to identify additional elements,
       present only in tiny areas or in small quantities (e.g., Th), and as such not detectable in the sum-spectrum of the whole sample

                                                                       8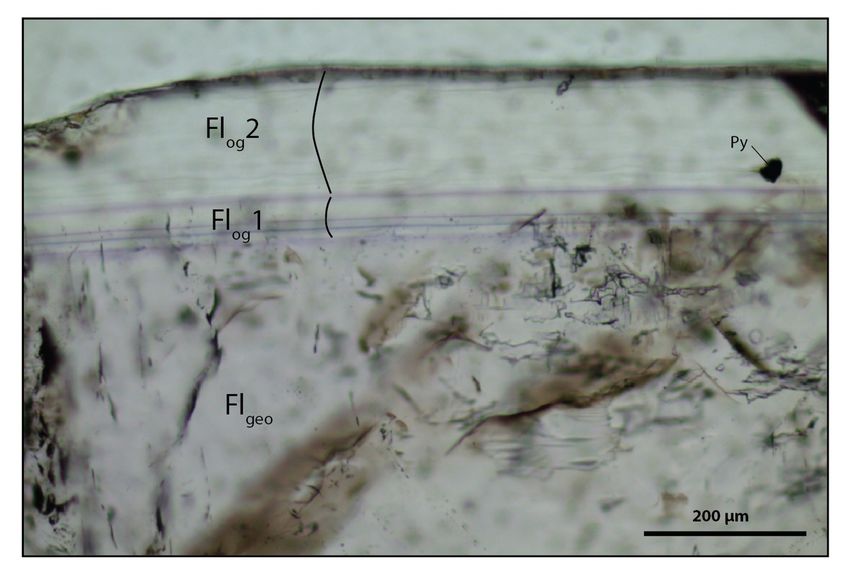
155 area. As a second step, the elemental distribution maps of all the identified elements were reconstructed by correcting for
       spectral overlaps depending on the intensity ratios of the X-ray lines. Because sample thickness varies between 100 to 300
       micrometers, the low energy X-ray spectral line intensities will not be revealed from the whole sample thickness by SR-XRF.
       The depth of information for all elements included in the present paper is documented in Table A3.

       3.5 Sulfur stable isotope composition of pyrite

160 Sulfur isotopes were measured by Secondary Ion Mass Spectrometry (SIMS) using a multi-collectors CAMECA IMS1270 E7
       microprobe at the Centre de Recherches Pétrographiques et Géochimiques (CRPG, Université de Lorraine and CNRS) in
       Nancy (France). Samples that were already prepared for synchrotron XRF-spectromicroscopy were re-used. They were glued
       on a glass slide, then coated with a layer of 30 nm of Au. To accurately locate the SIMS analysis, petrographic observations
       using reflected light microscopy were carried out before and after gold plating. Pyrite inclusions in fluorite were sputtered with
165 a 10 kV Cs+ primary ion beam with a current of 2.7 nA. A normal-incidence electron gun was used for charge
       compensation. 32S− and 34S− secondary ions were detected in multi-collection mode using two Faraday cups. Samples were
       pre-sputtered for 120 seconds with a beam raster of 20 x 20 µm prior to signal acquisition to minimize surface contamination.
       Faraday cup backgrounds were measured during the pre-sputtering before each analysis and then used for correcting the data.
       Typical count rates of 32S− and 34S− were of 4.8×10⁸ counts per second (cps) and 2×10⁷ cps respectively, during 30 cycles of
170 4.96 seconds acquisition time. The spot size was about 15 µm in diameter. A nominal mass resolution (M/ΔM) of 4998 was
       used to resolve interference with hydrides.

       A Sierra Pyrite sample was used as an internal matrix-match standard to correct the sulfur isotopic ratio (Table 2). Data was
       integrated as a 32S/34S ratio (δ34S in ‰) and referenced to the Vienna-Canyon Diablo Troilite (V-CDT) scale (Ding et al.,
       2001). Homogeneity of the Sierra Pyrite has been documented by LaFlamme et al., (2016) by three analytical techniques
175 (EPMA: Electron Probe Micro Analyser, Wavelength-Dispersive X-Ray sSpectroscopy-maps and SEM-BSE) and its δ34S
       measured by fluorination gas-source mass spectrometry SIMS at 2.17 ± 0.08 ‰V-CDT. Measurements were carried out through
       daily sequences consisting of 5 analyses of matrix-match reference material followed by spots on unknown samples. For the
       first session, Sierra pyrite was measured at 0.94 ± 0.02 ‰V-CDT, and at 0.92 ± 0.02 ‰V-CDT for the second analytical session.
       Instrumental mass fractionation (IMF) for 34S−/32S− was quantified during each analytical session using all the replicated
180 analyses of the matrix-match standard. During the first session the IMF was –1.23 ± 0.34 ‰V-CDT, and –1.25 ± 0.28 ‰V-CDT for
       the second. Final uncertainties are reported at a 95% confidence level (2σ), propagating the systematic uncertainty of primary
       reference material Sierra pyrite (3.7 %, LaFlamme et al., 2016), and the propagated correction for instrument mass
       fractionation through the analytical session by quadratic addition.

                                                                       9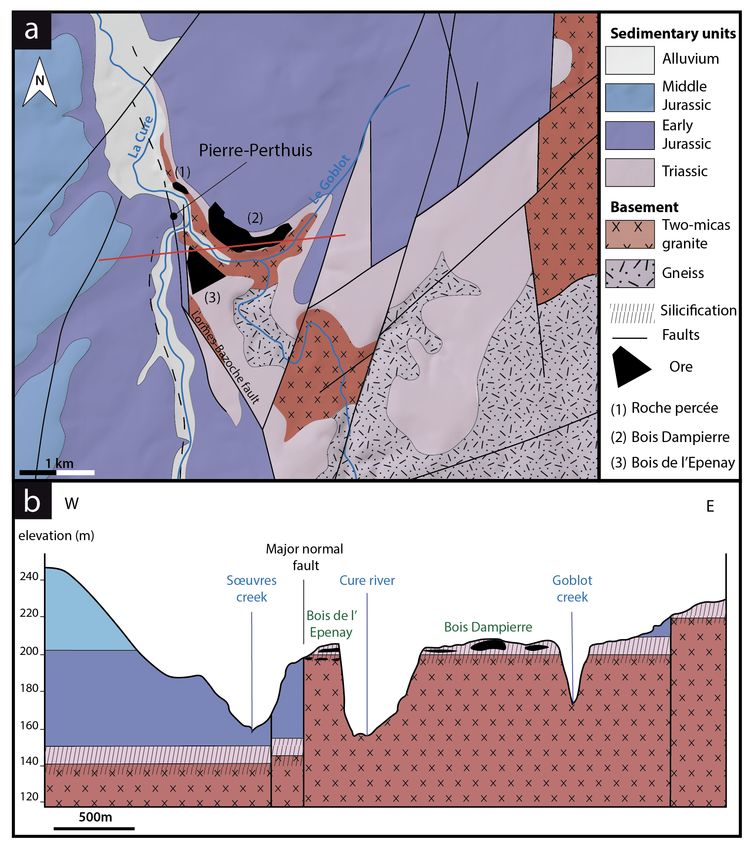
δ34S            δ34S                                 IMF
                            Reference         Standard                                       Instrumental mass
        Date                                                 measured        2σ    error                          2σ   error
                            material          analyses                                       fractionation
                                                             (‰V-CDT)        (‰V-CDT)                             (‰V-CDT)

        12/11/2019                            5              0.94            0.02            –1.227               0.34
                            Sierra Pyrite
        12/13/2019                            5              0.92            0.02            –1.252               0.28

185    Table 2: Data for Sierra Pyrite reference material.

       3.6 In situ U-Pb geochronology

       Uranium and leadPb isotopic compositions were measured for 4 fluorite samples showing fluorite overgrowth
       (Flog): (1) PPVi2 (n = 16), (2) PPVi5 (n = 20), (3) PP1802 (n = 30) and (4) PP15 (n=26), using a 193 nm excimer laser
190 (Teledyne, Photon Machines) coupled to a Thermo ScientificTM Sector Field Inductively Coupled Plasma Mass Spectrometer
       (SF-ICP-MS) ELEMENT XR (ThermoFisher Scientific, Waltham, USA) at the Geosciences laboratory (GEOPS) of the
       University Paris-Saclay.

       The overall analytical procedure is derived from LA-ICP-MS U-Pb geochronology of carbonates (Roberts et al.,
       2020), developed at the University of Paris-Saclay for calcite (Brigaud et al., 2020) - see Table A41 of Appendix A for
195 analytical details. The main difference concerns the laser energy needed to ablate fluorite. Indeed, a fluence of 6 J.cm-2 was
       required to ablate our natural fluorite crystals. To properly correct for downhole fractionation (DF) and other sources of laser-
       induced elemental fractionation (LIEF) on the measured 206Pb/238U ratios, a fluorite primary reference material (RM) should
       be used. However, such a fluorite RM does not exist yet. Thus, similarly to Piccione et al., (2019), we used a calcite RM, the
       Permian Reef Complex Walnut Canyon WC-1 (Roberts et al., 2017) as the primary reference material. We highlight that our
200 fluorite U-Pb ages are thus not corrected for matrix-related elemental fractionation. To evaluate the accuracy of our U-Pb ages,
       we included the analysis of a fluorite sample independently dated by (U–Th–Sm)/He thermochronology (Wolff et al., 2016).
       It corresponds to a sodium-and Rare Earth Element (REE)-rich green fluorite from the Horni Krupka deposit in Czech
       Republic (named “HK13”) that has been dated by Wolff et al., (2016) at 290 ± 10 Ma.

       The laser beam diameter for fluorite unknowns was 85 μm. Fluorite crystals were ablated at a repetition rate of 10 Hz and a
205 fluence of 6.25 J.cm-2. Calcite reference materials, including WC-1 primary standard and two secondary standards that are
       detailed below, were ablated at a repetition rate of 8 Hz and a fluence of 1 J.cm-2, and a beam diameter of 150 µm. Glass
       reference materials NIST612 (37.38 ppm U and 38.57 ppm Pb) and NIST614 (0.823 ppm U and 2.32 ppm Pb, Jochum et al.,
       (2011)) were ablated at a repetition rate of 10 Hz, a fluence of 6.25 J.cm-2 and a beam size of 40 μm for NIST612 and
       110 μm for NIST614.

                                                                      10
210 Each analysis consists of 30 s background acquisition followed by 30 s of sample ablation and 30 s washout. Prior to analysis,
each spot was pre-ablated for 7 s at a frequency of 10 Hz and with a fluence of 6.25 J.cm-2 for reference material (NIST) and
fluorite samples, and at a frequency of 8 Hz and with a fluence of 1 J.cm-2 for calcite reference materials. These pre-ablations
are over an area larger than the beam diameter to clean the surface (155 μm for calcite, and50 μm for NIST612, 110 μm for
fluorite and 135 μm for NIST614) and remove potential surficial Pb contamination. The laser-induced aerosol was carried by
215 helium (He: lage volume at 0. 5 l.min-1 and inner cup at 0. 375 l.min-1) from the sample cell to a mixing funnel in which the
sample and He are mixed with 0.950 to 1 l.min-1 argon to stabilize the aerosol input to the plasma. Signal strength of the ICP-
MS was tuned for maximum sensitivity while keeping Th/U at 1.02 and ThO/Th below 0.3% on NIST612.
Isotopes 206Pb, 207Pb, 208Pb, 232Th andet 238U were acquired with integration times per peak (ms) of 10 ms for 208Pb, 232Th, 238U,
of 30 ms for 206Pb and of 40 ms for 207Pb by 70 runs.
220 We used NIST614 to correct for 207Pb/206Pb fractionation (Jochum et al., 2011). For mass-bias correction of the
measured 238U/206Pb ratios, we used the WC-1 calcite reference material (Roberts et al., 2017). Two secondary calcite reference
materials were analyzed during the analytical sessions: Duff Brown Tank (DBT), dated at 64.0±0.7 Ma by U-Pb isotope
dilution – ICP-MS (Hill et al., 2016), and AUG-B6, a calcite breccia dated by LA-ICP-MS U-Pb at 42.99±1 Ma (Pagel et al.,
2018). Internal secondary reference calcite AUG-B6 comes from the Gondrecourt graben (Eastern Paris Basin), part of the
225 European Cenozoic Rift System and has been routinely analyzed for two years at GEOPS (University Paris-Saclay).
Measurements have been made by sequences starting with 6 reference material analyses (2 NIST612, 2 NIST614 and 2 WC-
1), then a repetition of 10 spots on unknown fluorite followed by 8 reference material analyses (2 NIST614, 2 WC-1, 2 DBT
and 2 AUG-B6), 10 spots on unknown fluorite, etc., and ending with 6 reference material analyses (2 NIST612, 2 NIST614
and 2 WC-1). Data was acquired in fully automated mode overnight in two sequences of 336 analyses during about 12 hours
230 of analysis the 19 and 20 December 2019.
Data was reduced in Iolite© using the NIST614 glass as the primary reference material to correct for baseline, for Pb isotope
mass bias and for 206Pb/238U instrumental drift over the sequence time (Lawson et al., 2018; Paton et al., 2011). No down-hole
fractionation correction is applied in Iolite© (Nuriel et al., 2017). The two-sigma errors in 207Pb/206Pb and 206Pb/238U ratios
measured on NIST614 during the analytical session were propagated to the final age uncertainty of fluorite samples by
235 quadratic addition. During the first session, NIST 614 two sigma error on 207Pb/206Pb was 0.31 % and 1.10 % for 206Pb/238U
and for the second session the two-sigma errors on 207Pb/206Pb and 238U/206Pb were 2.20% and 0.69% respectively. A signal
peak of 206Pb, 207Pb or 238U can occur due to unstable ablation conditions, causing an unusually high 206Pb/238U or 207Pb/206Pb
standard error (2 σ), typically greater than 20 %. In Figure A1, we document four examples of LA-ICP-MS intensity signals
during fluorite ablation together with the corresponding 3D surface images of laser craters acquired by optical
240 profilometry. Thirty-five spots, having 2 σ errors greater than 20 %, were excluded (5 on PPVi5, 7 on PPVi2, 15 on PP1802
and 8 on PP15). Each reduced piece of data is plotted in a 238U/206Pb versus 207Pb/206Pb Tera-Wasserburg graph
using IsoplotR (Vermeesch, 2018). An isochron is drawn and the isochron age is deduced by the intersection on the concordia.
11For each sequence, the age and uncertainty of WC-1 reference calcite, following normalization using NIST614 glass, was
calculated without further normalization using a Tera-Wasserburg intercept age. Following the analytic run, we applied a linear
245 correction factor to correct the 206Pb/238U so that the primary WC-1 yields the correct intercept age (i.e., 254.4 ±6.4 Ma, Roberts
et al., 2017). For the first session, we obtained 167.0 ±3.7 Ma for WC-1 with 23 analyses, hence we applied a linear correction
factor of 0.656 to correct all 206Pb/238U ratios of secondary calcite reference materials and fluorite unknowns. For the second
analytical session, WC-1 was dated at 148.0 ±2.3 Ma with 39 analyses. Then, the linear correction factor on the 206Pb/238U
ratio was 0.582. We fixed the 207Pb/206Pb ratio at 0.85 for the common Pb based on Stacey and Kramers, (1975), when we
250 calculated the Tera-Wasserburg intercept age on WC-1 (see (Roberts et al., 2017)). Regarding unknown fluorite samples, Tera-
Wasserburg intercept ages are calculated by plotting each spot from a single sample and by applying the linear correction
factor found on WC-1 for the corresponding session to correct the 206Pb/238U ratios. An age is then calculated without fixing the
initial 207Pb/206Pb value. Error ellipses of each spots and the error on the Tera-Wasserburg intercept age are 2σ. In each Tera-
Wasserburg graph, a first age uncertainty is given that does not include uncertainty propagations (except uncertainties related
255 to the decay constants of 235U and 238U). A second age uncertainty in square brackets is given, by propagating the systematic
uncertainty of primary reference material WC-1 age (2.6 %, Roberts et al., 2017) and the two-sigma error of the 207Pb/206Pb
and 206Pb/238U of the analytical session by quadratic addition. Calculated ages for calcite secondary reference materials
analyzed during the two sequences were 40.7±1.6 Ma and 44.4±2.0 Ma for AUG-B6 and 63.7±2.2 Ma and 64.6±2.9 Ma for
DBT, without fixing the initial 207Pb/206Pb ratio. These ages are identical within analytical uncertainty to the ages published
260 for these two calcites (Pagel et al., 2018; Hill et al., 2016, respectively). “HK13” fluorite was dated at 285.9 ± 29.3 [30.9] Ma
(Fig. A1 in Appendix A. Even though the isochron is less well defined, this U-Pb age matches the (U-Th-Sm)/He age obtained
by Wolff et al., (2016) at 290 ± 10 Ma.
Tera-Wasserburg diagrams of primary and secondary calcite reference materials and metadata for LA-ICP-MS U-Pb ages of
fluorite can be found in Fig.. A21 and A3 and Table A41 of Appendix A.
265 4 Results
4.1 Petrographic observations
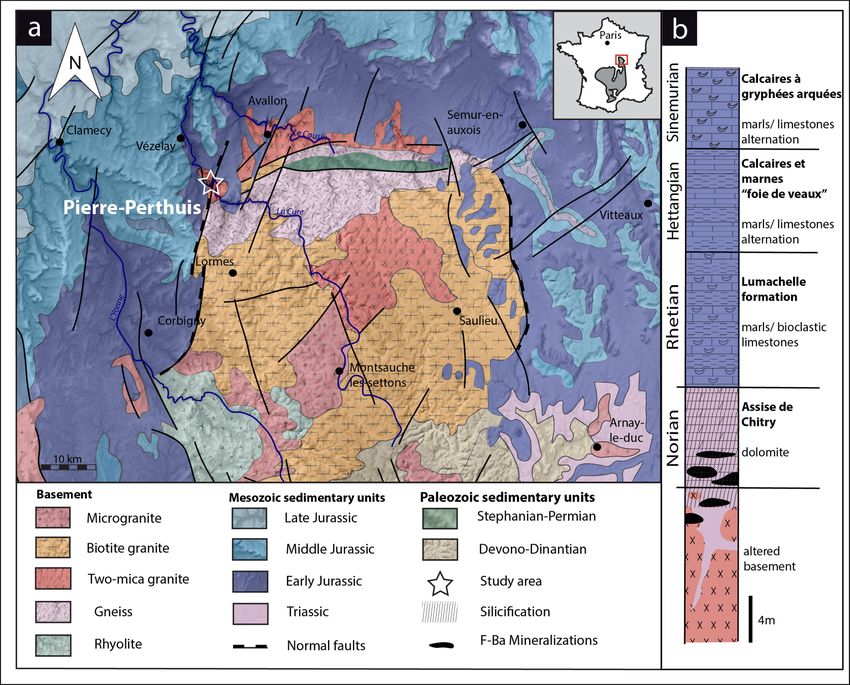
Three fluorite generations are described below and illustrated in Fig.ure 3a.
The first fluorite stage is composed of 50 µm up to a millimeter-large white cubes disseminated in the altered granite and
mainly in the Assise de Chitry Fm, named euhedral fluorite Fleuh (Gigoux et al., 2016). These crystals may sometimes form
270 centimeter-sized patchesaggregates (Fig.ure 3a).
The second stage fills pluri-centimetric to pluri-decimetric-large geodic cavities or centimetric veinlets. This geodic fluorite
(Flgeo) forms millimetric to centimetric well-developed white and yellow/honey translucent cubes which are more or less
12interlinked (Fig.ure 3b). These crystals are fractured and contain many fluid inclusions (Fig.ure 3c). Under
cathodoluminescence, Flgeo displays a light-blue luminescent core (Figure 3d).
275 Geodic fluorites (Flgeo) sometimes display one or several overgrowths (Flog). It appears under cathodoluminescence as a dark-
blue band at the extremity of the geodic crystals, with a thickness varying from 50 to 500 µm (Figure 3e). These overgrowths
form the third and last stage of fluorite. They appear translucent in transmitted plane polarized light and do not contain any
fluid inclusions (see Fig. 3c and Fig. A42 of Appendix A). From the center to the border, two growth phases have been noted
(1) a translucent fluorite initiated by one or several purple rims (Flog1) (2) a second growth stage of fluorite with a laminar
280 texture (Flog2), delineated by a fringe of well-aligned small globular pyrite crystals of about 30µm (Fig.ure 3e and 3f). These
pyrite crystals are rarely oxidized along fractures (Fig.ure 3de).
Fission track mapping carried out on Flgeo and Flog1&2 shows that Flgeo and Flog1 are almost devoid of tracks, while a high
track density is observed in Flog2 (Fig. 3g and 3h). Significant Uuranium content is thus only detected and measured only in
Flog2, with U concentration varying from 45 to 508 ppm according to the track counting zones with an average from 79 to
285 2630 ppm per sample (see Table A2 of Appendix A for details).
1314
Figure 3: Photographs of the fluorite stages from the Pierre-Perthuis ore. (a) Geode in the altered granite with milky white cubic
      crystals (Flgeo) and the translucent fluorite overgrowth (Flog) delimited by a thin purple band. The euhedral fluorite (Fleuh) forms
290   patches in the Avallon granite, from Gigoux et al., 2015 , (b) Centimetric cubes of Flgeo, (c) Transmitted light microscopy photography
      of Flgeo and the overgrowth corresponding to Flog, (d) Cathodoluminescence image of Flgeo and Flog, (e) Photography of the limit
      between Flgeo and Flog with a pyrite crystal affected by a fracture and oxidized, (ef) Transmitted light Pmicrophotography of a geodic
      fluorite crystal in transmitted light with the two stages constituting Flog (1) a translucent fluorite initiated by one or several purple
      rims: Flog1; (2) a final growth stage of laminar fibrous fluorite with pyrite inclusions: Flog2, (f) Microphotograph in transmitted light
295   focused on Flog2 showing a laminar texture (g) Photography in transmitted light of an irradiated crystal of Flgeo + Flog, (h)
      Corresponding interpreted map of the induced fission tracks distribution in a crystal illustrated in (g) with a zooming on the
      muscovite detector.

                                                                         15
4.2 Sulfur stable isotope composition
300 SIMS analyses were carried out for two fluorite crystals containing pyrite inclusions in their rims (Fig. 4). Five pyrite
crystals in PP18S3 sample have δ34S values varying from –23.1 to –24.9 ‰V-CDT. The sulfur isotopic ratio of pyrite from
PP18S7 sample varies from –19.9 to –24.7 ‰V-CDT. The mean of δ34S values for PP18S3 and PP18S7 are –24.2 and –23.6 ‰V-
CDT, respectively. Two-sigma uncertainty is below 0.4 ‰V-CDT.
305 Figure 4: Location of SIMS spots foranalyses and the δ34S measurements presented in ‰V-CDT for (a) sample PP18S3 and (b) sample
PP18S7. Micro-photographs in upper half are in transmitted plane polarized light for the entire sample (upper left) and
microphotographs in the bottom are gold metallized zoomed areas in reflected plane polarized light on gold metallized zoomed areas.
4.3 SR-XRF mapping
310 We studied in detail twoa samples that contains the last two generations of fluorite (Flgeo and Flog described above) to
investigate geochemical heterogeneities. PP18S7 shows several pyrite crystals at various depths while PP18S15 shows a single
pyrite at the surface of the sample (Fig. 5a and 5b respectively). Synchrotron radiation XRF mapping of a
transect from Flgeo toand Flog2 shows areas of lower concentration of Ca within the Flog2 exclusively (Fig. 5b), and higher
concentrations of substituted elements such as Zr, Y, Sr, U, Th and Pb (Fig. 5a). Lead is present both into pyrite crystals (Fig.
315 5a) and in Flog2 (Fig. 6).
1617
Figure 5: Transmitted plane polarized light microphotographsy from PP18S15 and corresponding sSynchrotron radiation X-ray
320   fluorescence elemental maps through a transect from the core crystal of Flgeo to the Flog rim from, a. ) sample PP18S7 and b)
      PP18S15. Black areas indicate concentration below the limit of detection of the element. GA globular pyrite crystals areis included
      in Flog2.

      Other maps have been generated with a focus on the transition between Flog1 and Flog2 (Fig. 6), highlighted as distinct by
325 petrographic observations and fission track mapping (Fig. 3f and 3h). This map reveals elemental substitution and uranium
      incorporation. At this scale, SR-XRF mapping shows enrichment in Fe, Th, Sr, Pb, Y and U in Flog2. Th and Pb maps are
      highly correlated and show three growth bands anti-correlated with Y.Lead was detected by SR-XRF mapping, and its spatial
      distribution in Flog2 is correlated with thorium (Fig. 6) but not with uranium (Fig. A5).

                                                                      18
330
Figure 6: SR-XRF imaging of the transition between Flog1 and Flog2 in PP18S15 showing the distribution of Fe, Th, Sr, Pb, Y and U
contents. Map dimensions are 261µm x 122µm.
A focus on a pyrite crystal in Flog2 reveals concentric zonation in Cu, As and Ni concentrations (Fig. 7).
335 Figure 79: Copper, arsenic and nickel distribution maps of a pyrite included in Flog2. Maps dimensions are 52 µm x 76 µm.
4.4 Laser ablation U-Pb geochronology
Uranium and lead isotopic compositions are plotted in Tera-Wasserburg graphs (238U/206Pb vs 207Pb/206Pb) in Figure 7.
Four isochrons have beenwere calculated, with a common initial 207Pb/206Pb composition ranging from 0.815 to 0.840 (Tera-
340 Wasserburg graphs were generated without anchoring the upper intercept of the discordia line to a given 207
Pb/206Pb
composition). Outer rims of geodic fluorite crystals from Pierre-Perthuis yield an age of 38.7 ± 1.5 [1.8] Ma with 9 analyses
and a MSWD of 0.68 (Fig. 87a) for PPVi2, 41.1 ± 1.8 [2.2] Ma (MSWD = 1 and n=15) for PPVi5 (Fig. 87b), 40.8 ± 3.0 [3.4]
19Ma for PP1802 with 11 analyses and a MSWD = 0.6 (Fig. 87c) and PP15 of 41.8 ± 2.4 [2.8] Ma (MSWD=1.5 and n=22, )
(Figure 87d). As these ages are identical within analytical uncertainties, all data from the different crystals but corresponding to
345 the same generation according to petrography, were then plotted in a single graph (Fig. 87e), giving an age of 40.0 ± 0.9 [1.7]
Ma (MSWD=1.2). Because U/Pb ratios are is variable in the samples, data is well distributed in the Tera-Wasserburg space,
and the isochron is rather well constrained despite the somehow large uncertainty of single analytical spots.
To evaluate the accuracy of fluorite LA-ICP-MS U-Pb dating in the absence of calibration against a fluorite primary RM, we
tested the HK13 fluorite, a sample independently dated at 290 ± 10 Ma by (U–Th–Sm)/He thermochronology (Wolff et al.,
350 2016). Although we found an age of 285.9 ± 30.9 Ma (Fig. A31 of Appendix A), interpretation of results is somehow limited
by a poor data spread in a Tera-Wasserburg diagram and by rather large uncertainties regarding single analytical spots related
to unstable ablation rates.
20Figure 87: Tera-Wasserburg diagram (207Pb/206Pb vs. 238U/206Pb) for fluorite. (a,b,c and d) U-Pb ages of the four fluorite overgrowth
355 (Flog2)samples. (e) Isochron obtained from the compilation of all data illustrated in a,b,c and d. “n” is the number of analytical spots
for each sample.
215 Discussion
5.1 Uranium and lead incorporation in fluorite
The fluorite overgrowths are composed of two distinct layers: (1) Flog1, without significant integration of U in the fluorite
360 lattice and that is devoid of U and (2) Flog2, in which U was effectively incorporated within the crystal and correlated with
precipitation of pyrite. Flog2 appears colorless with an internal fibrous texture. We did nNot observe any pleochroic halos were
observedlike (Dill and Weber, (2010)) have documented in fluorite around actinide-rich inclusions. Fission track mapping
instead shows a homogeneous incorporation of U (Fig. 3g and 3h). On a smaller scale, SR-XRF reveals micrometer-scale
fluctuations in uranium concentrations along the growth directions, correlated with the incorporation of other substituted
365 elements such as Sr and Zr (Fig. 58). The incorporation of Zr in the fluorite lattice, together with U, may reflect a contribution
from the leaching of volcanic glasses. Indeed, correlations between uranium and zirconium concentrations have been
documented in various U deposits spatially associated to volcanic rocks or volcanic fragments reworked in sandstones and
conglomerates (Forbes et al., 1984; Cinelu and Cuney, 2006; Pons, 2015). Late Variscan ignimbrites are cropping out ca. 35
km south of Pierre-Perthuis (Carpena et al., 1984).
370
22Figure 8: Synchrotron-based XRF elemental maps showing distribution of Zr, Y, Sr, Th, U and Pb through a transect from the core
crystal of Flgeo to the Flog rim of PP18S7. Color bars indicate intensity scale (black indicates concentrations below the detection
limit). Higher intensities correspond to higher metal contents. Map dimensions are 179µm x 1mm.
375 The transition between Flog1 and Flog2 maycan be explained by the development of a redox front, causing uranium
incorporation in the crystal lattice. the reduction of U(VI) into U(IV). Theoretically, fluorite can incorporate U(IV) as UO2 and
U(VI) as CaUO4 (Kröger, 1948; Recker, 1961). Recently, reported hexavalent uranium in fluorite from the Round Top Mountain
in Texas (USA). In Pierre-Perthuis, tThe presence of numerous pyrite crystals in Flog2, similar to those reported by Dill and
Weber (2010), characterizes a reducing environment that has probably initiated the precipitation of U. As an analogy, it can
380 be mentioned that pPyrite is common in roll-front uranium deposits (Bonnetti et al., 2015; Cai et al., 2007; Campbell et al.,
2012; Ingham et al., 2014). Globular pyrites, similar to those observed in Flog2, are usually interpreted as biogenic in origin
(Belyi et al., 1972; Blakeman et al., 2002; Chen et al., 2019; Bonnetti et al., 2020; Cai et al., 2007; Rackley, 1972). This
hypothesis is supported by the sulfur stable isotope composition of the pyrites included in Flog2 (mean δ34S = –23.6 ‰V-CDT).
The homogeneous δ34S of these pyrites indicates a large amount of sulfate available for reduction by bacteria in an open system
385 (Hough et al., 2019; Magnall et al., 2016). Concentric incorporation of Ni, As, and Cu (Fig. 7) were reported both in biogenic
(Baumgartner et al., 2020) and abiogenic pyrite (Wu et al., 2019). Pyrite crystals in Flog2 show such concentric zonation
(Figure 9).(Barbarand et al., (2013)) show that the basement of the southeastern Paris Basin was subjected to temperatures less
than 60 °C during the Eocene period. This temperature estimate is compatible with bacterial activity.
390 Figure 9: Copper, arsenic and nickel distribution maps of a pyrite included in Flog2. Maps dimensions are 52 µm x 76 µm.
Hence, we propose that uranium incorporation in Flog2 is related to bacterial sulphate reduction (BSR, (Fig.ure 910). The
solubility of uranium was enhanced by F-bearing solutions (Xing et al., 2019) that leached the granitic basement through the
fracture network (Fig.ure 910 a). When reaching the unconformity between the basement and the sedimentary cover, a local
23395 redox front generated by BSR causes U to precipitate (Fig. 9d). BSR produces sulfur species reacting with iron oxyhydroxides
or dissolved iron to form iron disulphides (Fig. 9e; Bonnetti et al., 2017; Machel, 2001). These sulfur species are electron
donors that can reduce U(VI) to insoluble U(IV), thus causing uranium precipitation (Bonnetti et al., 2015; Campbell et al., 2012;
Yi et al., 2007). Alternatively, direct microbial reduction of U could also have occurred (Bhattacharyya et al., 2017; Lovley et
al., 1991). The incorporation of U, together with other metals elements (Fig.ure 5 and 6), may have been enhanced through
400 their adsorption by bacterial bio-films developed at the surface of fluorite crystals (Fig. 9f). Indeed, the collomorphic fibrous
texture of the external overgrowth Flog2 in the Pierre-Perthuis crystals (Fig.ure 3f, 4b lower right, 6 lower left and Fig. A4)
could result from the development of bio-films in pore/geode linings. Although the secretion of extracellular polymeric
substances leading to the formation of bacterial bio-films on pyrite has been extensively documented, their development at the
surface of fluorite crystals remains largely unexplored, apart from Heim et al., (2012) who reported tubular structures within
405 fluorite filling fractures in the Äspö diorite in Sweden, interpreted as fossilized microbial bio-films.
24Figure 910: Conceptual model of uranium incorporation in the fluorite lattice. a) Uranium is leached by F-rich oxidizing
410 solutions flowing through the granitic basement and reaching Flgeo in the basement/cover interface, b) formation of purple layers on
the fluorite surface by F-bearing fluids, c) Crystallization of Flog1, d) aA local redox front is generated by BSR, e) sulfur species react
with iron oxyhydroxides or dissolved Fe to form pyrite, f) reduced uranium is incorporated in Flog2.
25The development of purple colorations in fluorite has long been recognized to be related to the vicinity of uranium-bearing
415 minerals (Chatagnon et al., 1982; Pi et al., 2007). Bill and Calas (1978) proposed that the incorporation of Eu2+, together with
metallic calcium colloids formed by long-time irradiation, can cause purple colorations. Chatagnon et al., (1982) and later
Kempe et al. (2002) show that such colorations have rather been caused by the reduction and stabilization of Tm and Ho in
the divalent state under irradiation by the radioactive decay series of U. SR-XRF mapping focused on small well-defined purple
growth bands (Fig.ure 101) shows enrichment in U and Th. As the thickness of these bands is sometimes less than 10 µm, we
420 suggest that the coloration was acquired through gamma irradiation, instead of α-irradiation, which would have caused larger
bandsBecause the width of such bands is sometimes less than 10 µm, we have discarded the hypothesis of a coloration acquired
through internal alpha irradiation (Dill and Weber, 2010; Pi et al., 2007; Vochten et al., 1977). Moreover, iIt must be noted
however that such coloration is not developed in the U-bearing Flog2 layer (Fig.ure 56 and 68). Thus, the origin of the purple
coloration in the fluorite crystals of Pierre-Perthuis is still not fully understood and would require further investigation. We
425 rather suggest that coloration was acquired through external gamma irradiation. In the following section, we will further discuss
the spatial distribution and retention of U and Pb and the reliability of the U-Pb geochronometer in fluorite.
26430 Figure 101: Transmitted plane polarized light photography from PP18S7 and corresponding Synchrotron X-ray
fluorescence elemental maps. Area of XRF scan is outlined by a red box on the photography. Map dimensions are 80 x 80 µm.
Lead was detected by SR-XRF mapping, and its distribution in Flog2 seems to be correlated with Th (Figure 6 and 11). During
the co-precipitation of pyrite and Flog2, lead was preferentially incorporated into pyrite crystals (Figure 8).
27435 In the following section, we will further discuss the spatial distribution and retention of U and Pb and the reliability of the U-
Pb geochronometer in fluorite.
5.2 Fluorite U-Pb geochronology
5.2.1 Retention of U in fluorite
To test the reliability of U-Pb dating in the fluorite rims of Pierre-Perthuis, wWe further discuss potential alterations of the U-
440 Pb geochronometer by (1) the development of fractures and cleavages; (2) dissolution and re-crystallization; (3) solid-state
diffusion.
(1) Fractures and cleavages
Fluorite is well known to develop cleavages and fractures. Although cleavages are abundant in the core of the crystals (Flgeo),
they are rare on the rims (Fig.ure 3c). Scarce fractures crosscutting Flog2 were observed, causing the oxidation of pyrite (Fig.ure
445 3e). Adjacent pyrite crystals being unaffected, these fractures only generated local alterations, and were consequently avoided
in LA-ICP-MS analyses (Fig.ure 3de).
(2) Dissolution and -re-crystallization
Dissolution and re-precipitation of fluorite in hydrothermal deposits is common (Burisch et al., 2017). In Pierre-Perthuis, some
crystals show irregular extremities surfaces demonstrating that a late fluid event was able to slightly dissolve fluorite. These
450 corroded crystals were not selected for LA-ICP-MS analyses. In the other crystals, the preservation of pyrite crystals, the
internal fibrous texture of fluorite and the perfect geometric relationship between Flgeo and Flog (Fig.ure 3d and 3ef)
demonstrate that Flog2 was not dissolved and re-crystallized.
(3) Solid-state diffusion
Cherniak et al., (2001) determined the diffusion rates of Sr, Y, and REE in natural fluorite and concluded that no significant
455 diffusion (< 100 µm) should occur at temperatures below 500 °C. Bosze and Rakovan, (2002), however, document diffuse
boundaries between REE sectoral zoning in fluorite, interpreted as resulting from the diffusion of these elements over an area
distance of 200-300 µm. In Pierre-Perthuis, the preservation of ca. 10 µm thick violet bands with sharp terminations
demonstrates the absence of significant REE diffusion (Kempe et al., 2002). SR-XRF mapping also shows the preservation
of Sr, Y, Th, Pb and U-rich bands of a thickness of ca. 10µm (Fig.ure 6), evidencing the absence of solid-state diffusion of
460 these elements in our samples. Although the crystallization temperature of Flog2 is unknown due to the absence of fluid
inclusions, a maximum temperature of 100 °C is speculated based (1) on the fluid inclusion homogenization temperature
ranging from 80 to 100°C for Flgeo at Pierre-Perthuis (Gigoux et al., 2016), (2) δ34S values of pyrite suggesting on evidence
of BSR and (3) on the fact that the paleotemperatures reached by the Assise de Chitry Fm in the area were low during the
Cenozoic period (Barbarand et al., 2013; Gigoux et al., 2016). We thus conclude that U and Pb did not diffuse within Flog2.
28465 5.2.2 In situ LA-ICP-MS U-Pb dating
Uranium concentration in fluorite is highly variable (Piccione et al., 2019; Walter et al., 2018; Wolff et al., 2016), and is often
insufficient for U-Pb dating (Piccione et al., 2019). In the Pierre-Perthuis fluorite ore, the geodic fluorite Flgeo, dated at 130 ±
15 Ma by Sm-Nd (Gigoux et al., 2015), could not have been tested for U-Pb geochronology because it contains no U. Likewise,
Flog1 is not amenable to U-Pb dating. The first fluorite generation, Fleuh, precipitated from during the dissolution of the host
470 dolomite rock, and therefore contains too many carbonate impurities that cannot be excluded from sampling in LA-ICP-MS.
Compared to U-Pb geochronology of other common lead-bearing minerals such as calcite (e.g., Roberts et al., 2020), fluorite
U-Pb geochronology presents some additional analytical challenges. Laser induced damages in fluorite have beenwere
extensively studied (De Bonis et al., 2014; Jia et al., 2005; Rafique et al., 2012; Reichling et al., 1994). Due to thermal stress
and shock waves, large fractures and the ejection of solid fragments commonly occur during the first laser shots (Gogoll et al.,
475 1996; Johansen et al., 1995). A 7s pre-ablation, excluded from data used for U-Pb age calculation, helps in getting more stable
ablation rates.
Ablation quality depends on numerous factors including laser parameters (wavelength, fluence and repetition rate) and
intrinsic crystallographic features like orientation, chemical impurities, fluid inclusions or defects (Gogoll et al.,
1996). Therefore, ablation rate and quality may largely vary from one natural fluorite crystal to another.
480 Variations in ablation rates (crater depth/crater diameter) may generate variable downhole fractionations (DF). To minimize
DF, a low laser fluence (typically 1J.cm-2) and a large diameter are generally preferred (Mangenot et al., 2018). However, a
fluence of at least 6J.cm-2 was required to ablate Flog2. SEM Optical profilometry observations measurements of ablation pits
in Flog2 reveal variable laser crater aspect ratios (see Fig.. A13 of Appendix A for spots illustration and measured crater depths
by optical profilometry). The total crater depths, including the material excluded for analysis during the 7s “pre-ablation” vary
485 from 10397 to 14553 µm in Pierre-Perthuis fluorite samples and from 231 to 266is ca. 210 µm for the HK13 fluorite (see Table
A53 of Appendix A). To correct for DF, a matrix-match primary RM can be used if laser ablation
generates similar crater aspect ratios between the reference material and unknown samples (Elisha et al., 2020; Guillong et al.,
2020). Such a matrix-match RM is not yet available for fluorite U-Pb geochronology (Piccione et al., 2019). However, even
with the use of such a RM, DF correction may turn out to be incorrect because of variable crater aspect ratios in
490 fluorite. Further research is needed to improve the precision and accuracy of fluorite U-Pb geochronology, through the
systematic comparison of LA-ICP-MS crater aspect ratios in fluorite samples of known ages. In addition to DF, other sources
of elemental fractionation should also be investigated, such as the influence of the chemical composition of the aerosol
(Sylvester, 2008). Piccione et al. (2019) reported comparable U-Pb ages acquired on fluorite and associated nacrite, suggesting
that this effect may not introduce a significant bias.
29495 5.3 U-Pb age significance and wider considerations regarding radiometric dating of ore deposits
In the absence of elemental fractionation correction against a fluorite RM, the age of the last generation of fluorite in Pierre-
Perthuis ore (Flog2), 40.0 ± 1.7 Ma, may be over- or underestimated. Considering an age offset of 20% as an extreme case
(Guillong et al., 2020), this age estimate still significantly differs from the Sm-Nd age of 130 ± 15 Ma (Gigoux et al., 2015) of
the prior geodic fluorite crystals Flgeo.
500 5.3.1 Regional significance
Bergerat, (1984) proposed an N-S compressive stress field during the Eocene through micro-structural analysis in the studied
area, interpreted as the consequence of the Pyrenean compression. Evidence of late Eocene fragile brittle deformation and
associated fluid flows are also found in the eastern Paris basin, ca. 150 km north-east of Pierre-Perthuis, where calcite
cementing hydraulic breccia were dated at 43 ± 1 Ma (Brigaud et al., 2020; Pagel et al., 2018). Volcanic activity in the northern
505 part of the French Massif Central has been reported by Bellon et al., (1974) and Lefort and Agarwal, (2002) during this period,
at about 80-120km south-east of the study area. In conclusion, a local compressive stress field related to the propagation of N-
S Pyrenean compression in the intraplate domain may have generated fluid flows and the crystallization of Flog2.
5.3.2 Wider considerations regarding radiometric dating of ore deposits
In Pierre-Perthuis, the geodic fluorite crystals Flgeo yield a Sm-Nd age of 130 ± 15 Ma (Gigoux et al., 2015). Here, we show
510 that later fluid flows took place during the Cenozoic period, recorded as rims overlaying Flgeo. Hence, successive mineralizing
fluids occur during a time period of ca. 90 Maat least two mineralizing events occur during a time period of ca. 90 Ma.
In some ore deposits, fluorite Sm-Nd dating is the only available geochronometer. However, errorchrons and imprecise ages
may occur. In such cases, U-Pb geochronology of common lead-bearing authigenicgeochronology of authigenic phases with
elevated common Pb such as calcite (Rasbury and Cole, 2009), hematite (Walter et al., 2018), chalcedony (Nuriel et al., 2011)
515 or nacrite (Piccione et al., 2019) offers new perspectives to gain knowledge on the successive chronology of mineralizing fluid
flows. In Pierre-Perthuis however, as in some other F-Ba deposits, these minerals are absent. A late Eocene age estimate for
the last fluorite-mineralizing event reveals that the “lifetime” of the ore deposit was much longer than previously thought ore-
formation is polygenic. Fluorite was deposited during several successive fluid flows induced by the reactivation of faults
affecting the granitic basement. Small-scale radiometric dating of single growth bands in authigenic phases makes it possible
520 to determine the chronology of these multiple crystallization events. Future research should be conducted to test the U-Pb
geochronometer in fluorite crystals dated by Sm-Nd or other direct ((U–Th–Sm)/He) or indirect methods.
6 Conclusion
We have explored the U-Pb geochronometer in fluorite. In the Pierre-Perthuis F-Ba deposit, uranium was found in the most
external rim of fluorite crystals. SR-XRF mapping demonstrates the preservation and retention of micrometer-thick zonation
30525 in uranium concentration in fluorite. Petrographic observations coupled to induced fission tracks and SR-XRF mapping show
that uranium is incorporated in the fluorite crystal lattice by elemental substitution. The incorporation of uranium is related to
bacterial sulphate reduction, evidenced by globular pyrite inclusions. Relying on careful and detailed petrography, we show
that such growth bands can be dated by U-Pb geochronology. The spread of U and Pb isotopic compositions in a Tera-
Wasserburg space are interpreted as isochrons,Tera-Wasserburg lower intercept yieldsing an age of 40.0 ± 1.7 Ma, not
530 corrected for matrix-related elemental fractionation. This age estimate corresponds to the last minor fluorite-mineralizing
event. Since the crystal cores were previously dated at 130 ± 15 Ma by Sm-Nd, at least two successive episodic fluid flows
238
occurred during ca. 90 Ma. Future research should be conducted to correct for U/206Pb fractionation during LA-ICP-MS
analysis in fluorite through the definition of a fluorite reference material.
535 Appendix A
Uranium concentration measured by counted fission tracks
The range of latent track lengths of fission particles depending on the density of materials, the correction factor between two
matrixes is given by Enkelmann et al., 2005. The latent fission-track lengths corresponding to the combined ranges of the light
540 (Lt) and heavy (Hv) nuclide ejected in opposite directions from the fission of 235
U after capture of a thermal neutron
®
(Jonckheere, 2003) have been simulated by SRIM software (Ziegler et al., 2010). The numerical values for mass and energy
of these nuclides are taken from Kahn et Forgue (1967), glass standard reference CN5 density from De Corte et al., 1998 and
all data and simulations results are summarized in Table A1.
(a) Projectiles Z MA (amu) E0 (MeV)
Hv (Xe) 54 138.1 69.6
Lt (Sr) 38 95.34 100.1
(b) Matrices Formula d (g.cm3)
Glass CN5 SiO2 2.45
Fluorite CaF2 3.18
(c) Simulations Range Hv (µm) Range Lt (µm) [2R] (µm)
31You can also read