Usability, Acceptability, and Satisfaction of a Wearable Activity Tracker in Older Adults: Observational Study in a Real-Life Context in Northern ...
←
→
Page content transcription
If your browser does not render page correctly, please read the page content below
JOURNAL OF MEDICAL INTERNET RESEARCH                                                                                                   Domingos et al

     Original Paper

     Usability, Acceptability, and Satisfaction of a Wearable Activity
     Tracker in Older Adults: Observational Study in a Real-Life Context
     in Northern Portugal

     Célia Domingos1,2,3,4, BSc; Patrício Costa1,2,4, PhD; Nadine Correia Santos1,2,4,5*, PhD; José Miguel Pêgo1,2,3,4*, MD,
     PhD
     1
      Life and Health Sciences Research Institute (ICVS), School of Medicine, University of Minho, Braga, Portugal
     2
      ICVS/3B's, PT Government Associate Laboratory, Braga/Guimarães, Portugal
     3
      iCognitus4ALL – IT Solutions, Braga, Portugal
     4
      Clinical Academic Center – 2CA-B, Braga, Portugal
     5
      Associação Centro de Medicina P5, School of Medicine, University of Minho, Braga, Portugal
     *
      these authors contributed equally

     Corresponding Author:
     José Miguel Pêgo, MD, PhD
     Life and Health Sciences Research Institute (ICVS)
     School of Medicine
     University of Minho
     Largo do Paço
     Braga, 4710-057
     Portugal
     Phone: 351 253 604 800
     Email: jmpego@med.uminho.pt

     Abstract
     Background: The use of activity trackers has significantly increased over the last few years. This technology has the potential
     to improve the levels of physical activity and health-related behaviors in older adults. However, despite the potential benefits,
     the rate of adoption remains low among older adults. Therefore, understanding how technology is perceived may potentially offer
     insight to promote its use.
     Objective: This study aimed to (1) assess acceptability, usability, and user satisfaction with the Xiaomi Mi Band 2 in Portuguese
     community-dwelling older adults in a real-world context; (2) explore the mediating effect of the usability on the relationship
     between user characteristics and satisfaction; and (3) examine the moderating effect of user characteristics on the relationship
     between usability and user satisfaction.
     Methods: Older adults used the Xiaomi Mi Band 2 over 15 days. The user experience was evaluated through the Technology
     Acceptance Model 3, System Usability Scale, and User Satisfaction Evaluation Questionnaire. An integrated framework for
     usability and user satisfaction was used to explore user experience. Statistical data analysis included descriptive data analysis,
     reliability analysis, confirmatory factor analysis, and mediation and moderation analyses.
     Results: A sample of 110 older adults with an average age of 68.41 years (SD 3.11) completed the user experience questionnaires.
     Mean user acceptance was very high—perceived ease of use: 6.45 (SD 0.78); perceptions of external control: 6.74 (SD 0.55);
     computer anxiety: 6.85 (SD 0.47); and behavioral intention: 6.60 (SD 0.97). The usability was excellent with an average score
     of 92.70 (SD 10.73), and user satisfaction was classified as a good experience 23.30 (SD 2.40). The mediation analysis confirmed
     the direct positive effect of usability on satisfaction (β=.530; P
JOURNAL OF MEDICAL INTERNET RESEARCH Domingos et al
(J Med Internet Res 2022;24(1):e26652) doi: 10.2196/26652
KEYWORDS
user experience; Technology Acceptance Model; health monitoring; fitness trackers; aging; seniors
technologies. The TAM was adapted from the Theory of
Introduction Reasoned Action [15] and was initially developed by Davis
Background [16]. This model assumes that the perceived ease of use (PEOU)
and perceived usefulness (PU) are the primary factors
Wearable devices are electronic devices that allow users to influencing an individual’s intention to use new technology
automatically track and monitor their physical fitness metrics, [3,12,16]. PEOU refers to the degree to which a person perceives
including number of steps, level of activity, walking distance, how easy it is to use the technology, and PU refers to how using
calories burned, heart rate, and sleep patterns [1-4]. Over the the technology will improve performance [16]. Moreover, PEOU
last few years, these devices have also become increasingly and PU can be influenced by various external factors, including
popular among researchers interested in assessing and both the device and user characteristics [3,16,17]. The usability
intervening on physical activity (PA)–related behaviors in seems to be predictive of acceptance regarding the device
real-world contexts. Wearable devices offer the opportunity to characteristics because they directly relate to the PEOU and PU
collect objective PA data in a less intrusive and inexpensive and may moderate attitudes and behavioral intentions (BIs) to
manner and provide tailored and personalized interventions in use a system [3].
real-time [3,5,6]. In fact, overall, academic and industry research
has shown that their use can increase PA levels and promote a The original TAM was extended to TAM 2 by Venkatesh and
healthier lifestyle through real-time self-monitoring of Davis [18] to explain PU and usage intentions in terms of social
health-related behaviors [3,5,7-10]. However, despite these influence and cognitive instrumental determinants. Later,
potential benefits, older adults still show slow technology Venkatesh and Bala [19] updated the model, including other
adoption rates [10,11], possibly because these technologies are variables affecting PEOU, such as individual differences
mainly developed for a younger target group, without (computer self-efficacy, computer anxiety [CANX], and
considering health psychology or gerontology theories [7]. computer playfulness), perceptions of external control (PEC),
Consequently, older adult users may have usability barriers to and system characteristics–related adjustments (perceived
technology adoption [4,12]. Furthermore, factors associated enjoyment and objective usability).
with normal aging, such as physical and cognitive decline, could System Usability Scale
limit the ability to use the technology [11].
Initially proposed by John Brooke in 1986, the System Usability
A better understanding of older adults’ intentions to use activity Scale (SUS) is the most widely used standardized questionnaire
trackers, and examining actual usage behavior, is becoming to measure perceived usability [8,17,20,21]. Recent literature
increasingly relevant; however, only a few studies have been shows that several studies extend the TAM by incorporating
conducted to determine older adults’ perceptions [7,10,13,14]. the SUS [17,22,23]. Although the SUS has been assumed to be
Therefore, this study aimed to understand the user experience unidimensional, recent research reveals that the SUS has 2
and acceptability of an activity tracker (Xiaomi Mi Band 2), subscales—usability and learnability—with items 4 and 10
throughout daily life activities, in a cohort of providing the learnability dimension and the other 8 items the
community-dwelling older adults. usability dimension [24,25].
Theoretical Framework According to ISO-9241-11 [26], usability refers to the
After carrying out a literature search, 3 major key concepts were effectiveness, efficiency, and user satisfaction rating of a product
identified regarding user experience and technology adoption: in a specific environment by a particular user for a particular
technology acceptance, usability, and user satisfaction. Variables purpose. More precisely, effectiveness refers to which of the
regarding user characteristics were also selected, such as system’s intended goals can be achieved; efficiency is the effort
cognitive function, mood, and education, which may required for a user to achieve the goals; and satisfaction depends
significantly influence user experience to develop our model. on how comfortable the user feels using the system [8,21,27].
Thus, the theoretical framework was designed to explore older Therefore, usability is a critical factor that directly affects the
adults’ user experience with the Xiaomi Mi Band 2, by use and adoption of technology by older adults.
combining different theories as next described, while also User Satisfaction Evaluation Questionnaire
enabling the examination of the impact of usability and
individual characteristics on user satisfaction with the The literature on technology acceptance has included many
technology. model variants and extensions, including user satisfaction as a
key indicator of user acceptance [28-34]. Moreover, satisfaction
Technology Acceptance Model has been described as a predictor of behavior intention [29].
Technology acceptance is an important factor in determining The User Satisfaction Evaluation Questionnaire (USEQ) was
the long-term adoption of activity trackers [3]. The Technology initially designed by Gil-Gómez et al [35] to evaluate the
Acceptance Model (TAM) is the most applied theoretical model satisfaction of the users with virtual rehabilitation systems.
for evaluating or predicting users’ acceptance of new Recently, the USEQ was adapted and validated into European
https://www.jmir.org/2022/1/e26652 J Med Internet Res 2022 | vol. 24 | iss. 1 | e26652 | p. 2
(page number not for citation purposes)
XSL• FO
RenderXJOURNAL OF MEDICAL INTERNET RESEARCH Domingos et al
Portuguese by Domingos et al [36] to evaluate an activity tracker Research Framework and Hypotheses
(Xiaomi Mi Band 2) in older adults, showing psychometric This study uses a model based on the SUS to measure usability
properties consistent with the original version. and the USEQ to measure user satisfaction and incorporate
User Characteristics individual characteristics, such as education, mood, and
cognitive performance (Figure 1). The design was founded on
In a theoretical framework developed by Venkatesh and Bala
the basic theory studied to provide a clear causal relationship
[19], individual differences, such as personality and
between the independent variables (exogenous) and the
demographics (eg, traits or individuals’ states, gender, and age),
dependent variables (endogenous). The model has 5 variables
were suggested to influence individuals’ perceptions of PU and
exploring the user experience with the Xiaomi Mi Band 2 in
PEOU. Specifically, personality is related to individual
older adults.
differences in cognitive, emotional, and motivational aspects
of mental states that result in stable behavioral action [37]. The following hypotheses were formulated:
Moreover, personality has been found to affect technology
H1: Usability has a positive effect on satisfaction.
perceptions and acceptance [3,38].
H2: Education has a positive effect on satisfaction.
Additionally, older individuals may show age-related declines,
including attention, memory, and processing speed, which may H3: Education has a positive effect on usability.
further impact how they interact with the technology [3]. The
H4: Cognition has a positive effect on satisfaction.
aging process is also associated with a decline in visual faculties,
that is, visuospatial functioning, visual acuity, color H5: Cognition has a positive effect on usability.
discrimination, and contrast sensitivity, crucial for learning new
H6: Depression has a negative effect on satisfaction.
information and executing technology-based tasks [39]. Thus,
researchers have focused on the impact of cognitive abilities, H7: Depression has a negative effect on usability.
self-efficacy, and technology-related anxiety in technology
Additionally, user characteristics’ potential moderating effect
acceptance [11]. Lastly, compared with younger adults, the
on the direct effect between usability and satisfaction was tested
senior population may be more resistant to adopt new
separately for each variable (Figure 2).
technologies due to cultural factors, education, and experience
[3].
Figure 1. Research hypothesis framework.
Figure 2. Moderating effect of user characteristics.
0.32 [40-42], an α of .05, power of 0.95, and dropout rate of
Methods 23%. The power analysis for this user experience study was
Participants and Research Ethics conducted considering the sample size calculated previously
and a medium effect size [23] confirmed a power of 0.92.
A priori sample size calculation and power analysis were Moreover, the rule of thumb to determine sample size in multiple
performed using G*Power version 3.1.9.3 regression analyses confirmed that the minimum sampling
(Heinrich-Heine-Universität Düsseldorf). Considering that the requirements for the analysis were met [43]. Therefore, a total
study is part of a larger project, which used a wearable device of 120 participants, representative of the general older
to measure and quantify free-living PA in older adults, a total Portuguese population living in the community within the age
of 120 participants were determined assuming an effect size of group 65-74 years, were recruited from health centers and local
https://www.jmir.org/2022/1/e26652 J Med Internet Res 2022 | vol. 24 | iss. 1 | e26652 | p. 3
(page number not for citation purposes)
XSL• FO
RenderXJOURNAL OF MEDICAL INTERNET RESEARCH Domingos et al
gyms in Northern Portugal. The older adults were defined it offered the best price-quality ratio, had an estimated battery
according to the World Health Organization, which considers life of almost 30 days, was ergonomic, accessible, easy to
older people, in developed economies, as those aged 65 or older. operate, and did not require continuous communication with a
To reduce variability due to the age effect, we used the first smartphone. The system combines sensors that allow the
10-year age group in the same way as Eurostat objective assessment of daily free-living PA, with its algorithms
publication—Ageing Europe [44]. calculating steps, intensity, energy expenditure, and distance
traveled [49,53,54].
The applied exclusion criteria comprised inability to understand
informed consent; diagnosed neuropsychiatric and Technology Acceptance Model
neurodegenerative disorders; or disability that limited The TAM 3 was adapted to the context of the use of activity
independent walking, visual, auditory, or fine motor skills. tracking technologies by older adults, and the key dimensions
Participants having previous experience with other wearable of acceptance were investigated using the following constructs:
activity trackers were not excluded from the study. A final PEOU, PEC, CANX, BI, and USE. PEOU was measured using
sample of 110 participants was enrolled in the study. The study all 4 items adapted from the TAM 3; PEC using 2; CANX using
ran from April 2018 to July 2019. 3, BI and USE were measured using the only item on the original
The study was conducted according to the Helsinki Declaration scale. Multimedia Appendix 1 presents a list of items for all the
and approved by the local and ethics committees (Approval constructs. TAM items were measured on a 7-point Likert scale,
Number 42-2018), developed in compliance with the new starting from “1=strongly disagree” to “7=strongly agree”. The
General Data Protection Regulation, and approved by the mean scores of each item were computed and the mean of means
Portuguese Data Protection Authority (Approval Number of each construct was calculated and used to perform statistical
11286/2017). Study goals and assessments were explained analysis [19].
during screening procedures. All participants provided written
System Usability Scale
informed consent before study enrollment, which included
consent to their data processing. The SUS is a 10-item questionnaire, consisting of 5 positive
and 5 negative statements, with the 5 responses for each
Data Collection and Instruments statement ranging from “5=strongly agree” to “1=strongly
A baseline characterization was performed through a disagree” (Multimedia Appendix 2). The SUS score is calculated
sociodemographic questionnaire, and a neuropsychological by taking 1 from all the scores on odd-numbered items and
evaluation to obtain mood (Geriatric Depression Scale [GDS]) subtracting 5 from the even-numbered items scores. The sum
[45] and global cognitive profiles (Mini-Mental State of the scores is then multiplied by 2.5 to give an overall SUS
Examination [MMSE]) [46]. For screening “cognitive score, and range from 0 (extremely poor usability) to 100
impairment” via the MMSE, the following cutoff values were (excellent usability) [21,25]. The value of 68 is considered the
used: individuals with no education,JOURNAL OF MEDICAL INTERNET RESEARCH Domingos et al
proprieties; (3) structural equation modeling (SEM); and (4) measured variables and latent variables. The derived scores for
moderation analysis. usability and user satisfaction were supported by CFA.
Descriptive Statistics Data were analyzed using IBM SPSS AMOS (version 25) and
Descriptive data analysis was performed using IBM SPSS the parameters were estimated by the maximum likelihood
Statistics (version 26) to depict the characteristics of the study. method. The significance level of 5% was used as a threshold
Descriptive statistics, including frequency, percentage, mean, for the research proposition testing. To determine whether the
standard deviation, minimum, maximum, skewness, and model was reasonable and acceptable, the following indices
kurtosis, were calculated for each variable. Normality was were considered: χ2, χ2/df ratio, CFI, TLI, GFI, and RMSEA.
considered adequate if absolute values for skewness and kurtosis The criteria for an acceptable model fit were the same as those
were above 3.0 and 10.0, respectively [57,58]. The percentage reported for the CFA.
of missing values across the variables was analyzed. Methods To assess multicollinearity, the inspection of the correlation
for handling missing data were not applied because there were matrix of the predictor variables (education, MMSE, GDS, and
no missing data. usability) and the analysis of the variance inflation factor (VIF)
Instruments’ Validation and tolerance were performed (IBM SPSS Statistics, version
26). The tolerance values close to 1 were considered as an
Before structural modeling, the measurement model of latent
indicator of low multicollinearity, whereas a value close to 0
variables for their dimensionality/structure and reliability was
as a potential indicator of collinearity problem [67,68].
assessed.
Moreover, VIF=1 was considered an indicator that the
Confirmatory factor analysis (CFA) was conducted using JASP independent variables are not correlated, and 1JOURNAL OF MEDICAL INTERNET RESEARCH Domingos et al
Table 1. Characteristics of the study participants (N=110).
Characteristics Values
Gender
Male, n (%) 50 (45.5)
Age (years), mean (SD) 68.41 (3.11)
64-70, n (%) 73 (66.4)
≥70, n (%) 37 (33.6)
Education (years), mean (SD) 7.95 (5.38)
1-4, n (%) 58 (52.7)
5-11, n (%) 24 (21.8)
≥12, n (%) 28 (25.5)
a 26.95 (2.00)
MMSE (total score), mean (SD)
22-27, n (%) 41 (37.3)
≥27, n (%) 69 (62.7)
GDSb (total score), mean (SD) 6.05 (4.58)
>11, n (%) 17 (15.5)
a
MMSE: Mini-Mental State Examination.
b
GDS: Geriatric Depression Scale.
follow univariate normal distributions [69,70]. Moreover, the
Instruments’ Descriptive Statistics results reveal a severe violation of normality for the following
The results of descriptive statistics for the instruments (TAM items and constructs: USEQ 1, SUS 1, SUS 3, SUS 5, SUS 9,
3, SUS, and USEQ) are presented in Tables 2-4, respectively. PEOU 3, PEC, and CANX. Thus, these were excluded from
The skewness and kurtosis values indicate some degree of further path analysis.
non-normality. In reality, most behavioral research data do not
https://www.jmir.org/2022/1/e26652 J Med Internet Res 2022 | vol. 24 | iss. 1 | e26652 | p. 6
(page number not for citation purposes)
XSL• FO
RenderXJOURNAL OF MEDICAL INTERNET RESEARCH Domingos et al
Table 2. Descriptive statistics for Technology Acceptance Model 3 items.
Items Range Mean (SD) Skewness Kurtosis
Perceived Ease of Use (PEOU)
PEOU 1 2-7 6.28 (1.08) –1.62 2.25
PEOU 2 1-7 6.06 (2.01) –1.97 2.22
PEOU 3 3-7 6.84 (0.60) –4.37 20.92
PEOU 4 3-7 6.60 (0.92) –2.42 5.11
PEOU score 3.50-7.00 6.45 (0.78) –1.48 1.54
PEOU final 3.67-7.00 6.31 (0.94) –1.25 0.24
Perceptions of External Control (PEC)
PEC 1 3-7 6.55 (0.97) –2.38 5.19
PEC 2 4-7 6.94 (0.41) –6.84 46.91
PEC score 4.00-7.00 6.74 (0.55) –2.62 7.34
Computer Anxiety (CANX)
CANX 1 6-7 6.99 (0.10) –10.49 110.00
CANX 2 1-7 6.86 (0.83) –6.72 45.64
CANX 3 2-7 6.71 (0.97) –3.49 11.44
CANX score 4.33-7.00 6.85 (0.47) –3.55 12.72
Behavioral intention (BI)
BI 1-7 6.60 (0.97) –3.00 10.84
USE (hours) 13-24 23.85 (1.12) –8.99 85.16
Table 3. Descriptive statistics for System Usability Scale items.
Items Range Mean (SD) Skewness Kurtosis
1 1-5 4.71 (0.65) –2.82 9.87
2 1-5 1.44 (1.03) 2.40 4.70
3 2-5 4.92 (0.36) –5.81 40.38
4 1-5 1.38 (1.04) 2.51 4.75
5 1-5 4.85 (0.56) –4.47 23.01
6 1-5 1.28 (0.83) 3.12 9.26
7 1-5 3.58 (0.78) –2.15 4.88
8 1-5 1.30 (0.92) 3.06 8.16
9 3-5 4.86 (0.46) –3.42 10.71
10 1-5 1.41 (1.08) 2.52 4.95
System Usability Scale score 55-100 92.70 (10.73) –1.61 1.77
Table 4. Descriptive statistics for User Satisfaction Evaluation Questionnaire items.
Items Range Mean (SD) Skewness Kurtosis
2 3-5 4.82 (0.47) –2.66 6.46
3 2-5 4.65 (0.71) –2.21 4.50
4 2-5 4.47 (0.75) –1.30 0.98
5 1-5 4.65 (0.93) –2.71 6.15
6 1-5 1.28 (0.83) 3.12 9.26
User Satisfaction Evaluation Questionnaire score 14-25 23.30 (2.40) –1.81 2.99
https://www.jmir.org/2022/1/e26652 J Med Internet Res 2022 | vol. 24 | iss. 1 | e26652 | p. 7
(page number not for citation purposes)
XSL• FO
RenderXJOURNAL OF MEDICAL INTERNET RESEARCH Domingos et al
Instruments’ Psychometric Proprieties Regarding internal consistency, for the SUS questionnaire
As reported by Domingos et al [36], the CFA supported the reliability was calculated only with items included in path
analysis (SUS 2, SUS 4, SUS 6, SUS 7, SUS 8, SUS 10).
conceptual unidimensionality of the USEQ (χ24=1.83, P=.12,
Moreover, the USEQ showed acceptable reliability (Cronbach
χ2/df=1.83; CFI=0.973, TLI=0.931, GFI=0.977, RMSEA=0.087, α=.677; McDonald ω=0.722), as reported by Domingos et al
SRMR=0.038). Furthermore, the CFA for the SUS showed [36]. The McDonald ω coefficients showed acceptable values
satisfactory values for the following indexes: CFI=0.816, for the SUS and USEQ questionnaires ranging from 0.712 to
GFI=0.928, and SRMR=0.074. The fit indices for the model 0.722, respectively.
are presented in Table 5.
Table 5. Confirmatory factor analysis for instruments.
Fit indices User Satisfaction Evaluation Questionnaire System Usability Scale
χ2 7.313 30.074
df 4 9
χ2/df 1.83 3.34
P value .120JOURNAL OF MEDICAL INTERNET RESEARCH Domingos et al
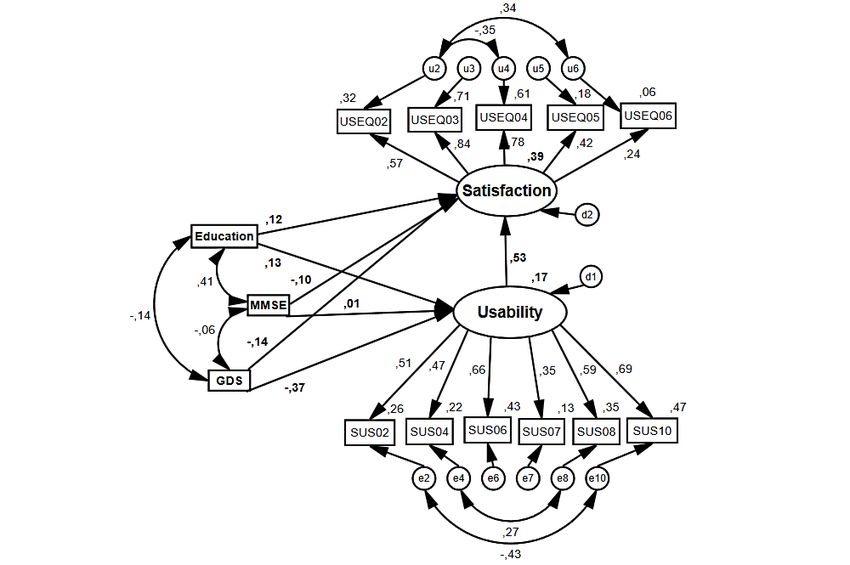
The Structural Equation Modeling for User The path diagram of the model is presented in Figure 3.
Satisfaction Coefficients within paths are standardized coefficients from
regressions. Table 8 summarizes the results of hypothesis
Table 7 shows fit indexes for the structural model, showing
testing, including standardized coefficients and significance
acceptable values for the χ2/df (1.67) and RMSEA (0.079) levels. Specifically, results show that usability was significantly
indexes and values slightly less than the threshold for a good and positively associated with user satisfaction (β=.530; PJOURNAL OF MEDICAL INTERNET RESEARCH Domingos et al
statistically proven with adequate goodness of fit. Nonetheless, and ranged from 0.009 to 0.45. The tolerance values ranged
usability seems to be a strong predictor of user satisfaction. from 0.82 to 0.87 and the VIF values from 1.15 to 1.22,
indicating that no independent variable is in a perfect linear
Considering the possible multicollinearity issues in the SEM,
function with other any independent variable.
the absolute values of correlation coefficients were calculated
Table 8. Results of hypothesis testing based on standardized path coefficients for the research model.
Hypothesis Estimate Standard error Critical ratio P value
H1: Usability > Satisfaction 0.530 0.089 3.008 .003
H2: Education > Satisfaction 0.121 0.005 1.194 .23
H3: Education > Usability 0.130 0.011 1.147 .25
H4: Cognition > Satisfaction –0.098 0.013 –0.999 .32
H5: Cognition > Usability 0.011 0.029 0.104 .92
H6: Depression > Satisfaction –0.140 0.006 –1.376 .17
H7: Depression > Usability –0.369 0.014 –3.010 .003
that the effect of the satisfaction is dependent on GDS levels.
Moderation Analysis The simple slopes of the interaction at –1 SD, mean, and +1 SD
Moderating Effect of the GDS of GDS are plotted in Figure 4. Results indicate a significant
association for high and low values of low GDS, respectively,
Usability significantly predicted satisfaction (β=.43; PJOURNAL OF MEDICAL INTERNET RESEARCH Domingos et al
Table 10. Effect of the usability on satisfaction at different levels of the GDSa.
Effect Estimate Standard error Z P value
Average 0.43 0.083 5.22JOURNAL OF MEDICAL INTERNET RESEARCH Domingos et al
Table 13. Estimates for the moderating effect of the MMSEa and usability in the prediction of user satisfaction.
Variable Estimate Standard error Z P value
Usability 0.380 0.070 5.46JOURNAL OF MEDICAL INTERNET RESEARCH Domingos et al
(SD 14.73). Possible explanations range from the intrinsic Regarding usability, Venkatesh et al [19,75] theorized that
motivation to use the device and how the device is supplied; PEOU is affected by the objective usability of a specific system
therefore, such aspects should be evaluated in future studies. only after a direct experience with the system, where perceptions
about the PEOU are determined solely by usability features,
This study also examined factors influencing user satisfaction
which in turn form the basis for acceptance or rejection.
with the Xiaomi Mi Band 2, based on the proposed theoretical
Moreover, if the system has higher objective usability, it means
framework. The hypothetical model was supported by moderate
that system that is easy to use. Several studies suggested that
acceptable fit indices values (χ2/df=1.67, GFI=0.880, TLI=0.818, usability is a determinant of PEOU [19,23,75].
CFI=0.868, and RMSEA=0.079). Furthermore, 2 of the testing
hypotheses were proven. Overall, results indicate that usability Regarding study limitations, our sample is not representative
is a significant predictor of user satisfaction (β=.530; PJOURNAL OF MEDICAL INTERNET RESEARCH Domingos et al
important factor influencing user satisfaction, which probably influencing the relationship between usability and user
has an impact on technology acceptance and on the intention satisfaction and found that depression symptoms have a
to use activity trackers. However, we were not able to predict significant influence on older adults’ perception of using
BI in our structural model. Furthermore, our results emphasize technology. However, other individual differences/personal user
the need to consider strategies to minimize the usability barriers characteristics should be examined, and the identified
to technology adoption in older adults. In addition, system moderating effects should be taken into consideration when
designers should provide systems that address these concerns, implementing strategies trying to promote technology adoption.
and the researchers must ensure that selected systems adequately Finally, our results suggested that the Xiaomi Mi Band 2 is a
address the usability issues to be effectively implemented in suitable wearable activity tracker for older adults to use in
clinical and research settings. Second, our study investigated real-life context.
the impact of user characteristics as moderating factors
Acknowledgments
Financial support for this work was provided by FEDER funds through the Operational Programme Competitiveness Factors –
COMPETE and National Funds through FCT under the project POCI-01-0145-FEDER-007038 (UIDB/50026/2020, and
UIDP/50026/2020), by the projects NORTE-01-0145-FEDER-000013 and NORTE-01-0145-FEDER-000023 (supported by the
North Portugal Regional Operational Programme [NORTE 2020], under the Portugal 2020 [P2020] Partnership Agreement,
through the European Regional Development Fund [FEDER]), by POCI-01-0145-FEDER-016428 (supported by the Operational
Programme Competitiveness and Internationalization [COMPETE 2020] and the Regional Operational Program of Lisbon and
National Funding through Portuguese Foundation for Science and Technology [FCT, Portugal]), and by the Portuguese North
Regional Operational Programme (ON.2 – O Novo Norte, under the National Strategic Reference Framework [QREN], through
FEDER). The work was also developed under the scope of the 2CA-Braga Grant of the 2017 Clinical Research Projects. CD was
supported by a combined PhD scholarship from FCT and the company iCognitus4ALL - IT Solutions, Lda, Braga, Portugal
(Grant number PD/BDE/127831/2016).
Authors' Contributions
CD was responsible for conceptualization, data curation, formal analysis, investigation, methodology, and writing (original draft,
review, and editing). PSC was responsible for formal analysis, methodology, and writing (review and editing). NCS and JMP
were responsible for funding acquisition, supervision, and writing (review and editing). All authors reviewed and approved the
final version of the manuscript.
Conflicts of Interest
None declared.
Multimedia Appendix 1
Measurement items of TAM 3. TAM: Technology Acceptance Model.
[DOCX File , 14 KB-Multimedia Appendix 1]
Multimedia Appendix 2
Measurement items of USEQ. USEQ: User Satisfaction Evaluation Questionnaire.
[DOCX File , 13 KB-Multimedia Appendix 2]
Multimedia Appendix 3
Measurement items of SUS. SUS: System Usability Scale.
[DOCX File , 13 KB-Multimedia Appendix 3]
References
1. Shin G, Jarrahi MH, Fei Y, Karami A, Gafinowitz N, Byun A, et al. Wearable activity trackers, accuracy, adoption,
acceptance and health impact: A systematic literature review. J Biomed Inform 2019 May;93:103153 [FREE Full text]
[doi: 10.1016/j.jbi.2019.103153] [Medline: 30910623]
2. Shih P, Han K, Poole E, Rosson M, Carroll J. Use and adoption challenges of wearable activity trackers. In: Proceedings
of the iConference. 2015 Presented at: iConference; March 15, 2015; Newport Beach, CA p. 1-12 URL: https://www.
researchgate.net/publication/268746784_Use_and_adoption_challenges_of_wearable_activity_trackers
3. Rupp MA, Michaelis JR, McConnell DS, Smither JA. The role of individual differences on perceptions of wearable fitness
device trust, usability, and motivational impact. Appl Ergon 2018 Jul;70:77-87. [doi: 10.1016/j.apergo.2018.02.005]
[Medline: 29866329]
https://www.jmir.org/2022/1/e26652 J Med Internet Res 2022 | vol. 24 | iss. 1 | e26652 | p. 14
(page number not for citation purposes)
XSL• FO
RenderXJOURNAL OF MEDICAL INTERNET RESEARCH Domingos et al
4. Steinert A, Haesner M, Steinhagen-Thiessen E. Activity-tracking devices for older adults: comparison and preferences.
Univ Access Inf Soc 2017 Apr 8;17(2):411-419. [doi: 10.1007/s10209-017-0539-7]
5. Turner-McGrievy G, Jake-Schoffman DE, Singletary C, Wright M, Crimarco A, Wirth MD, et al. Using Commercial
Physical Activity Trackers for Health Promotion Research: Four Case Studies. Health Promot Pract 2019 May;20(3):381-389
[FREE Full text] [doi: 10.1177/1524839918769559] [Medline: 29618233]
6. Alley S, van Uffelen JG, Schoeppe S, Parkinson L, Hunt S, Power D, et al. Efficacy of a computer-tailored web-based
physical activity intervention using Fitbits for older adults: a randomised controlled trial protocol. BMJ Open 2019 Dec
23;9(12):e033305 [FREE Full text] [doi: 10.1136/bmjopen-2019-033305] [Medline: 31874890]
7. Seifert A, Schlomann A, Rietz C, Schelling HR. The use of mobile devices for physical activity tracking in older adults'
everyday life. Digit Health 2017;3:2055207617740088 [FREE Full text] [doi: 10.1177/2055207617740088] [Medline:
29942617]
8. Liang J, Xian D, Liu X, Fu J, Zhang X, Tang B, et al. Usability Study of Mainstream Wearable Fitness Devices: Feature
Analysis and System Usability Scale Evaluation. JMIR Mhealth Uhealth 2018 Nov 08;6(11):e11066 [FREE Full text] [doi:
10.2196/11066] [Medline: 30409767]
9. Maher C, Ryan J, Ambrosi C, Edney S. Users' experiences of wearable activity trackers: a cross-sectional study. BMC
Public Health 2017 Nov 15;17(1):880 [FREE Full text] [doi: 10.1186/s12889-017-4888-1] [Medline: 29141607]
10. Kononova A, Li L, Kamp K, Bowen M, Rikard R, Cotten S, et al. The Use of Wearable Activity Trackers Among Older
Adults: Focus Group Study of Tracker Perceptions, Motivators, and Barriers in the Maintenance Stage of Behavior Change.
JMIR Mhealth Uhealth 2019 Apr 05;7(4):e9832 [FREE Full text] [doi: 10.2196/mhealth.9832] [Medline: 30950807]
11. Berkowsky R, Sharit J, Czaja SJ. Factors Predicting Decisions About Technology Adoption Among Older Adults. Innov
Aging 2018 Jan;2(1):igy002 [FREE Full text] [doi: 10.1093/geroni/igy002] [Medline: 30480129]
12. Preusse KC, Mitzner TL, Fausset CB, Rogers WA. Older Adults' Acceptance of Activity Trackers. J Appl Gerontol 2017
Feb;36(2):127-155 [FREE Full text] [doi: 10.1177/0733464815624151] [Medline: 26753803]
13. Mercer K, Giangregorio L, Schneider E, Chilana P, Li M, Grindrod K. Acceptance of Commercially Available Wearable
Activity Trackers Among Adults Aged Over 50 and With Chronic Illness: A Mixed-Methods Evaluation. JMIR Mhealth
Uhealth 2016 Jan 27;4(1):e7 [FREE Full text] [doi: 10.2196/mhealth.4225] [Medline: 26818775]
14. Schlomann A, Seifert A, Rietz C. Relevance of Activity Tracking With Mobile Devices in the Relationship Between
Physical Activity Levels and Satisfaction With Physical Fitness in Older Adults: Representative Survey. JMIR Aging 2019
Mar 06;2(1):e12303 [FREE Full text] [doi: 10.2196/12303] [Medline: 31518263]
15. LaCaille L. Theory of Reasoned Action. In: Gellman MD, Turner JR, editors. Encyclopedia of Behavioral Medicine. New
York, NY: Springer; 2013:1964-1967.
16. Davis FD. Perceived Usefulness, Perceived Ease of Use, and User Acceptance of Information Technology. MIS Quarterly
1989 Sep;13(3):319-340. [doi: 10.2307/249008]
17. Revythi A, Tselios N. Extension of technology acceptance model by using system usability scale to assess behavioral
intention to use e-learning. Educ Inf Technol 2019 Feb 1;24(4):2341-2355. [doi: 10.1007/s10639-019-09869-4]
18. Venkatesh V, Davis FD. A Theoretical Extension of the Technology Acceptance Model: Four Longitudinal Field Studies.
Management Science 2000 Feb;46(2):186-204. [doi: 10.1287/mnsc.46.2.186.11926]
19. Venkatesh V, Bala H. Technology Acceptance Model 3 and a Research Agenda on Interventions. Decision Sciences 2008
May;39(2):273-315. [doi: 10.1111/j.1540-5915.2008.00192.x]
20. Lewis JR. The System Usability Scale: Past, Present, and Future. International Journal of Human–Computer Interaction
2018 Mar 30;34(7):577-590. [doi: 10.1080/10447318.2018.1455307]
21. Brooke J. SUS - A quick and dirty usability scale. Usability Evaluation in Industry. 1996. URL: https://www.researchgate.net/
publication/228593520_SUS_A_quick_and_dirty_usability_scale [accessed 2022-01-11]
22. Pande T, Saravu K, Temesgen Z, Seyoum A, Rai S, Rao R, et al. Evaluating clinicians' user experience and acceptability
of , a smartphone application for tuberculosis in India. Mhealth 2017 Jul 27;3:30-30 [FREE Full text] [doi:
10.21037/mhealth.2017.07.01] [Medline: 28828377]
23. M Scholtz B, Mahmud I, T. R. Does Usability Matter? An Analysis of the Impact of Usability on Technology Acceptance
in ERP Settings. IJIKM 2016;11:309-330. [doi: 10.28945/3591]
24. Lewis JR, Sauro J. The factor structure of the System Usability Scale. In: Human Centered Design. Berlin, Heidelberg:
Springer; 2009:94-103.
25. Martins AI, Rosa AF, Queirós A, Silva A, Rocha NP. European Portuguese Validation of the System Usability Scale (SUS).
Procedia Computer Science 2015;67:293-300. [doi: 10.1016/j.procs.2015.09.273]
26. International Organization for Standardization. Ergonomics of Human-System Interaction — Part 11: Usability: Definitions
and Concepts. 2018. URL: https://www.iso.org/obp/ui/#iso:std:iso:9241:-11:ed-2:v1:en [accessed 2022-01-11]
27. Bevan N, Carter J, Earthy J, Geis T, Harker S. New ISO standards for usability, usability reports and usability measures.
In: Human-Computer Interaction. Theory, Design, Development and Practice. Cham, Switzerland: Springer; 2016:268-278.
28. Dalcher I, Shine J. Extending the New Technology Acceptance Model to Measure the End User Information Systems
Satisfaction in a Mandatory Environment: A Bank's Treasury. Technology Analysis & Strategic Management 2003
Dec;15(4):441-455. [doi: 10.1080/095373203000136033]
https://www.jmir.org/2022/1/e26652 J Med Internet Res 2022 | vol. 24 | iss. 1 | e26652 | p. 15
(page number not for citation purposes)
XSL• FO
RenderXJOURNAL OF MEDICAL INTERNET RESEARCH Domingos et al
29. Chao C. Factors Determining the Behavioral Intention to Use Mobile Learning: An Application and Extension of the
UTAUT Model. Front Psychol 2019 Jul 16;10:1652 [FREE Full text] [doi: 10.3389/fpsyg.2019.01652] [Medline: 31379679]
30. Wixom BH, Todd PA. A Theoretical Integration of User Satisfaction and Technology Acceptance. Information Systems
Research 2005 Mar;16(1):85-102. [doi: 10.1287/isre.1050.0042]
31. Mather D, Caputi P, Jayasuriya R. Is the technology acceptance model a valid model of user satisfaction of information
technology in environments where usage is mandatory? ACIS 2002 Proceedings. 2002. URL: https://aisel.aisnet.org/cgi/
viewcontent.cgi?article=1149&context=acis2002 [accessed 2022-01-11]
32. Ghobakhloo M, Zulkifli B, Aziz F. The interactive model of user information technology acceptance and satisfaction in
small and medium-sized enterprises. European Journal of Economics, Finance and Administrative Sciences 2010;19(1):7-27
[FREE Full text]
33. Ho K, Ho C, Chung M. Theoretical integration of user satisfaction and technology acceptance of the nursing process
information system. PLoS One 2019 Jun 4;14(6):e0217622 [FREE Full text] [doi: 10.1371/journal.pone.0217622] [Medline:
31163076]
34. He L, Kim H, Gong H. The Influence of Consumer and Product Characteristics on Intention to Repurchase of Smart band.
International Journal of Asia Digital Art and Design Association 2017;21(1):13-18. [doi: 10.20668/adada.21.1_13]
35. Gil-Gómez JA, Manzano-Hernández P, Albiol-Pérez S, Aula-Valero C, Gil-Gómez H, Lozano-Quilis J. USEQ: A Short
Questionnaire for Satisfaction Evaluation of Virtual Rehabilitation Systems. Sensors (Basel) 2017 Jul 07;17(7):1589 [FREE
Full text] [doi: 10.3390/s17071589] [Medline: 28686174]
36. Domingos C, Costa PS, Santos NS, Pêgo JM. European Portuguese Version of the User Satisfaction Evaluation Questionnaire
(USEQ): Transcultural Adaptation and Validation Study. JMIR Mhealth Uhealth 2021 Jun 29;9(6):e19245 [FREE Full
text] [doi: 10.2196/19245] [Medline: 34185018]
37. Montag C, Panksepp J. Primary Emotional Systems and Personality: An Evolutionary Perspective. Front Psychol 2017;8:464
[FREE Full text] [doi: 10.3389/fpsyg.2017.00464] [Medline: 28443039]
38. Svendsen GB, Johnsen JK, Almås-Sørensen L, Vittersø J. Personality and technology acceptance: the influence of personality
factors on the core constructs of the Technology Acceptance Model. Behaviour & Information Technology 2013
Apr;32(4):323-334. [doi: 10.1080/0144929x.2011.553740]
39. Li Q, Luximon Y. Understanding Older Adults Post-Adoption Usage Behavior and Perceptions of Mobile Technology.
International Journal of Design 2018;12(3):93-110 [FREE Full text]
40. Hogan CL, Mata J, Carstensen LL. Exercise holds immediate benefits for affect and cognition in younger and older adults.
Psychol Aging 2013 Jun;28(2):587-594 [FREE Full text] [doi: 10.1037/a0032634] [Medline: 23795769]
41. Gajewski PD, Falkenstein M. Physical activity and neurocognitive functioning in aging - a condensed updated review. Eur
Rev Aging Phys Act 2016 Jan 21;13(1):1 [FREE Full text] [doi: 10.1186/s11556-016-0161-3] [Medline: 26865880]
42. Lautenschlager NT, Cox K, Cyarto EV. The influence of exercise on brain aging and dementia. Biochim Biophys Acta
2012 Mar;1822(3):474-481 [FREE Full text] [doi: 10.1016/j.bbadis.2011.07.010] [Medline: 21810472]
43. Green SB. How Many Subjects Does It Take To Do A Regression Analysis. Multivariate Behav Res 1991 Jul
01;26(3):499-510. [doi: 10.1207/s15327906mbr2603_7] [Medline: 26776715]
44. Eurostat. Ageing Europe. Looking at the Lives of Older People in the EU. 2020. URL: https://ec.europa.eu/eurostat/
documents/3217494/11478057/KS-02-20-655-EN-N.pdf/9b09606c-d4e8-4c33-63d2-3b20d5c19c91?t=1604055531000
[accessed 2022-01-11]
45. Yesavage JA, Brink T, Rose TL, Lum O, Huang V, Adey M, et al. Development and validation of a geriatric depression
screening scale: A preliminary report. Journal of Psychiatric Research 1982 Jan;17(1):37-49. [doi:
10.1016/0022-3956(82)90033-4]
46. Guerreiro M, Silva AA, Botelho MF, Leitão O, Castro-Caldas A, Garcia C. Adaptação à população portuguesa da tradução
do Mini Mental State Examination (MMSE). Revista Portuguesa de Neurologia 1994;1(9):9-10.
47. Santana I, Duro D, Lemos R, Costa V, Pereira M, Simões MR, et al. [Mini-Mental State Examination: Screening and
Diagnosis of Cognitive Decline, Using New Normative Data]. Acta Med Port 2016 Apr;29(4):240-248 [FREE Full text]
[doi: 10.20344/amp.6889] [Medline: 27349775]
48. Pocinho M, Farate C, Dias C, Lee T, Yesavage J. Clinical and Psychometric Validation of the Geriatric Depression Scale
(GDS) for Portuguese Elders. Clinical Gerontologist 2009 Feb 23;32(2):223-236. [doi: 10.1080/07317110802678680]
49. Puri A, Kim B, Nguyen O, Stolee P, Tung J, Lee J. User Acceptance of Wrist-Worn Activity Trackers Among
Community-Dwelling Older Adults: Mixed Method Study. JMIR Mhealth Uhealth 2017 Nov 15;5(11):e173 [FREE Full
text] [doi: 10.2196/mhealth.8211] [Medline: 29141837]
50. Vooijs M, Alpay LL, Snoeck-Stroband JB, Beerthuizen T, Siemonsma PC, Abbink JJ, et al. Validity and usability of
low-cost accelerometers for internet-based self-monitoring of physical activity in patients with chronic obstructive pulmonary
disease. Interact J Med Res 2014 Oct 27;3(4):e14 [FREE Full text] [doi: 10.2196/ijmr.3056] [Medline: 25347989]
51. Farina N, Lowry RG. Older adults' satisfaction of wearing consumer-level activity monitors. J Rehabil Assist Technol Eng
2017 Oct 31;4:2055668317733258 [FREE Full text] [doi: 10.1177/2055668317733258] [Medline: 31186939]
https://www.jmir.org/2022/1/e26652 J Med Internet Res 2022 | vol. 24 | iss. 1 | e26652 | p. 16
(page number not for citation purposes)
XSL• FO
RenderXJOURNAL OF MEDICAL INTERNET RESEARCH Domingos et al
52. Xie J, Wen D, Liang L, Jia Y, Gao L, Lei J. Evaluating the Validity of Current Mainstream Wearable Devices in Fitness
Tracking Under Various Physical Activities: Comparative Study. JMIR Mhealth Uhealth 2018 Apr 12;6(4):e94 [FREE
Full text] [doi: 10.2196/mhealth.9754] [Medline: 29650506]
53. El-Amrawy F, Nounou MI. Are Currently Available Wearable Devices for Activity Tracking and Heart Rate Monitoring
Accurate, Precise, and Medically Beneficial? Healthc Inform Res 2015 Oct;21(4):315-320 [FREE Full text] [doi:
10.4258/hir.2015.21.4.315] [Medline: 26618039]
54. Mičková E, Machová K, Daďová K, Svobodová I. Does Dog Ownership Affect Physical Activity, Sleep, and Self-Reported
Health in Older Adults? Int J Environ Res Public Health 2019 Sep 11;16(18):3355 [FREE Full text] [doi:
10.3390/ijerph16183355] [Medline: 31514379]
55. Brooke J. SUS: a retrospective. Journal of Usability Studies 2013;8(2):29-40 [FREE Full text]
56. Bangor A, Kortum P, Miller J. Determining what individual SUS scores mean: adding an adjective rating scale. The Journal
of Usability Studies 2009;4(3):114-123 [FREE Full text]
57. Kline RB. Principles and Practice of Structural Equation Modeling. New York, NY: Guilford Publications; 2015.
58. Diop EB, Zhao S, Duy TV. An extension of the technology acceptance model for understanding travelers' adoption of
variable message signs. PLoS One 2019 Apr 25;14(4):e0216007 [FREE Full text] [doi: 10.1371/journal.pone.0216007]
[Medline: 31022277]
59. Hooper D, Coughlan J, Mullen M. Structural equation modelling: guidelines for determining model fit. Electronic Journal
on Business Research Methods 2008;6(1):53-60 [FREE Full text]
60. Schermelleh-Engel K, Moosbrugger H, Müller H. Evaluating the fit of structural equation models: tests of significance and
descriptive goodness-of-fit measures. Methods of Psychological Research 2003;8(2):23-74 [FREE Full text]
61. Hu L, Bentler PM. Cutoff criteria for fit indexes in covariance structure analysis: Conventional criteria versus new alternatives.
Structural Equation Modeling: A Multidisciplinary Journal 1999 Jan;6(1):1-55. [doi: 10.1080/10705519909540118]
62. Şimşek GG, Noyan F. McDonald's ωt, Cronbach's α, and Generalized θ for Composite Reliability of Common Factors
Structures. Communications in Statistics - Simulation and Computation 2013 Oct;42(9):2008-2025. [doi:
10.1080/03610918.2012.689062]
63. Trizano-Hermosilla I, Alvarado JM. Best Alternatives to Cronbach's Alpha Reliability in Realistic Conditions: Congeneric
and Asymmetrical Measurements. Front Psychol 2016 May 26;7:769 [FREE Full text] [doi: 10.3389/fpsyg.2016.00769]
[Medline: 27303333]
64. Costello A, Osborne J. Best practices in exploratory factor analysis: four recommendations for getting the most from your
analysis. Practical Assessment 2005;10(7):1-9 [FREE Full text] [doi: 10.4135/9781412995627.d8]
65. Gadermann AM, Guhn M, Zumbo BD. Estimating ordinal reliability for Likert-type and ordinal item response data: A
conceptual, empirical, and practical guide. Practical Assessment, Research, and Evaluation 2012;17(3):1-13 [FREE Full
text]
66. Cronbach LJ. Coefficient alpha and the internal structure of tests. Psychometrika 1951 Sep;16(3):297-334. [doi:
10.1007/bf02310555]
67. Shrestha N. Detecting Multicollinearity in Regression Analysis. AJAMS 2020 Jan 15;8(2):39-42. [doi: 10.12691/ajams-8-2-1]
68. Senaviratna NAMR, A. Cooray TMJ. Diagnosing Multicollinearity of Logistic Regression Model. AJPAS 2019 Oct 01:1-9.
[doi: 10.9734/ajpas/2019/v5i230132]
69. Curran PJ, West SG, Finch JF. The robustness of test statistics to nonnormality and specification error in confirmatory
factor analysis. Psychological Methods 1996 Mar;1(1):16-29. [doi: 10.1037/1082-989x.1.1.16]
70. Norman G. Likert scales, levels of measurement and the "laws" of statistics. Adv Health Sci Educ Theory Pract 2010 Dec
10;15(5):625-632. [doi: 10.1007/s10459-010-9222-y] [Medline: 20146096]
71. Bassett DR, Freedson PS, John D. Wearable Activity Trackers in Clinical Research and Practice. Kinesiology Review 2019
Feb;8(1):11-15. [doi: 10.1123/kr.2018-0060]
72. Keogh A, Dorn JF, Walsh L, Calvo F, Caulfield B. Comparing the Usability and Acceptability of Wearable Sensors Among
Older Irish Adults in a Real-World Context: Observational Study. JMIR Mhealth Uhealth 2020 Apr 20;8(4):e15704 [FREE
Full text] [doi: 10.2196/15704] [Medline: 32310149]
73. Lyons EJ, Swartz MC, Lewis ZH, Martinez E, Jennings K. Feasibility and Acceptability of a Wearable Technology Physical
Activity Intervention With Telephone Counseling for Mid-Aged and Older Adults: A Randomized Controlled Pilot Trial.
JMIR Mhealth Uhealth 2017 Mar 06;5(3):e28 [FREE Full text] [doi: 10.2196/mhealth.6967] [Medline: 28264796]
74. Thielsch M, Thielsch C. Depressive symptoms and web user experience. PeerJ 2018;6:e4439 [FREE Full text] [doi:
10.7717/peerj.4439] [Medline: 29507832]
75. Venkatesh V. Determinants of Perceived Ease of Use: Integrating Control, Intrinsic Motivation, and Emotion into the
Technology Acceptance Model. Information Systems Research 2000 Dec;11(4):342-365. [doi: 10.1287/isre.11.4.342.11872]
76. Fabrigar LR, Wegener DT, MacCallum RC, Strahan EJ. Evaluating the use of exploratory factor analysis in psychological
research. Psychological Methods 1999 Sep;4(3):272-299. [doi: 10.1037/1082-989x.4.3.272]
77. Wolf EJ, Harrington KM, Clark SL, Miller MW. Sample Size Requirements for Structural Equation Models: An Evaluation
of Power, Bias, and Solution Propriety. Educ Psychol Meas 2013 Dec 09;76(6):913-934 [FREE Full text] [doi:
10.1177/0013164413495237] [Medline: 25705052]
https://www.jmir.org/2022/1/e26652 J Med Internet Res 2022 | vol. 24 | iss. 1 | e26652 | p. 17
(page number not for citation purposes)
XSL• FO
RenderXJOURNAL OF MEDICAL INTERNET RESEARCH Domingos et al
78. Kyriazos TA. Applied Psychometrics: Sample Size and Sample Power Considerations in Factor Analysis (EFA, CFA) and
SEM in General. PSYCH 2018;09(08):2207-2230. [doi: 10.4236/psych.2018.98126]
79. Sung J, Christensen HI, Grinter RE. Robots in the wild: Understanding long-term use. In: HRI '09: Proceedings of the 4th
ACM/IEEE international conference on Human robot interaction. 2009 Presented at: HRI09: International Conference on
Human Robot Interaction; March 9-13, 2009; La Jolla, CA p. 45-52. [doi: 10.1145/1514095.1514106]
80. Shin G, Feng Y, Jarrahi MH, Gafinowitz N. Beyond novelty effect: a mixed-methods exploration into the motivation for
long-term activity tracker use. JAMIA Open 2019 Apr;2(1):62-72 [FREE Full text] [doi: 10.1093/jamiaopen/ooy048]
[Medline: 31984346]
81. International Organization for Standardization. Software Engineering — Product Quality — Part 1: Quality Model. 2001.
URL: https://www.iso.org/standard/22749.html [accessed 2022-01-11]
82. Shackel B. Usability—context, framework, definition, design, and evaluation. In: Shackel B, Richardson S, editors. Human
Factors for Informatics Usability. Cambridge, MA: Cambridge University Press; 1991:21-38.
83. Nielsen J. Usability Engineering. San Diego, CA: Academic Press; 1993.
84. Weichbroth P. Usability attributes revisited: a time-framed knowledge map. In: Proceedings of the Federated Conference
on Computer Science and Information Systems. New York, NY: IEEE; 2018 Presented at: Federated Conference on
Computer Science and Information Systems; September 9-12, 2018; Poznań, Poland p. 1005-1008 URL: https://annals-csis.
org/Volume_15/drp/pdf/137.pdf [doi: 10.15439/2018F137]
85. Madan A, Dubey SK. Usability evaluation methods: a literature review. International Journal of Engineering Science and
Technology 2012 Feb;4(2):590-599 [FREE Full text]
Abbreviations
BI: behavioral intention
CANX: computer anxiety
CFA: confirmatory factor analysis
CFI: Comparative Fit Index
GDS: Geriatric Depression Scale
GFI: Goodness of Fit Index
MMSE: Mini-Mental State Examination
PA: physical activity
PEC: perceptions of external control
PEOU: perceived ease of use
PU: perceived usefulness
RMSEA: Root Mean Squared Error of Approximation
SEM: structural equation modeling
SRMR: Standardized Root Mean Squared Residual
SUS: System Usability Scale
TAM: Technology Acceptance Model
TLI: Tucker–Lewis Index
USEQ: User Satisfaction Evaluation Questionnaire
VIF: variance inflation factor
Edited by R Kukafka; submitted 19.12.20; peer-reviewed by N Georgi, S Mukherjee, T Russell-Rose; comments to author 15.02.21;
revised version received 24.03.21; accepted 05.07.21; published 26.01.22
Please cite as:
Domingos C, Costa P, Santos NC, Pêgo JM
Usability, Acceptability, and Satisfaction of a Wearable Activity Tracker in Older Adults: Observational Study in a Real-Life Context
in Northern Portugal
J Med Internet Res 2022;24(1):e26652
URL: https://www.jmir.org/2022/1/e26652
doi: 10.2196/26652
PMID:
©Célia Domingos, Patrício Costa, Nadine Correia Santos, José Miguel Pêgo. Originally published in the Journal of Medical
Internet Research (https://www.jmir.org), 26.01.2022. This is an open-access article distributed under the terms of the Creative
Commons Attribution License (https://creativecommons.org/licenses/by/4.0/), which permits unrestricted use, distribution, and
https://www.jmir.org/2022/1/e26652 J Med Internet Res 2022 | vol. 24 | iss. 1 | e26652 | p. 18
(page number not for citation purposes)
XSL• FO
RenderXJOURNAL OF MEDICAL INTERNET RESEARCH Domingos et al
reproduction in any medium, provided the original work, first published in the Journal of Medical Internet Research, is properly
cited. The complete bibliographic information, a link to the original publication on https://www.jmir.org/, as well as this copyright
and license information must be included.
https://www.jmir.org/2022/1/e26652 J Med Internet Res 2022 | vol. 24 | iss. 1 | e26652 | p. 19
(page number not for citation purposes)
XSL• FO
RenderXYou can also read