Use of Human Induced Pluripotent Stem Cells and Kidney Organoids To Develop a Cysteamine/mTOR Inhibition Combination Therapy for Cystinosis ...
←
→
Page content transcription
If your browser does not render page correctly, please read the page content below
BASIC RESEARCH           www.jasn.org

Use of Human Induced Pluripotent Stem Cells and
Kidney Organoids To Develop a Cysteamine/mTOR
Inhibition Combination Therapy for Cystinosis
Jennifer A. Hollywood,1 Aneta Przepiorski ,2 Randall F. D’Souza,3
Sreevalsan Sreebhavan,4 Ernst J. Wolvetang,5 Patrick T. Harrison,6 Alan J. Davidson,1 and
Teresa M. Holm1
1
 Department of Molecular Medicine and Pathology, The University of Auckland, Auckland, New Zealand
2
 Department of Developmental Biology, University of Pittsburgh, Pennsylvania
3
 Discipline of Nutrition, The University of Auckland, Auckland, New Zealand
4
 Auckland Cancer Society Research Centre, The University of Auckland, Auckland, New Zealand
5
 Australian Institute for Bioengineering and Nanotechnology, The University of Queensland, Brisbane, Queensland,
Australia
6
 Department of Physiology, Biosciences Institute, University College Cork, Cork, Ireland

ABSTRACT
Background Mutations in CTNS—a gene encoding the cystine transporter cystinosin—cause the rare,
autosomal, recessive, lysosomal-storage disease cystinosis. Research has also implicated cystinosin in
modulating the mTORC1 pathway, which serves as a core regulator of cellular metabolism, proliferation,
survival, and autophagy. In its severest form, cystinosis is characterized by cystine accumulation, renal
proximal tubule dysfunction, and kidney failure. Because treatment with the cystine-depleting drug cys-
teamine only slows disease progression, there is an urgent need for better treatments.
Methods To address a lack of good human-based cell culture models for studying cystinosis, we generated
the first human induced pluripotent stem cell (iPSC) and kidney organoid models of the disorder. We used
a variety of techniques to examine hallmarks of cystinosis—including cystine accumulation, lysosome size,
the autophagy pathway, and apoptosis—and performed RNA sequencing on isogenic lines to identify
differentially expressed genes in the cystinosis models compared with controls.
Results Compared with controls, these cystinosis models exhibit elevated cystine levels, increased apo-
ptosis, and defective basal autophagy. Cysteamine treatment ameliorates this phenotype, except for
abnormalities in apoptosis and basal autophagy. We found that treatment with everolimus, an inhibitor
of the mTOR pathway, reduces the number of large lysosomes, decreases apoptosis, and activates auto-
phagy, but it does not rescue the defect in cystine loading. However, dual treatment of cystinotic iPSCs or
kidney organoids with cysteamine and everolimus corrects all of the observed phenotypic abnormalities.
Conclusions These observations suggest that combination therapy with a cystine-depleting drug such as
cysteamine and an mTOR pathway inhibitor such as everolimus has potential to improve treatment of
cystinosis.

JASN 31: ccc–ccc, 2020. doi: https://doi.org/10.1681/ASN.2019070712

                                                                 University of Auckland, Auckland, New Zealand. E-mail: a.da-
Received July 18, 2019. Accepted February 9, 2020.               vidson@auckland.ac.nz or t.holm@auckland.ac.nz or j.holly-
                                                                 wood@auckland.ac.nz
Published online ahead of print. Publication date available at
www.jasn.org.                                                    Copyright © 2020 by the American Society of Nephrology

Correspondence: Dr. Alan J. Davidson or Dr. Teresa M. Holm,
Department of Molecular Medicine and Pathology, The

JASN 31: ccc–ccc, 2020                                                                                            ISSN : 1046-6673/3105-ccc   1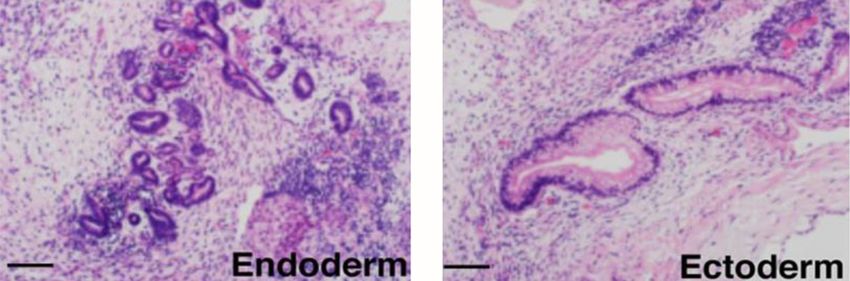
BASIC RESEARCH     www.jasn.org

Cystinosis is a rare, autosomal, recessive, lysosomal-storage
                                                                        Significance Statement
disease caused by mutations in the CYSTINOSIN (CTNS)
gene which encodes a cystine transporter.1,2 In the absence of          In its severest form, the lysosomal storage disease cystinosis is
CTNS, cystine accumulates within the lysosome where it causes           characterized by accumulation of cystine; renal proximal tubule
                                                                        dysfunction; and kidney failure. Research has also implicated cys-
lysosomal dysfunction. Nephropathic cystinosis is the most
                                                                        tinosin in modulating the mammalian target of rapamycin (mTOR)
severe form of cystinosis and is initially associated with the          complex 1 pathway. Use of the cystine-depleting drug cysteamine,
renal proximal tubule failing to reabsorb essential metabolites         the sole treatment option for cystinosis, only slows disease pro-
from the urine (Fanconi syndrome). Kidney defects present               gression. The authors developed induced pluripotent stem cell and
between 6 and 18 months of age and progress to renal failure            kidney organoid models of cystinosis that exhibit elevated cystine
                                                                        levels, enlarged lysosomes, increased apoptosis, and defective
by the end of the first decade of life.1,3 Other complications
                                                                        basal autophagy. Although the latter is not rescued by cysteamine
include derangements in nonrenal tissues such as widespread             treatment, mTOR inhibition with everolimus was able to restore
cystine crystal formation (notably in the cornea), hypothy-             basal autophagy to levels of healthy controls. Dual treatment of
roidism, and neurologic and muscular symptoms.4–7                       everolimus and cysteamine rescued all of the observed cystinotic
   The current treatment for cystinosis is lifelong therapy with        phenotypes in the models, suggesting that a combination therapy
                                                                        may improve outcomes in patients with cystinosis.
cysteamine, a molecule that cleaves the cystine disulphide
bond to produce mixed disulphides that can escape the lyso-
some through alternative transporters.8,9 However, cyste-                  More recently, CTNS has been implicated in modulating
amine only slows the progression of renal injury and kidney            the mammalian target of rapamycin (mTOR) complex 1
transplantation is inevitably required later in life.9,10 As a re-     (mTORC1) pathway, which integrates both intracellular and
sult, there remains a pressing need to develop more effective          extracellular signals and serves as a core regulator of cellular
therapies for cystinosis.                                              metabolism, proliferation, survival, and autophagy. 35
   Although there is not yet a complete understanding of the           mTORC1 switches between active and inactive states in re-
pathogenesis of cystinosis, several lines of evidence indicate         sponse to nutrient availability.36,37 Inhibition of mTORC1
that cystine loading causes lysosomal enlargement, impaired            by a class of drugs that include everolimus, which is used
proteolysis, and delayed fusion with cargo-loaded vesi-                clinically as an immunosuppressant and anticancer agent, re-
cles.11–14 Other cellular features of cystinotic cells that are pre-   sults in activation of autophagy.38,39 CYSTINOSIN physically
sent in different cell types include reduced ATP and GSH               interacts with mTORC1-binding partners that are necessary
levels, mitochondrial damage, oxidative stress, increased apo-         for mTORC1 activation by amino acids.40 Loss of CYSTINO-
ptosis, and proximal tubule cell dedifferentiation.9,15–27 In          SIN function in conditionally immortalized human and
addition, cystinotic proximal tubule cells display decreased           mouse proximal tubule cell lines leads to a reduction in
expression of the endocytic receptors megalin and cubulin              mTORC1 activity as well as delayed reactivation after a return
as well as impaired megalin recycling.11,12                            to amino acid–rich conditions.40,41
   Defects in macroautophagy (herein called autophagy) are                 One of the challenges of the cystinosis field is a lack of good
also found in cystinotic cells. Autophagy involves the seques-         human-based cell culture models. To address this, we generated
tration of a portion of the cytoplasm by a double-layered              patient-specific and CRISPR/Cas9-edited cystinotic induced plu-
membrane known as an autophagosome, followed by fusion                 ripotent stem cells (iPSCs). These cells have the advantages of being
with a lysosome to form an autolysosome.28 This final step can          a renewable source of nonimmortalized cystinotic cells and can be
be modulated by bafilomycin A1 (BafA1), an inhibitor of au-             differentiated into numerous tissues, including kidney organoids.
tophagolysosome acidification that disrupts autophagosome-              Our analysis of CTNS iPSCs and kidney organoids revealed in-
lysosome fusion.29 Under resting conditions, basal levels of           creased cystine levels, enlarged lysosomes, abnormal basal auto-
autophagy are required in a “housekeeping” capacity to de-             phagy flux, increased apoptosis and altered gene expression com-
grade long-lived and ubiquitinated proteins; N-linked glycans;         pared with healthy controls, consistent with modeling key aspects
damaged organelles, such as mitochondria; and to dampen                of the cystinotic phenotype. We further discovered that some of
certain pathways such as inflammatory, Notch, and Wnt sig-              these defects can be rescued by treatment with cysteamine or ever-
naling.30–32 Under stress conditions, such as starvation, auto-        olimus alone, but that combination therapy was the most effica-
phagy is greatly upregulated to ensure metabolically useful            cious. These results suggest that a cysteamine/everolimus combi-
molecules are recycled to maintain cellular homeostasis. Al-           nation therapy may have therapeutic potential to improve the
though autophagy can be induced in cystinotic cells by star-           treatment, and health outcomes, of individuals with cystinosis.
vation,33 basal autophagy flux is reduced in a number of
cystinotic cell lines, resulting in a build-up of autophagosomes
that frequently contain mitochondria.26,33,34 In addition, the         METHODS
separate pathway of chaperone-mediated autophagy, in which
specific cytosolic proteins are directly delivered across the ly-       iPSC Lines and Maintenance
sosomal membrane for degradation, is also defective in fibro-           All work was carried out with the approval of the University
blasts from the Ctns-knockout (KO) mouse.33                            of Auckland Human Participants Ethics Committee (UAH-

2        JASN                                                                                                         JASN 31: ccc–ccc, 2020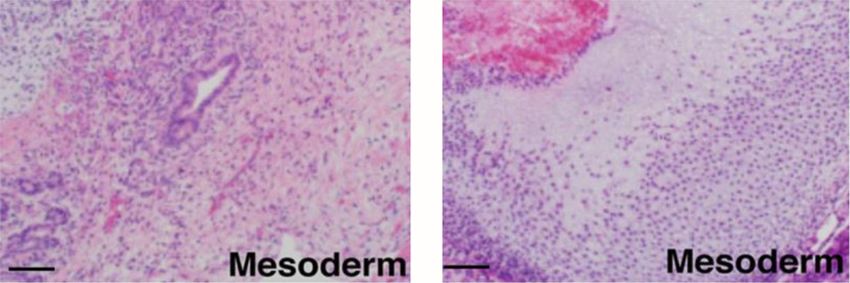
www.jasn.org      BASIC RESEARCH

PEC 8712), Human and Disability Ethics Committee (17/                 Cell lines were routinely tested for mycoplasma contamina-
NTA/204), and biosafety approval (GMO05). The CRL1502                 tion using a MycoAlert Mycoplasma Detection Kit (Lonza)
clone C32 and the cystinosis iPSC lines were developed in             according to manufacturer’s instructions.
Dr Wolvetang’s 42 and Dr. Davidson’s laboratory, respec-                 For starvation/refeeding experiments, cells were grown on
tively. For the patient-derived cystinosis lines (CTNS2/2 ),          12-well culture plates until 70% confluent and incubated for
adipose-derived mesenchymal cells were derived from a                 2 hours in fresh culture medium (basal condition). For star-
small fat sample (,1 g) taken from the kidney of an indi-             vation, cells were washed twice in PBS and incubated in HBSS
vidual with nephropathic cystinosis undergoing renal trans-           for 1 hour. Refeeding was performed by incubating cells in
plantation. The sample was processed to obtain a stromal              normal culture medium for the indicated time points.
vascular fraction (SVF) by washing the fat sample in equal
volumes of PBS and digesting extracellular matrix at 37°C             Generation of CTNS-KO Lines by Gene Editing
for 30 minutes with 0.075% collagenase. Enzyme activity               Guide RNA (gRNA) pairs targeted to introduce a 257-bp de-
was neutralized with DMEM containing 10% FBS and                      letion in exon 8 and 9 of the CTNS gene were designed using
centrifuged at 1200 3 g for 10 minutes to obtain a high-              RGEN (http://www.rgenome.net/cas-designer/) and COS-
density SVF pellet. The pellet was resuspended in 160 ml              MID (http://crispr.bme.gatech.edu/) online tools.44,45 KO ef-
ammonium chloride and incubated at room temperature                   ficiencies were first evaluated in HEK293 cells. Optimal
(RT) for 10 minutes to lyse contaminating red blood cells.            gRNAs (gRNA_ex81.0, 59-TCCACCCCCTGCAGTGTCATT
The SVF was collected by centrifugation as above and filtered          GG-39; gRNA_ex93.0, 59-GCGTGAGGACAACCGCGTGCA
through a 100-mm nylon mesh to remove cellular debris and             GG-39) were cloned into the pSPCas9(BB)-2A-green fluores-
incubated overnight at 37°C with 5% carbon dioxide in                 cent protein (GFP) plasmid (48138; Addgene) and introduced
DMEM with 10% FBS, 1% antibiotic/antimycotic solution.                into CRL1502 iPSCs by reverse transfection using TransIT-LT1
After incubation, plates were washed extensively with PBS to          (Mirus Bio). GFP-positive cells were isolated 48 hours later by
remove residual red blood cells. For transduction, 13106              flow cytometric sorting and 8000 cells were plated on a 10-cm
adipose-derived mesenchymal cells were seeded 24 hours                Geltrex-coated dish into prewarmed mTeSR1 containing
prior in T75 flasks. Cells were infected with a lentiviral             5 mM Y27632. Medium changes were carried out daily using
doxycycline-inducible polycistronic vector containing                 mTeSR1 without Y27632. Single colonies were manually
OCT4, SOX2, CMYC, KLF4, and NANOG. Five days after                    picked when they reached a suitable size (approximately
transduction, cells were passaged using trypsin and replated          10 days postplating), clonally expanded, and screened for bial-
at different densities between 53104 and 53105 cells per              lelic deletions using PCR primers flanking the deleted region
10 cm on MEF feeder layers. To induce reprogramming,                  (forward CTNS1_primer, 59- CTCCACCCCCGCCAGTCCTC-
culture medium was replaced 48 hours later by media sup-              39; reverse CTNS_1primer, 59-TCTGTGCACGGCTCTCAGC-
plemented with doxycycline (2 mg/ml). Human iPSC colo-                39). Homozygote deletions were verified by Sanger sequencing.
nies were picked manually based on morphology between 4               Three clones, KO 15, 32, and 73 were expanded and karyotyped.
and 8 weeks after doxycycline induction. Five CTNS2/2
iPSC lines were generated, three of which (36, 108, 157)              Generation of Cystinotic Kidney Organoids
displayed a normal karyotype (determined by LabPLUS,                  We used a protocol developed in-house to convert iPSCs into
Auckland, New Zealand). These lines were confirmed to be               kidney organoids.46 Briefly, iPSCs were cultured on 10-cm
pluripotent based on immunostaining of cell surface mark-             Geltrex-coated dishes to approximately 40%–50% confluency,
ers (SSEA-4, TRA-1-60, TRA-1-81) and the formation of                 then washed twice with 13 PBS, and treated with 1 mg/ml
teratomas after transplantation of 13106 cells under the              Dispase for 6 minutes at 37°C. Dispase was removed and cells
kidney capsule of 8-week-old SCID mice (n53 mice per                  were washed twice with 13 PBS. Using a cell scraper, cells are
line), according to established procedures.43                         manually lifted from the dish; resuspended in BPEL medium47
   All iPSC lines were cultured on LDEV-free, hESC-qualified,          containing 8 mM CHIR99021, 3 mM Y27632, and 1 mM
Geltrex-coated tissue culture dishes in mTeSR1 (Stemcell              b-mercaptoethanol; and evenly distributed into ultra-low at-
Technologies) medium supplemented with 1% penicillin-                 tachment, 6-well plates (Corning). Half medium changes were
streptomycin, and 2.5 mg/ml Plasmocin (InvivoGen). At ap-             carried out on day 2 with BPEL supplemented with 8 mM
proximately 70% confluence, cells were dissociated using 1/3           CHIR99021. On day 3, embryoid bodies (EBs) were allowed
Accutase in Dulbecco PBS (DPBS). Cells were scraped from              to sediment in a 50-ml tube and washed twice with PBS. EBs
the dish, pelleted at 800 rpm for 5 minutes, and resuspended in       were returned to the ultra-low 6-well plate and transferred to
mTeSR1 plus 5 mM Y27632 dihydrochloride (Stemcell Tech-               stage II media (DMEM, 15% KnockOut Serum Replacement
nologies) for the first 24 hours to facilitate cell survival. Unless   [Thermo Fisher], 1% nonessential amino acids, 1% penicillin/
otherwise stated, all drug treatments (100 nM everolimus,             streptomycin, 1% HEPES, 1% GlutaMAX, 0.05% polyvinyl
RAD001; Selleckchem; 1 mM cysteamine, 30 mM 3-                        alcohol, 2.5 mg/ml Plasmocin) and grown for various periods
methyladenine, 50 mM sucrose; Sigma) were added to cell               of time (up to 2 weeks). Tubule formation was observed on day
culture medium and incubated with the cells for 24 hours.             7– 8. Typically, 60%– 80% of the EBs become kidney

JASN 31: ccc–ccc, 2020                                                                                Dual Therapy for Cystinosis    3
BASIC RESEARCH   www.jasn.org

organoids. All drug treatments on organoids were adminis-        DQ-BSA Assay
tered on day 13 until day 14 when organoids were harvested       iPSCs were seeded onto Geltrex-coated, 35-mm Fluro dishes
for downstream analysis.                                         48 hours before imaging. On the day of the assay, cells were
                                                                 washed with 13 DPBS before incubation with 20 mg/ml work-
Immunostaining                                                   ing solution of DQ-BSA green (Invitrogen) in mTeSR1 for
Cells were washed with Tris-buffered saline (TBS) and fixed       3 hours. Hoechst 33258 was added for the final 15 minutes.
in 4% paraformaldehyde (PFA)/PBS (w/v) for 10 minutes at         After incubation, cells were washed with DPBS and replen-
RT. After three washes, fixed cells were blocked at RT for at     ished with fresh mTeSR1 media. Images were taken using a
least an hour in blocking solution (TBS containing 2% BSA        Zeiss LSM710 confocal microscope.
[w/v] and 10% normal horse serum with 0.1% Triton X-100
[v/v]). Cells were incubated with primary antibody               Apoptosis Assay
(Supplemental Table 1) in the blocking solution overnight        The ApopTag Plus Fluorescein In Situ Detection Kit (Millipore)
at 4°C in a humidified chamber. After 24 hours, cells were        was used to detect apoptosis following the manufacturer’s
washed three times with 13 TBST (TBS containing 0.1%             instructions. Briefly, cells were seeded onto Geltrex-coated,
Triton X-100 [v/v]) and incubated with secondary anti-           35-mm Fluro dishes 48 hours before imaging. Cells were fixed
bodies (Supplemental Table 2) at 1:500 dilution in the block-    with 1% PFA for 10 minutes at RT. Cells were washed twice
ing solution for 2 hours at RT. Cells were incubated with        with 13 PBS for 5 minutes. Precooled ethanol/acetic acid in a
10 mg/ml Hoechst 33258 for 5 minutes, washed twice with          ratio of 2:1 was added for 5 minutes at 220°C to postfix cells.
TBST, and mounted with ProLong Gold (Thermo Fisher)              Cells were washed twice with 13 PBS. Equilibration buffer
before imaging. Cells were imaged using a Zeiss LSM710           (75 ml) was added immediately for 10 seconds, followed by
confocal microscope.                                             55 ml working strength terminal deoxynucleotidyl transferase
                                                                 enzyme, and incubated for 1 hour at 37°C. Working strength
Immunochemistry of Organoids                                     stop/wash buffer was added and incubated for 10 minutes at
Organoids were fixed in 4% PFA/PBS overnight at 4°C. After        RT. Cells were washed three times before applying anti-
washing with 13 PBS plus 0.1% Tween 20, organoids were           digoxigenin conjugate and incubating for 30 minutes in the
transferred into an embedding mold and filled with embed-         dark at RT. Cells were washed four times and Hoechst 33258
ding medium (1% low-melting agarose, 0.9% agar, 5% su-           was added for 15 minutes before mounting with ProLong
crose). Once solidified, the blocks were transferred into 70%     Gold and adding coverslips. Images were taken using a Zeiss
ethanol and incubated at 4°C overnight. Over the next 2 days,    LSM710 confocal microscope.
the blocks were transferred through a series of 95% and 23
100% ethanol, 50:50 ethanol/xylol, 100% xylol, 1 hour each,      Transmission Electron Microscopy
rocking at RT, followed by 50:50 xylol/paraffin at 65°C over-     Samples (dissociated iPSCs or whole kidney organoids) were
night, and changes of paraffin every 4 hours. After embedding,    fixed in 2.5% glutaraldehyde and 0.1 M phosphate buffer, pH
the blocks were sectioned at 6 mm on a Leica microtome.          7.4, at 4°C and kept in the fixative until processing. Samples
Sections were air dried and then stored at 4°C. Immunohis-       were washed three times with 0.1 M phosphate buffer for
tochemistry was performed using standard procedures. Paraf-      10 minutes, then fixed in 1% osmium tetroxide in 0.1 M phos-
fin sections were deparaffinized at 65°C for 30 minutes, then      phate buffer for an hour at RT, and washed twice in 0.1 M
incubated in two changes of xylol (10 minutes each). Antigen     phosphate buffer for 5 minutes. The samples were then dehy-
retrieval (10 mM sodium citrate buffer plus 0.05% Tween 20,      drated in a graded series of ethanol washes for 10 minutes each
pH 6.0, at 95°C for 30 minutes) was carried out for all anti-    at RT (50%, 70%, 90%, and twice at 100%), followed by two
bodies. Immunostainings were imaged using a Zeiss LSM710         propylene oxide washes for 10 minutes at RT. The samples
or Leica SP8 confocal microscope. For a list of antibodies see   were then infiltrated with a graded series of propylene ox-
Supplemental Tables 1 and 2.                                     ide/resin mix (2:1, 1:1, 1:2) for 30 minutes each, before being
                                                                 embedded in freshly made pure resin overnight. The next day,
Magic Red-Cathepsin B Staining                                   the samples were placed into molds and polymerized at 60°C
At 48 hours before imaging, iPSC cells were seeded onto          for 48 hours. All washes were performed on a rocker. Sec-
Geltrex-coated, 35-mm Fluro dishes (WPI). Before staining,       tioned samples were imaged using a Tecnai G2 Spirit Twin
cells were washed once with 13 DPBS. Cells were incubated        transmission electron microscope.
for 1 hour with 263 Magic Red Cathepsin B (Bio-Rad, Her-
cules, CA) in mTeSR1. Hoechst 33258 was added for the final       Transient Transfection of iPSCs and Kidney Organoids
15 minutes. Once staining was completed, the dyes were           For reverse transfection, 1 mg of plasmid was incubated with
washed off with 13 DPBS and the cells were fixed with 4%          2 ml TransIT-LT1 and 100 ml OptiMem (Gibco) for 15 minutes
PFA for 10 minutes. Cells were mounted with ProLong Gold         at RT. DNA complexes were added to Geltrex-coated, 35-mm
and coverslips were added. Images were taken using a Zeiss       Fluro dishes containing either mTeSR1 (iPSCs) or stage II
LSM710 confocal microscope.                                      media (organoids) for 15 minutes at RT. iPSCs were

4        JASN                                                                                               JASN 31: ccc–ccc, 2020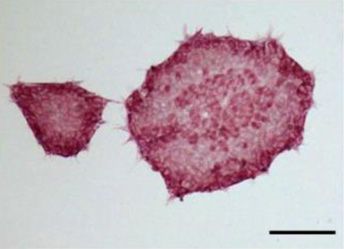
www.jasn.org      BASIC RESEARCH

dissociated using 1/3 Accutase. Organoids were dissociated by        enlarged vesicles, particle analysis was performed and the
incubating them in 100 ml TrypLE Express (gibco) at 37°C for         number of vesicles .10 mm 2 were determined per field.
up to 10 minutes. Once dissociated, cells were centrifuged at        Data were expressed as average number of enlarged vesicles
800 3 g for 5 minutes and resuspended in mTeSR1/stage II             per cell and statistically analyzed. For the measurement of
media. A total of 13106 cells were then added to the dish            autophagic puncta, cells were transfected with the LC3-
containing DNA complexes and incubated at 37°C overnight.            mCherry-GFP vector and imaged by confocal microscopy
Cells were analyzed 24 hours post-transfection.                      (10 random fields per condition containing approximately
                                                                     one to three cells in three independent experiments) and an-
Immunoblotting                                                       alyzed using ImageJ. Nuclei and red and yellow puncta were
Cells were seeded onto 12-well plates at 2.53105 cells per well      manually counted using the ImageJ counting tool and the
24–48 hours before the experiment. Cells were washed twice           percentage of each puncta per cell was calculated.
in ice-cold PBS and scraped on ice into 80 ml of ice-cold radio-        ApopTag Plus–treated cells were viewed at 203 magnifica-
immunoprecipitation assay buffer supplemented with prote-            tion (approximately 10 random fields per condition) and
ase (cOmplete Mini; Roche) and phosphatase inhibitors                images analyzed using ImageJ. Nuclei and green puncta (apo-
(1 mM sodium orthovanadate, 100 mM sodium fluoride,                   ptotic bodies) were manually counted using the ImageJ count-
1 mM b-glycerol phosphate, 2.5 mM sodium pyrophosphate).             ing tool and the percentage of apoptotic bodies per cell was
Samples were centrifuged at 12,000 3 g for 10 minutes at 4°C.        calculated for each condition.
Protein content of the supernatant was determined using the
Pierce BCA Protein Assay Kit (Thermo Scientific, Rockford,            HPLC–Tandem Mass Spectrometry for Cystine
IL). Equal amounts of protein were boiled in Laemmli buffer          Measurements
at 95°C for 5 minutes. A total of 20 mg of protein was separated     A benchtop triple quadrupole mass spectrometer, Agilent
by SDS-PAGE and transferred to nitrocellulose membranes              6140 (Agilent Technologies, Palo Alto, CA), operated in pos-
(Bio-Rad) using the semidry Trans-Blot Turbo device (Bio-            itive ionization mode with the multimode ionization probe
Rad). Membranes were blocked in 5% BSA in TBST for 1 hour            source was used to determine the concentration of cystine.
at RT, and probed using specific antibodies for LC3BII                This was coupled to an Agilent 1200 HPLC system (Agilent
(1:1000), p-P70S6K Thr389 (1:500), P70S6K (1:1000),                  Technologies). Samples were prepared as outlined by Jamal-
p-RPS6Ser235–236 (1:1000), RPS6 (1:1000), 4EBP-1 (1:1000),           poor et al.50 Briefly, frozen cell pellets were resuspended and
p-EIF4ESer209 (1:1000), EIF4E (1:2000) (3868, 9205, 2078,            thawed in 100 ml NEM (5 mmol/L in 0.1 M sodium phosphate
4856, 2317, 9644, 9741, and 9742 respectively; Cell Signaling        buffer, pH 7.2) on ice. Cells were sonicated on ice three times
Technologies), and b-actin (A2228, 1:10,000; Sigma). Primary         for 10 seconds with 20 seconds cooling intervals (one cycle,
antibodies were incubated overnight at 4°C with gentle agitation.    80% amplitude). Protein was precipitated by adding 50 ml sulfo-
The next morning, membranes were probed with either anti-            salicylic acid (15% w/v) and sample was centrifuged at 20,000 rcf
rabbit or anti-mouse linked to horseradish peroxidase secondary      for 10 minutes at 4°C. Supernatant was recovered and diluted 1:10
antibodies (1:12,000 dilution; Supplemental Table 2) for 1 hour at   in 0.1% formic acid. Avolume of 5 ml of internal standard (20 mM
RT. Membranes were exposed using enhanced chemilumines-              cystine-D4) was added and the sample was pipetted into a glass
cence reagent (ECL Select Kit; GE HealthCare) and chemilumi-         vial. Chromatographic separation was achieved on a Thermo Sci-
nescent signals were captured using the ChemiDoc image device        entific Hypercarb column (2.13150 mm; Thermo Scientific) and
(Bio-Rad). Densitometry analysis of protein bands were quanti-       was maintained at 30°C. The mobile phase consisted of water with
fied using ImageJ software (National Institutes of Health, Be-        0.01% formic acid and acetonitrile (ACN) with 0.1% formic acid
thesda, MD). The intensity of each band was recorded relative        with fast gradient elution at a flow rate of 0.3 ml/min and run time
to a pooled control sample run on each gel.                          of 5 minutes. The sample volume injected was 4 ml and the au-
    4E-BP1 is a phosphoprotein that separates into multi-            tosampler was set at 5°C. Instrument parameters of the mass
ple electrophoretic forms, therefore, to measure their phos-         spectrometer were: gas flow, 6 L/min; gas temperature, 300°C;
phorylation state, the mobility-shift method was used.48,49          vaporizer temperature, 250°C; nebulizer, 40 psi; and capillary
Phosphorylation results in the protein migrating at a higher         voltage, 2500 V. Data were acquired and analyzed with Agilent
apparent molecular mass. Total 4E-BP1 protein was recorded           MassHunter Software. A standard curve was plotted with the ob-
as the expression of all forms of 4E-BP1 (a-, b-, g-, and            served peak area ratio of analyte to the internal standard against
d-forms) and phosphorylation of 4E-BP1 was expressed as              the concentration of the analyte to extract the slope and intercept.
the ratio of the top bands relative to the total protein.
                                                                     Mass Spectrometry for GSH Measurements
Image Analysis of Lysosomes and Fluorescent Puncta                   Cells were lysed on ice with cold 50% ACN and centrifuged at
DQ-BSA and Magic Red confocal raw images at a 633 mag-               16,000 3 g for 10 minutes at 4°C. The supernatant was trans-
nification (approximately 10 random fields per condition)              ferred to a cold Eppendorf tube and stored at 280°C until
were analyzed using ImageJ analysis software. Nuclei were            samples were ready to be processed. A volume of 2 ml of sam-
manually counted. To obtain a cross-sectional area of the            ple was added to 5 ml of a 50% solution of ACN and 50 mM

JASN 31: ccc–ccc, 2020                                                                                  Dual Therapy for Cystinosis    5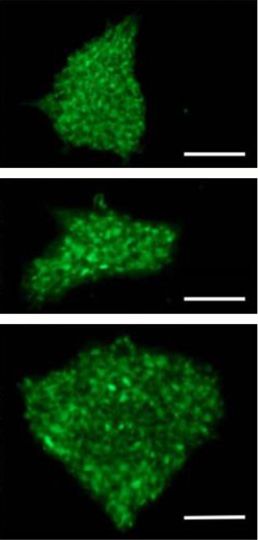
BASIC RESEARCH   www.jasn.org

ammonium bicarbonate (ABC). A volume of 3 ml of sample           OD260/280) of the RNA was determined on Bioanalyser
was treated with either 3 ml 1 mM tris(2-carboxyethyl) phos-     (RNA nano chip), Qubit, and Nanodrop instruments. Library
phine hydrochloride or 2 mM monobromobimane (MBrB) in            preparation and sequencing were performed commercially
50% ACN/ABC and incubated at RT in the dark for 20 min-          (New Zealand Genomics Limited, Otago, New Zealand). Li-
utes. A volume of 3 ml of 2 mM MBrB and 3 ml 50 mM ABC           braries were prepared using the TruSeq standard total RNA kit
was added to the tris(2-carboxyethyl) phosphine hydrochlor-      with standard protocols (Illumina). Paired-end sequencing
ide–treated samples. ACN (6 ml, 25%) was added to the            (23125 bp) was performed on an Illumina HiSeq 2500 se-
MBrB-treated set. Samples were incubated at RT in the dark       quencer. Reads were adapter filtered and quality trimmed us-
for 20 minutes. Following incubation, 950 ml 0.1% formic acid    ing BBDuk version 37.75 with a quality cutoff of phred510
and 5 ml 4.292 mM GSH internal standard was added to all         (trimq510) and, to reduce the potential mapping errors, any
samples. 10 mg HLB SPE cartridges were conditioned with          reads ,50 bp after trimming were removed. Quality con-
0.5 ml methanol followed by 0.5 ml 0.1% formic acid. The         trol–filtered reads were mapped to the human genome
entire sample was loaded onto the conditioned cartridge and      (GRCh38) downloaded from ENSEMBL (www.ensembl.org/
washed with 1 ml 0.1% formic acid. Samples were eluted into      Homo_sapiens/Info/Index) using HISAT2 (version 2.0.5) in
clean tubes with 0.3 ml 10% ACN in 0.1% formic acid. Sam-        stranded mapping mode (–rna-strandness RF). Read counts
ples were spun in a SpeedVac until volumes were reduced to       were generated from the alignment files using HT-Seq (ver-
50–100 ml. Samples were either injected neat or diluted 1:3 in   sion 0.6.0) under the Union mode and strand option set to
0.1% formic acid and run on a QStar XL LC-MS System and          “reverse.” DESeq2 was used to generate differential expression
through an LC column (Zorbax SB-C18, 3.5 mm, 15030.3             calls and statistics for control versus KO comparison based on
mm; Agilent Technologies).                                       the observed read counts for each gene. Expression changes
                                                                 were declared significant for q-value ,0.05. Heatmaps were
ATP Assay                                                        generated in R using the pheatmap_1.0.8 package. Gene On-
Cells were lysed using 13 lysis buffer for 10 minutes on ice.    tology (GO) term enrichments were analyzed using the R
Lysate was centrifuged at 12,000 3 g for 5 minutes at 4°C.       package goseq (version 1.22). Enrichment was tested for all
Supernatant was collected and an ATP Determination Kit (In-      differentially expressed genes with a false discovery
vitrogen) was used as per manufacturer’s directions. Samples     rate–corrected P value ,0.05. The GO terms were also false-
were read using a VICTOR X Multilabel Plate Reader (Perki-       discovery-rate corrected at the same rate.
nElmer). The cell pellet was resuspended in 0.1 M sodium
hydroxide and bicinchoninic acid assay performed 24 hours        Statistical Analysis
later to determine protein concentration.                        Data are presented as the mean6SEM. GraphPad PRISM soft-
                                                                 ware version 7 (GraphPad Software) was used for all statistical
Reabsorption Assay                                               analyses. The statistical significance of the differences between
A total of 20 mg/ml of 10 kDa Texas Red-dextran (Invitrogen)     two groups was calculated using an unpaired t test. For be-
was added to stage II culture medium for 48 hours. Organoids     tween three or more groups, one-way ANOVA was used. A P
were washed in stage II medium for 5 hours before fixation in     value ,0.05 was considered to be statistically significant.
4% PFA, paraffin embedding, and sectioning as
described above.
                                                                 RESULTS
RNA Extraction, cDNA Synthesis, and Quantitative
PCR Analysis                                                     Generation of CTNS-iPSC Lines
Cells were first washed with 13 PBS before being lysed in         The patient-specific CTNS iPSCs were generated as described
GENEzol for 5 minutes. RNA was extracted using GENEzol           in methods from adipose-derived mesenchymal cells grown
TriRNA Pure kit (Geneaid). cDNA was synthesized using            from a fat sample from a patient with nephropathic cystinosis
qScript cDNA SuperMix (Quanta). For quantitative PCR             undergoing renal transplantation. Exon sequencing revealed
(qPCR), PerfeCTa SYBR Green FastMix (Quanta) was used.           compound heterozygosity for two described CTNS mutations:
qPCR was performed on a QuantStudio 6 Flex Real-Time PCR         a 57-kb deletion and an L158P missense mutation in exon 8.2
machine. Primers used are listed in Supplemental Table 3.        Cells were reprogrammed into iPSCs and three CTNS2/2 lines
Samples were normalized to HPRT1 and CREBP expression.           (36, 108, 157) with normal karyotypes (results not shown)
Gene expression was calculated using the ddCt method.51 Er-      were identified. All three lines stained positive for pluripo-
ror bars represent SD from technical triplicates.                tency markers alkaline phosphatase, SSEA-4, Tra-1-60, and
                                                                 Tra-1-81 and gave rise to teratomas containing tissues from
RNA Sequencing and Analysis                                      all three germ layers (Figure 1, A, B and D, data for CTNS2/2
Total RNA from four samples per iPSC line were prepared          36 shown). Re-expression of endogenous OCT4, NANOG,
using the GENEzol TriRNA Pure kit. The quality (RNA integ-       SOX2, CMYC, and KLF4 was confirmed by qPCR
rity number), concentration, and purity (OD260/230 and           (Figure 1C, representative data for CTNS2/236). Because all

6        JASN                                                                                               JASN 31: ccc–ccc, 2020
www.jasn.org BASIC RESEARCH
of these lines displayed similar phenotypes, line 36 was used Overexpression of cystinosin-GFP, which colocalizes with
for subsequent analyses (herein called CTNS2/2). In addition Magic Red1 puncta (Supplemental Figure 1, G–J), reduced
to patient-specific lines, we also generated independent the number of enlarged lysosomes to levels below that seen
CTNS-KO lines by performing CRISPR/Cas9 gene editing in in control iPSCs (Figure 2N).
CRL1502 iPSCs.42 gRNAs were used to introduce a 257-bp To assess trafficking through the endocytic pathway, CTNS
deletion in exon 8 and 9 of the CTNS gene, resulting in de- iPSCs and control iPSCs were incubated with DQ-BSA, a
letion of the second transmembrane domain (Figure 1, E and fluid-phase probe that becomes fluorescent when it reaches
F). Three lines with homozygote deletions (KO 15, 32, and 73) the lysosome, for 3 hours.53 Quantitation of positive puncta
were identified by Sanger sequencing. Because all three CTNS per cell showed that CTNS iPSCs had similar numbers of
knockout (CTNS KO ) lines displayed a similar phenotype puncta compared with control iPSCs (average 5.6 total puncta
(Supplemental Figure 1, A, B and C), CTNSKO line KO73 per cell for CTNS iPSCs and 7.8 total puncta per cell for con-
was used for subsequent experiments. trol iPSCs; Supplemental Figure 1, K–M). This result is con-
sistent with the endocytic flux of fluid-phase cargos through
CTNS iPSCs Load Cystine the endocytic pathway being relatively normal in CTNS iPSCs,
Cystine was measured in cystinotic and control iPSCs by despite the presence of enlarged lysosomes.
HPLC–tandem mass spectrometry, revealing 33- to 54-fold higher We next sought to phenocopy the enlarged-lysosome phe-
levels in CTNS2/2 and CTNSKO iPSCs compared with the notype of CTNS iPSCs in wild-type cells using sucrose, which
CRL1502 control cells (Figure 2A, Supplemental Table 4). To as- accumulates within lysosomes of normal cells.54,55 Treatment
sess whether cystine levels were responsive to cysteamine, CTNS of control iPSCs with 50 mM sucrose for 24 hours led to an
iPSCs were treated with a dose range of cysteamine (10 mM, increase in the number of enlarged lysosomes, similar to that
100 mM, and 1 mM) for 1 or 24 hours. Whereas 10 mM cyste- seen in CTNS iPSCs, while having no effect on cystine loading
amine had no effect on cystine levels, 100 mM and 1 mM de- (Figure 2, A, C, H and O). This observation supports the no-
creased cystine, with 1 mM being the most effective and signifi- tion that the enlarged-lysosome phenotype of CTNS iPSCs is
cantly reducing cystine levels in CTNS2/2 and CTNSKO iPSCs due to cystine accumulation. To confirm this, treatment of
(Figure 2A, Supplemental Figure 1, D and E). CTNS iPSCs with 1 mM cysteamine for 24 hours resulted in
a reduction in the average number of enlarged lysosomes per
CTNS iPSCs Display Enlarged Lysosomes cell, although it did not completely rescue to control levels
To assess the size and distribution of lysosomes in the cysti- (Figure 2, B and E). The total number of lysosomes per cell
notic iPSCs and to functionally confirm their lysosomal iden- was not significantly affected by cysteamine treatment
tity, the cells were incubated with Magic Red, a substrate that is (Supplemental Figure 1F).
degraded by cathepsin B and fluoresces inside lysosomes and
endolysosomes. Enlarged Magic Red1 puncta were observed GSH, ATP, Apoptosis, and Mitochondria in CTNS iPSCs
more frequently in CTNS iPSCs compared with controls and We next examined GSH, ATP, apoptosis, and mitochondria
tended to cluster in a perinuclear location (Figure 2, B, C and because prior reports suggest these are altered in cystinotic
D). Quantification of the subset of enlarged lysosomes, de- cells.9,15–27 GSH levels (oxidized and reduced), ATP, and ap-
fined as having an optical cross-sectional area of .10 mm2, optosis were quantitated whereas mitochondria were assessed
showed the average number per cell was approximately 2.5- qualitatively by transmission electron microscopy and immuno-
fold higher in CTNS iPSCs compared with controls histochemistry. No significant differences were seen with GSH
(Figure 2B). To further confirm these structures are lysosomes, (Supplemental Figure 1, N and O) or ATP (Supplemental
we examined cystinotic iPSCs with the lysosomal marker Figure 1P). Apoptosis was quantified using the ApopTag de-
LAMP1 by immunofluorescence and at the ultrastructural tection assay and quantitation of positive puncta per cell re-
level by electron microscopy. CTNS2/2 and CTNSKO iPSCs vealed that CTNS iPSCs displayed .1.4-fold greater levels of
were found to contain a mixture of small to enlarged apoptosis compared with controls (Supplemental Figure 1Q).
LAMP11 puncta, whereas control iPSCs show qualitatively Cysteamine treatment was unable to reduce the amount of
fewer enlarged LAMP11 puncta (Figure 2, I, J and K). Con- apoptosis. No overt differences in mitochondrial morphology
sistent with the LAMP1 and Magic Red data, we observed large were observed in CTNS iPSCs compared with controls
degradative/storage-like bodies in CTNS2/2 but not control (Supplemental Figure 1, R–U).
iPSCs by electron microscopy (Figure 2, L and M). As expected
for dysfunctional lysosomes, these bodies contain electron- RNA-Sequencing Analysis Reveals Differentially
dense material, intraluminal vesicles, and undigested mem- Regulated Genes in CTNSKO iPSCs
branes, and likely represent enlarged lysosomes and/or To gain further insights into the phenotype of CTNS iPSCs, we
amphisomes (Figure 2M). To show this phenotype is due performed RNA-sequencing (RNA-seq) to identify differen-
to loss of CYSTINOSIN, we performed rescue experiments tially expressed genes between CTNSKO iPSCs and their iso-
by transfecting CTNS iPSCs with a plasmid encoding genic control cells (n54 biological repeats for each; National
cystinosin-GFP and performed analysis 24 hours later.52 Center for Biotechnology Information BioProject accession
JASN 31: ccc–ccc, 2020 Dual Therapy for Cystinosis 7BASIC RESEARCH www.jasn.org
A B C
100000
Alkaline Phosphatase
Relative expression
SSEA-4
10000
to HPRT1
1000
100
10
TRA-1-60
1
T4 O
G X2 YC F4
O
C
AN SO -M KL
N C
F Exon 8 Exon 9
G C AG T G T C G C G G T T G T C C T C AC
TRA-1-81
D Muscle Bone and Cartilage
Glandular Stroma Keratinized Epithelium
E gRNA-ex8 1.0 PAM
tccacccctgcagTGTCATTGGTCTGAGCTTCGACTTCGTGG CAACGACGTCTTCTTCAGCCTGCACGCGGTTGTCCTCACGCTGAT
PAM gRNA-ex9 3.0
CTNS 5′ 3′
1 2 3 4 5 6 7 8 9 10 11 12
Figure 1. Patient-derived CTNS iPSCs display markers of pluripotency. (A) CTNS2/2 iPSCs stained for stem cell surface antigens
SSEA-4, TRA-1-60, and TRA-1-81. Scale bar, 500 mm. (B) CTNS2/2 iPSCs stained for alkaline phosphatase. Scale bar, 500 mm. (C) qPCR
of endogenous genes relative to HPRT1 expression. Plotted data are mean6SD. (D) Hematoxylin and eosin–stained histologic sections
of tumors derived from SCID mice after injection of CTNS2/2 iPSCs under kidney capsule. All three germ layers were identified:
8 JASN JASN 31: ccc–ccc, 2020www.jasn.org BASIC RESEARCH
number PRJNA591635). We found a total of 12,750 differen- p-S6, p-RPS6, p-4EBP-1, and p-EIF4e levels between the cys-
tially expressed genes with 8792 significantly upregulated and tinotic iPSCs and control cells under basal conditions
3958 significantly downregulated (P,0.05), compared with (Supplemental Figure 3B) and, unlike prior reports,40,41 we
controls. Kyoto Encyclopedia of Genes and Genomes pathway did not detect a delay in the reactivation of mTORC1 at 2.5, 7,
analysis revealed several significantly enriched pathways in 12, or 15 minutes after refeeding (Supplemental Figure 3B and
CTNS KO iPSCs that include the ribosome, spliceosome, data not shown). Together, these observations indicate there
proteasome, oxidative phosphorylation, protein processing in are no significant defects in mTORC1 activity in CTNS iPSCs
the endoplasmic reticulum, and ubiquitin-mediated proteoly- under basal conditions or after starvation.
sis (cutoff P,131026; Table 1). Interestingly, pathways linked
to Huntington, Parkinson, and Alzheimer disease were en- Basal Autophagy Flux is Perturbed in CTNS iPSCs
riched.56 GO term enrichment analysis yielded a much more Of the autophagy-related genes identified in the GO term
extensive list of gene sets that was more difficult to summarize analysis, there are genes involved in early through to late
(data not shown). However, in the “biological process” cate- processes of autophagy including autophagosome formation
gory, we found enrichment for pathways implicated in cysti- (SQSTM1, BECLIN1, LC3B, RAB7A), movement (HDAC6),
nosis including autophagy, vesicle trafficking, redox homeostasis, and tethering and fusion (RUBICON, UVRAG, VPS16,
the mTOR pathway, and protein catabolism (Table 2). VAMP8, STX17, TSNARE1, STX17, SNAP29; these and others
We next examined whether some of the differentially ex- are shown in Figure 3C). In most cases, these genes are upre-
pressed genes would have utility as molecular biomarkers of gulated in CTNS KO iPSCs compared with controls
the cystinotic phenotype. From the top 50 differentially ex- (Figure 3C). Notably, an increase in SQSTM1/p62 can be in-
pressed genes (Supplemental Figure 2), we focused on DDIT3 dicative of a block in autophagy flux.
(also known as CHOP), which encodes a transcription factor To explore basal autophagy levels, we first measured the
belonging to the “integrated stress response” involved in cel- levels of autophagosome-specific protein LC3B-II by Western
lular adaptation to stress.57 In addition, we identified two blotting. Consistent with RNA-seq data, we found higher levels
downstream targets of DDIT3: TRIB3, encoding a pseudoki- of LC3B-II in CTNS2/2 iPSCs compared with control iPSCs,
nase that acts as a negative feedback regulator of DDIT3,58 and indicating either an increase in the number of autophagosomes
CHAC1, encoding an enzyme that degrades GSH.59 Using or a decrease in autophagosome degradation (Figure 4A). To
qPCR we independently confirmed that DDIT3, TRIB3, and quantify autophagosome and autolysosome numbers, we
CHAC1 were significantly upregulated in CTNS iPSCs com- transfected CTNS iPSCs and control iPSCs with a plasmid en-
pared with control iPSCs (Figure 3A, Supplemental coding the mCherry-LC3B-GFP sensor that fluorescently la-
Figure 3A). To assess whether the expression of this gene triad bels autophagosomes in yellow and autolysosomes in red.62 At
is responsive to cysteamine, we treated CTNS iPSCs with 24 hours post-transfection, cells were analyzed and we found
1 mM cysteamine for 24 hours and found that they signifi- that under basal conditions CTNS2/2 cells have approximately
cantly decreased to near-control levels. Incubation of control 2.6-fold higher levels of yellow puncta (autophagosomes) com-
iPSCs with 50 mM sucrose for 24 hours also resulted in a pared with control iPSCs (Figure 4, B and C).
significant upregulation of DDIT3, TRIB3, and CHAC1, indi- To assess flux through the autophagy pathway, we treated
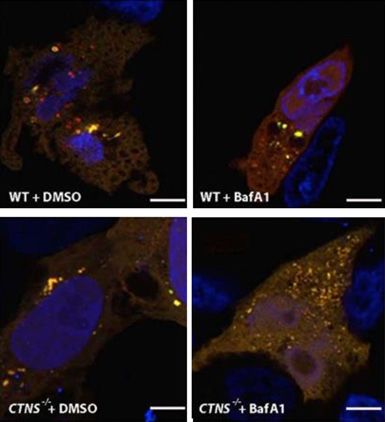
cating that these genes, although not specific biomarkers of CTNS iPSCs and control iPSCs expressing the mCherry-
cystinotic cells per se, may “read out” lysosomal dysfunction LC3B-GFP sensor with 400 nM BafA163 for 4 hours. Although
caused by the accumulation of substrates (Figure 3B). BafA1 induced a 2.7-fold increase in the percentage of yellow
puncta in control iPSCs compared with vehicle (DMSO)-
The mTORC1 Pathway Appears Unaffected in CTNS treated cells, only a slight but nonsignificant increase was
iPSCs seen in CTNS iPSCs (Figure 4, B, C and D). To confirm the
Closer scrutiny of the autophagy genes identified from the GO autophagy defect was specific to a loss of CYSTINOSIN, we
term analysis revealed that CTNSKO iPSCs show a slight up- cotransfected CTNS2/2 iPSCs with a cystinosin-encoding
regulation of MTOR as well as two of its downstream targets plasmid, pCMV-CFP (to allow tracking of transfected cells)
(ULK1 and ATG13) compared with control cells (Figure 3C). and mCherry-LC3B-GFP, resulting in an approximately 1.2-
To assess mTORC1 activity in CTNS iPSCs we performed fold reduction in the percentage of yellow puncta (Figure 4, E
Western blotting in triplicate for phosphorylated S6, RPS6, and F). Taken together, these results indicate that loss of CYS-
4EBP-1, and EIF4e (all downstream targets of mTORC1), un- TINOSIN in iPSCs causes an accumulation of autophagosomes
der basal conditions and after starvation for 60 minutes, fol- under basal conditions due to reduced fusion of lysosomes with
lowed by refeeding.60,61 We found no statistical difference in autophagosomes.
mesoderm, endoderm, and ectoderm (n53). Scale bar, 100 mm. (E) Schematic overview of the CRISPR-based strategy to disrupt the
CTNS gene in wild-type iPSCs. The extent of the deletion in exon 8 and exon 9 is marked with black arrowheads. (F) Sanger sequencing
chromatogram shows resulting sequence in CTNSKO iPSCs. PAM, protospacer adjacent motif.
JASN 31: ccc–ccc, 2020 Dual Therapy for Cystinosis 9BASIC RESEARCH www.jasn.org
A B
**** >10 μm2 Magic red vesicles
Cystine (nmol/mg protein)
4.0 ****
#lysosome >10 μm2/cell
**** **** 0.8
***
3.0 *** *** **
*** 0.6 #
2.0 $
0.4 $ #
$$$
1.0 ####
0.2
0.0 0.0
WT control
WT + sucrose
CTNS -/- control
CTNS -/- + Cysteamine
CTNS -/- + Everolimus
CTNS -/- + combo
CTNS KO control
CTNS KO + Cysteamine
CTNS KO + Everolimus
CTNS KO + combo
WT control
CTNS -/- control
CTNS -/- + Cysteamine
CTNS -/- + Everolimus
CTNS -/- + combo
CTNS KO control
CTNS + Cysteamine
CTNS KO + Everolimus
CTNS KO + combo
KO
N O
>10 μm2 Magic red vesicles >10 μm2 Magic red vesicles
#lysosome >10 μm2/cell
*
#lysosome >10 μm2/cell
0.6 **** 1.0 **
*** 0.8
0.4 0.6
0.4
0.2 0.2
0.0
0.0 -0.2
e
us
l
or
ro
id
or
os
ct
im
nt
m
ct
cr
ve
co
as
ol
ve
su
er
y
pl
T
y
pt
+
Ev
W
pt
S
em
T
em
TN
+
W
+
e
C
+
os
T
-/-
+
W
cr
-/-
S
su
TN
S
TN
+
C
T
C
W
Figure 2. CTNS iPSCs display cystine accumulation and enlarged lysosmes. (A) Amount of cystine (nmol/mg of protein) in wild type
(WT), CTNS2/2 iPSCs, and CTNSKO iPSCs with various treatments (1 mM cysteamine; 100 nM everolimus; combo, 1 mM cysteamine
and 100 nM everolimus; 24 hours). One-way ANOVA performed, data plotted as mean6SEM, three independent experiments.
10 JASN JASN 31: ccc–ccc, 2020www.jasn.org BASIC RESEARCH
The basal autophagy block in CTNS iPSCs may be caused significant effect on cystine levels in CTNSKO iPSCs but caused
by the accumulation of cystine in the lysosome. To explore a 1.5-fold increase in CTNS2/2 iPSCs (Figure 2A). Combina-
this, we treated control iPSCs with 50 mM sucrose for 24 hours tion treatment decreased cystine in both cystinotic iPSC lines
and then transfected them with the mCherry-LC3B-GFP sen- to levels similar to cysteamine treatment alone (Figure 2A),
sor. We found that the percentage of yellow puncta increased indicating that activation of the mTORC1 pathway does not
1.5-fold in sucrose-loaded cells compared with control cells, interfere with the ability of cysteamine to deplete cystine.
indicative of a reduction in basal autophagic flux (Figure 4G).
Given this, we next tested whether treatment with cysteamine mTORC1 Inhibition Reduces Enlarged Lysosomes in
would ameliorate the basal autophagy flux defect of CTNS CTNS-iPSCs via Autophagy
iPSCs transfected with the mCherry-LC3B-GFP sensor. Un- Next we examined the effect of everolimus treatment on the
expectedly, we found that cysteamine treatment did not enlarged lysosome phenotype. We found that everolimus re-
greatly improve basal autophagy flux (Figure 4, H and I). duces the average number of enlarged lysosomes to near-
We conclude that the basal autophagy defect in CTNS iPSCs normal levels, making it more effective than cysteamine alone
is caused by a loss of CYSTINOSIN but this cannot be ame- (Figure 2B). Qualitatively, we found that everolimus reduced
liorated by cysteamine treatment. perinuclear clustering of the lysosomes, but this could not be
quantified due to the high cell density and small cytoplasmic
Basal Autophagy Flux Defects Are Rescued in CTNS volume of the iPSC cultures (Figure 2F).
iPSCs by mTORC1 Inhibition Combined everolimus/cysteamine treatment yielded inter-
The failure of cysteamine to restore basal autophagy flux in mediate results with an approximately twofold reduction
CTNS iPSCs may provide a rationale for why cysteamine compared with untreated CTNS iPSCs, indicating that cyste-
therapy is not curative and led us to speculate that activating amine interferes with the ability of everolimus to reduce the
autophagy via mTORC1 inhibition may provide additional number of enlarged lysosomes (Figure 2, B and G). In addi-
therapeutic benefit. To test this, we treated CTNS iPSCs for tion, everolimus treatment reduced the number of enlarged
24 hours with 100 nM everolimus and examined basal auto- lysosomes induced by sucrose loading, suggesting that its ef-
phagy flux. We found that everolimus restores the number of fects on the lysosome are not specific to cystinotic cells
yellow puncta (autophagosomes) to control levels and cor- (Figure 2O). The total number of lysosomes was unaffected
respondingly increased the number of autolysosomes, in by treatments (Supplemental Figure 1F.
agreement with similar results reported using Ctns2/2 To determine if the action of everolimus on enlarged lyso-
mouse fibroblasts (Figure 4, H and I).33 Importantly, dual somes was dependent on autophagy, we investigated the ef-
treatment of 1 mM cysteamine and 100 nM everolimus had fects of 3-methyladenine (3-MA), an inhibitor of autophagy
similar effects as everolimus alone, without any sign of com- that acts downstream of mTORC1.64 First, we treated control
bination toxicity (Figure 4, H and I). and CTNS iPSCs for 24 hours with 30 mM of 3-MA alone. We
observed an approximately four- to fivefold increase in the
Cystine Levels Remain High in CTNS iPSCs after number of enlarged lysosomes per cell in control iPSCs
mTORC1 Inhibition whereas levels in CTNS2/2 and CTNSKO iPSCs did not signif-
We then assessed cystine levels in everolimus and combined icantly increase further (Figure 4, J and K). Treating CTNS
everolimus/cysteamine-treated cells. Everolimus alone had no iPSCs with both 3-MA and everolimus failed to have any
**P,0.01, ***P,0.001, ****P,0.0001. (B) Graph displaying quantification of the average number of Magic Red vesicles (lysosomes)
per cell over 10 mm2. One-way ANOVA performed (n5600 cells from eight to ten random fields per condition, 20 cells per field, three
independent experiments), data plotted as mean6SEM. ***P50.001, WT control versus CTNS2/2 control; **P,0.01, WT control versus
CTNSKO control; $P,0.05, CTNS2/2 control versus CTNS2/2 1 mM cysteamine and CTNS2/2combination; $$$P,0.001, CTNS2/2
control versus CTNS2/2100 nM everolimus; #P,0.05, CTNSKO control versus CTNSKO 1 mM cysteamine and CTNS2/2combination;
###
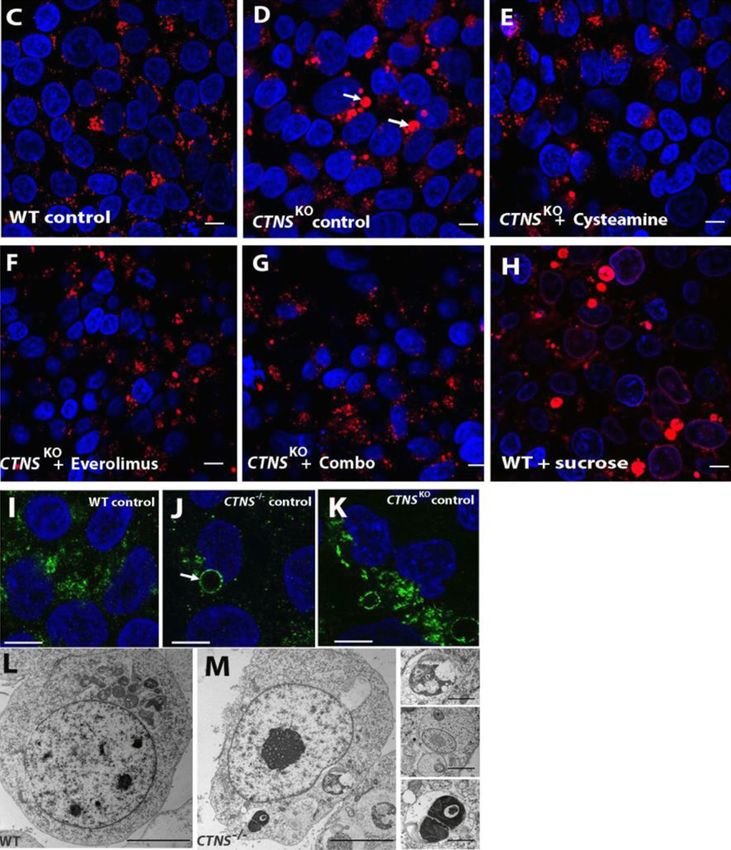
P,0.001, CTNSKO control versus CTNSKO 100 nM everolimus. (C–H) Representative images of fluorescent staining with Magic Red
in WT control, CTNSKO control, and CTNSKO with treatments (1 mM cysteamine; 100 nM everolimus; combo, 1 mM cysteamine and
100 nM everolimus; 24 hours) and WT iPSCs treated with 50 mM sucrose for 24 hours. Scale bar, 10 mm. (I) Representative immu-
nofluorescence staining with anti-LAMP1 (green) in WT iPSCs, and (J) CTNS2/2 and (K) CTNSKO iPSCs, respectively. Arrow indicates
enlarged vesicles. Scale bar, 10 mm. (L and M) Transmission electron micrograph of (L) WT and (M) CTNS2/2 iPSCs showing enlarged
vesicles. Scale bars, 5 mm in (L) and 1 mm in (M). (N) Graph displaying quantification of the average number of Magic Red vesicles per
cell over 10 mm2 in WT iPSCs and CTNS2/2 iPSCs overexpressing empty vector (pcDNA 3.1) or exogenous CTNS-GFP. One-way
ANOVA performed (n5300 cells from five to eight random fields per condition, 20 cells per field, three independent experiments), data
plotted as mean6SEM. ***P,0.001, ****P,0.0001. (O) Average number of Magic Red vesicles per cell over 10 mm2. WT iPSCs treated
with 50 mM sucrose or sucrose and 100 nM everolimus for 24 hours. One-way ANOVA performed (n5300 cells from five random fields
per condition, 20 cells per field, three independent experiments), all data are plotted mean6SEM. *P,0.05, **P,0.01. CTNSKO,
CRISPR-generated cystinotic KO iPSCs. Nuclei counterstain in (C–H) and (I–K) was Hoechst.
JASN 31: ccc–ccc, 2020 Dual Therapy for Cystinosis 11BASIC RESEARCH www.jasn.org
Table 1. Kyoto Encyclopedia of Genes and Genomes pathways significantly enriched in CTNSKO iPSCs (cutoff P,131026)
Entry Name Class P Value numDEInCat numInCat
hsa03010 Ribosome; Homo sapiens (human) Genetic information processing; translation p,0.001 81 87
hsa05016 Huntington disease; H. sapiens (human) Human diseases; neurodegenerative diseases p,0.001 134 182
hsa05012 Parkinson disease; H. sapiens (human) Human diseases; neurodegenerative diseases p,0.001 93 129
hsa04110 Cell cycle; H. sapiens (human) Cellular processes; cell growth and death p,0.001 105 124
hsa03040 Spliceosome; H. sapiens (human) Genetic information processing; transcription p,0.001 101 127
hsa03008 Ribosome biogenesis in eukaryotes; H. Genetic information processing; transcription p,0.001 66 76
sapiens (human)
hsa00190 Oxidative phosphorylation; H. sapiens Metabolism; energy metabolism p,0.001 90 131
(human)
hsa04141 Protein processing in endoplasmic reticulum; Genetic information processing; folding, p,0.001 130 166
H. sapiens (human) sorting, and degradation
hsa04120 Ubiquitin-mediated proteolysis; H. sapiens Genetic information processing; folding, p,0.001 111 135
(human) sorting, and degradation
hsa03013 RNA transport; H. sapiens (human) Genetic information processing; translation 116 150
p,0.001
hsa05010 Alzheimer disease; H. sapiens (human) Human diseases; neurodegenerative diseases p,0.001 116 166
hsa03050 Proteasome; H. sapiens (human) Genetic information processing; folding sorting, p,0.001 37 44
and degradation
significant effect on the number of enlarged lysosomes (Fig- DDIT3, TRB3, and CHAC1. In both CTNS2/2 and CTNSKO
ure 4, J and K), providing strong evidence that the effects of iPSCs, everolimus alone and combined treatment significantly
everolimus are mediated via stimulation of autophagy. reduced the expression levels of the gene triad to near-control
levels, in keeping with the notion that these genes are provid-
Everolimus Reduces the Levels of Apoptosis in CTNS ing a readout of lysosome dysfunction in iPSCs (Figure 3A,
iPSCs Supplemental Figure 3A).
Everolimus alone and combined treatment reduced the level of
apoptosis in CTNS iPSCs (Supplemental Figure 1Q), indicat- Characterization of Cystinotic Kidney Organoids
ing that cysteamine does not interfere with the ability of ever- Having established the potential therapeutic effects of com-
olimus to decrease apoptosis. bined everolimus/cysteamine treatment in CTNS iPSCs, we
next assessed whether these compounds would show efficacy
Everolimus Reduces Expression of CHOP, TRB3, and on human cystinotic kidney tissue, using a kidney organoid pro-
CHAC1 in CTNS iPSCs tocol we developed. 46 Using this approach, we matured
We then assessed the effects of everolimus alone and combined CTNS2/2, CTNSKO, and control cells into kidney organoids for
everolimus/cysteamine treatment on the expression of 14 days.46 Similar to our results obtained with undifferentiated
Table 2. GO Terms in biologic process category enriched in CTNSKO iPSCs
GO Term Term P Value numDEInCat numInCat
GO:0016192 Vesicle-mediated transport p,0.001 769 1281
GO:0016236 Macroautophagy p,0.001 202 299
GO:0006914 Autophagy p,0.001 269 416
GO:0045454 Cell redox homeostasis p,0.001 46 58
GO:0000045 Autophagosome assembly p,0.001 57 74
GO:0045022 Early endosome to late endosome transport p,0.001 32 36
GO:0006900 Membrane budding p,0.001 56 72
GO:0000422 Mitophagy p,0.001 132 200
GO:0032006 Regulation of Tor signaling p,0.001 50 63
GO:0006890 Retrograde vesicle-mediated transport, Golgi to endoplasmic reticulum p,0.001 31 36
GO:1901800 Positive regulation of proteasomal protein catabolic process p,0.001 67 93
GO:0032008 Positive regulation of TOR signaling p,0.001 23 26
GO:0032436 Positive regulation of proteasomal ubiquitin-dependent protein catabolic process p,0.001 59 80
GO:0006623 Protein targeting to vacuole p,0.001 26 29
GO:0045324 Late endosome to vacuole transport p,0.001 1 14
GO:0031929 TOR signaling p,0.001 57 75
GO:0070534 Protein K63-linked ubiquitination p,0.001 33 42
12 JASN JASN 31: ccc–ccc, 2020You can also read