Weakly Supervised Contrastive Learning for Better Severity Scoring of Lung Ultrasound
←
→
Page content transcription
If your browser does not render page correctly, please read the page content below
Proceedings of Machine Learning Research – Under Review:1–12, 2022         Full Paper – MIDL 2022 submission

                                           Weakly Supervised Contrastive Learning for Better Severity
                                                          Scoring of Lung Ultrasound

                                           Gautam Rajendrakumar Gare1                                                 gautam.r.gare@gmail.com
                                           Hai V. Tran2
                                           Bennett P deBoisblanc2
                                           Ricardo Luis Rodriguez3
                                           John Michael Galeotti1
                                           1
                                               Robotics Institute and Dept. of ECE, Carnegie Mellon University, Pittsburgh, USA
arXiv:2201.07357v1 [eess.IV] 18 Jan 2022

                                           2
                                               Dept. of Pulmonary and Critical Care Medicine, Louisiana State University, New Orleans, USA
                                           3
                                               Cosmeticsurg.net, LLC, Baltimore, USA

                                           Editors: Under Review for MIDL 2022

                                                                                           Abstract
                                                 With the onset of the COVID-19 pandemic, ultrasound has emerged as an effective tool
                                                 for bedside monitoring of patients. Due to this, a large amount of lung ultrasound scans
                                                 have been made available which can be used for AI based diagnosis and analysis. Sev-
                                                 eral AI-based patient severity scoring models have been proposed that rely on scoring the
                                                 appearance of the ultrasound scans. AI models are trained using ultrasound-appearance
                                                 severity scores that are manually labeled based on standardized visual features. We address
                                                 the challenge of labeling every ultrasound frame in the video clips. Our contrastive learn-
                                                 ing method treats the video clip severity labels as noisy weak severity labels for individual
                                                 frames, thus requiring only video-level labels. We show that it performs better than the
                                                 conventional cross-entropy loss based training. We combine frame severity predictions to
                                                 come up with video severity predictions and show that the frame based model achieves
                                                 comparable performance to a video based TSM model, on a large dataset combining public
                                                 and private sources.
                                                 Keywords: Contrastive Learning, Weakly Supervised, COVID-19 Lung Ultrasound, POCUS
                                                 AI

                                           1. Introduction
                                           Lung Ultrasound (LUS) imaging has presented itself to be an effective bedside tool for
                                           monitoring COVID-19 patients (Mento et al., 2020; Raheja et al., 2019; Amatya et al., 2018).
                                           Several AI based applications have emerged that help with diagnosis and identification
                                           of COVID-19 lung biomarkers (Born et al., 2021, 2020; Roy et al., 2020; Van Sloun and
                                           Demi, 2020; Xue et al., 2021; Gare et al., 2021). Most of these methods rely on expert
                                           annotated data for learning, demanding scarce and expensive time from expert physicians
                                           and radiologists involved in the mitigation of the COVID-19 pandemic. This raises a need
                                           for label efficient learning techniques.
                                               Monitoring patient severity and making prognostic predictions play a critical role in the
                                           allocation of limited medical resources. For this, several AI based patient severity scoring
                                           techniques have recently been proposed (Roy et al., 2020; Xue et al., 2021) which rely on
                                           video- and frame-based annotations. Labeling all of the individual frames in an ultrasound

                                           © 2022 G.R. Gare, H.V. Tran, B.P. deBoisblanc, R.L. Rodriguez & J.M. Galeotti.
Gare Tran deBoisblanc Rodriguez Galeotti

video clip is time-consuming and expensive though. Just labeling the ultrasound video clip
is more suitable and treating the video clip severity label as the pseudo frame severity label
for the corresponding frames of the video would be preferable. But doing so introduces label
noise as not all the frames in a clip actually display the same severity sign. For instance,
B-line artifact which is indicative of an unhealthy lung would not be consistently seen in all
the frames of an unhealthy lung ultrasound clip, so not all the frames show the same level
of disease state. We propose a contrastive learning strategy as a way to mitigate the label
noise introduced by the use of such weak frame severity labels directly obtained from the
corresponding video severity label.
    Contrastive learning has been used previously in the literature as semi- and self- super-
vised learning techniques (Chen et al., 2020a), quite a few applications of it have already
been presented in the medical domain (Zhang et al.; Wang et al., 2020; Xue et al., 2021).
Contrastive learning acts as a way to regularise feature embeddings to learn discrimina-
tive features that enforce intra-class features to have a greater overlap (or similarity) than
inter-class features by using objective functions that operate on the cosine similarity of the
feature embeddings. Many techniques apply contrastive learning for differentiating COVID-
19, Healthy and other pneumonic diseases (Zhang et al.; Chen et al., 2020b). Chen et al.
(2020b) applied contrastive learning on CT scans as a few-shot COVID-19 diagnosis tech-
nique by bringing together the feature embedding of the same classes and pulling apart the
feature embedding of different classes. Similarly, Zhang et al. applied contrastive learning
on CT scans and paired text to enhance the network’s domain invariance without using any
expert annotation. Xue et al. (2021) applied contrastive learning on the patient level feature
embedding in an attempt to align features from 2 different modalities corresponding to LUS
and clinical information, to predict the patient severity. The LUS feature embeddings are
high level feature embeddings that are aggregated from frame level features to ultrasound
zone level features. In addition to making the feature embedding of the two modalities align,
they take care of preserving the patient severity discriminate features, by the introduction
of novel additional loss components to the contrastive loss. Taking a cue from them, we
also augment the contrastive loss with additional terms to retain the ultrasound severity
discriminate features.
    We propose a weakly supervised training methodology by applying contrastive learning
for the prediction of ultrasound video clip severity score, by making use of the noisy frame
severity scores directly obtained from the corresponding video severity score. We show that
the proposed contrastive learning setup is more robust to the weak frame severity label
noise and thus generalizes better, compared to the cross-entropy loss based training.

2. Methodology
2.0.1. Problem Statement
Given an ultrasound B-mode grey image Ig , the task is to find a function F : [ Ig ] → L
that maps the image Ig to ultrasound severity score labels L ∈ {0, 1, 2, 3}. Because the
pleural line produces distinct artifacts (A-lines, B-lines) when scattering ultrasound based
on the lung condition, the classification model should learn underlying mappings between
the pleural line, artifacts, and pixel values, for making the predictions.

                                              2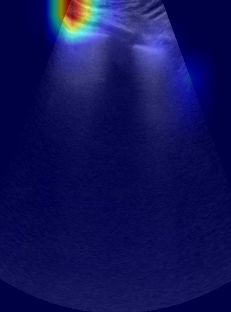
Weakly Supervised Contrastive Learning

                              LUS Dataset
          120

          100                                                                         1.0

                   57
           80                                                                         0.8
                                              51

                                                                 True Positive Rate
           60
                                  8                                                   0.6

           40
                                                                                      0.4
                   56
           20                     49          43          9                                           macro-average ROC curve (area = 0.88)
                                                                                                      ROC curve of severity score-0 (area = 0.93)
                                                         15                           0.2             ROC curve of severity score-1 (area = 0.86)
            0                                                                                         ROC curve of severity score-2 (area = 0.87)
                 score-0        score-1     score-2    score-3                                        ROC curve of severity score-3 (area = 0.78)
                                                                                      0.0
                                                                                         0.0   0.2    0.4            0.6           0.8              1.0
                                 Convex   Linear                                                      False Positive Rate

          Figure 1: The distribution of ultrasound video Figure 2: RoC plots of the contrastive learn-
                        clips into various severity scores and                                 ing trained model for the video-
                        probes.                                                                based severity scoring.

2.1. Data
We compiled a lung ultrasound dataset with linear and curvilinear videos sourced from the
publicly usable subset of the POCOVID-Net dataset (Born et al., 2020, 2021) (128 videos),
as well as our own private dataset (160 videos). Our dataset consists of multiple ultrasound
B-scans of left and right lung regions at depths ranging from 4cm to 6cm under different
scan settings, obtained using a Sonosite X-Porte ultrasound machine. The combined dataset
consists of ultrasound scans of healthy and COVID-19 patients, totaling 288 videos (113
Healthy and 175 COVID-19) resulting in about 50K images. Figure 1 shows the data
distribution into the various ultrasound severity scores and probes.
    We use the same 4-level ultrasound severity scoring scheme as defined in (Sim) and
similarly used in (Roy et al., 2020). The score-0 indicates a normal lung with the presence
of a continuous pleural line and horizontal A-line artifact. Scores 1 to 3 signify an abnormal
lung, wherein score-1 indicates the presence of alterations in the pleural line with ≤ 5 vertical
B-line artifacts, score-2 has the presence of > 5 B-lines and score-3 signifies confounding
B-lines with large consolidations. All the manual labeling was performed by individuals
with at least a month of training from a pulmonary ultrasound specialist. Refer to Figure 4
for sample images corresponding to the severity scores.

2.1.1. Data Preprocessing
We perform dataset upsampling to address the class imbalance for the training data, wherein
we upsample all the minority class labeled data to get a balanced training dataset (Rahman
and Davis, 2013). All the images are resized to 312x232 pixels using bilinear interpolation.
Data augmentation is not applied.

2.2. Training Strategy
To access the ultrasound severity score of the video clips, we make use of the video labels
as the noisy weak labels for the corresponding video frames. We augment the cross-entropy

                                                                 3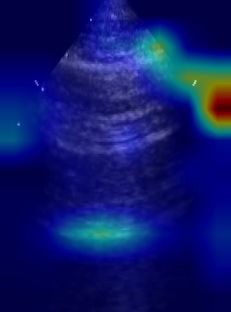
Gare Tran deBoisblanc Rodriguez Galeotti

loss training objective for the classification task, using the contrastive learning objective in
order to learn features that are robust to the frame-level label noise.

2.2.1. Contrastive Learning Objective
The proposed contrastive learning objective is inspired by (Xue et al., 2021), wherein dis-
criminative representations are learned using the contrastive loss consisting of three parts,
which respectively cope with the intra-class alignment LIA , inter-class contrastive learn-
ing LCL , and contrastive continuity LCC . The intra-class alignment LIA objective is to
bring the feature embeddings of the same severity score closer, the inter-class contrastive
learning LCL objective is to differentiate the feature embeddings of different severity scores
and the contrastive continuity LCC ensure that the hierarchy among the severity scores is
preserved. The proposed contrastive learning approach can be implemented by optimizing
the following objective:

                                             N
                                           1 X IA
                              Lcon       =     [Li + LCL
                                                      i  + LCC
                                                            i ]                             (1)
                                           N
                                               i=1

   where,
                         LIA
                          i = 1 − sim(ui , uj )          ∀i, ∃j, |si − sj | = 0             (2)

                                 X
                        LCL
                         i  =             sim(uk , ui ) ∀i, ∃k, |si − sk | > 0              (3)
                                     s

                               X
                       LCC
                        i  =             max(sim(um , ui ) − sim(un , ui ), 0)              (4)
                                 s

                 ∀i, ∃m, n, |si − sm | > 0, |si − sn | > 0, |si − sm | > |si − sn |
                                                                 a b     T
    where, N is the total number of frames, sim(a, b) = kakkbk         is the cosine similarity
between vectors a and b. u is the feature embeddings extracted after the global average
pooling layer of the network, which is 2048-dimensional vector. s is the ultrasound severity
score of the corresponding frame feature u.
    Unlike (Xue et al., 2021) which only relate the immediate severity levels, we explicitly
relate all severity levels to enforce linear relationships in order to preserve the sequential
nature of possible output choices (e.g. severity-1 is closer to severity-2 than severity-1 to
severity-3) while simultaneously achieving the desired contrast in the loss. Our approach
uniquely avoids the incorrect possibility of the model learning multi-dimensional distances
among outputs, which could for example make severity-0 seem very close to severity-3 if the
model incorrectly learned a cyclical order among the various severity levels. Prior systems
do not take this ordinal relationship into account which can give rise to unnatural ordering.
As can be observed in the confusion matrix shown in Figure 4.
    During training, for the input frame under consideration i, we randomly sample the
frames k, m, n from different video clips which have different severity scores than i and
randomly select frame j corresponding to the same video clip as i within a 10 frame window.

                                                     4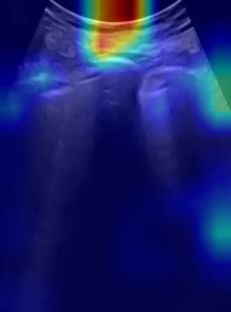
Weakly Supervised Contrastive Learning

2.2.2. Overall Training Objective
The overall training objective Loverall consists of the weighted combination of cross-entropy
loss Lce for classification error and contrastive learning loss Lcon for feature regularization:

                                Loverall = αLce + (1 − α)Lcon                               (5)
    where, the cross-entropy loss Lce = N1 i −gi log pi , in which N is the total number of
                                            P
frames, gi is the ground truth one-hot severity score, pi is the predicted probability scores
from the last softmax layer of the network and the contrastive learning loss Lcon is as defined
in Equation (1). For all our experiments we set α as 0.5.
    Using the frame predicted probability scores pi , we calculate the video’s predicted prob-
ability scores pv by taking the max severity-category score from all the corresponding video
frame’s predicted probability scores as:

                   pv = sof tmax(max pi [0], max pi [1], max pi [2], max pi [3])                  (6)
                                     i∈v        i∈v         i∈v         i∈v

    where, pi [0], pi [1], pi [2], pi [3], is severity category probability scores 0 to 3 respectively
of frame i belonging to video v. Using these video predicted probability scores pv we
evaluate the video-based severity scoring metrics of the model.

2.2.3. Implementation
The network is implemented with PyTorch and trained using the stochastic gradient descent
algorithm (Bottou, 2010) with an Adam optimizer (Kingma and Ba, 2015) set with an initial
learning rate of 0.001. The model is trained on an Nvidia Titan RTX GPU, with a batch
size of 8 for 30 epochs for the classification task. The ReduceLRonPlateau learning-rate
scheduler was used which reduces the learning rate by a factor (0.5) when the performance
metric (accuracy) plateaus on the validation set. For the final evaluation, we pick the best
model with the highest validation set accuracy to test on the held out test set.

2.2.4. Metrics
For the severity classification, we report accuracy, precision, recall, and F1 score (Born
et al., 2020; Roy et al., 2020). The receiver operating characteristic (ROC) curve is also
reported along with its area under the curve (AUC) metric (Kim et al., 2020), wherein for
the calculation of the metric the weighted average is taken, where the weights correspond
to the support of each class and for the multi-label we consider the one-vs-all approach.
(Fawcett, 2006)

3. Experiment
We train the ResNet-50 (RN50) (He et al., 2016) model, commonly used for classification
and benchmarking methods using the proposed contrastive learning setup and compare its
performance with the model trained only using the cross-entropy loss, in order to access
the robustness achieved using the contrastive learning objective to the noisy weak frame
severity score labels. We also compare the performance with the model trained using the
original contrastive learning loss in Xue et al. (2021) and a TSM (Lin et al., 2018) based

                                                  5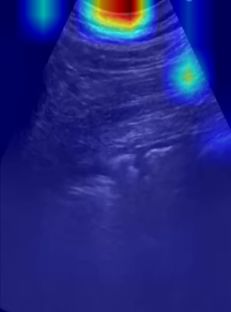
Gare Tran deBoisblanc Rodriguez Galeotti

video classification network similar to (Gare et al.), training details in Appendix-A. We
conduct five independent runs, wherein each run we randomly split the videos into train,
validation, and test sets with 70%, 10%, and 20% split ratio respectively, by maintaining
the same split ratio for all the individual severity scored clips and ensuring that all frames
corresponding to a video remain in the same split. The training set is upsampled to address
the class imbalance (Rahman and Davis, 2013). We report the resulting metrics in form of
mean and standard deviation over the five independent runs.

Table 1: Frame-based lung severity classification AUC of ROC, Accuracy, Precision, Recall,
         and F1 scores on lung dataset. Highest scores are shown in bold.

      Method         AUC of ROC        accuracy      severity       precision         recall          F1-score
                                                     score-0     0.872 ± 0.071    0.809 ± 0.037    0.836 ± 0.021
                                                     score-1     0.529 ± 0.053    0.536 ± 0.195    0.517 ± 0.116
     CE RN50         0.898 ± 0.016   0.693 ± 0.030
                                                     score-2     0.763 ± 0.068    0.705 ± 0.089    0.727 ± 0.047
                                                     score-3     0.167 ± 0.048    0.296 ± 0.067    0.212 ± 0.056
                                                       avg       0.730 ± 0.038    0.693 ± 0.030    0.703 ± 0.035
                                                     score-0     0.851 ± 0.039    0.886 ± 0.056    0.866 ± 0.016
                                                     score-1     0.610 ± 0.131    0.612 ± 0.212    0.599 ± 0.156
 proposed CL RN50    0.903 ± 0.022   0.758 ± 0.042
                                                     score-2     0.775 ± 0.070    0.771 ± 0.040    0.771 ± 0.041
                                                     score-3     0.373 ± 0.168    0.223 ± 0.099    0.264 ± 0.100
                                                       avg       0.752 ± 0.048    0.758 ± 0.042    0.748 ± 0.044
                                                     score-0     0.855 ± 0.056    0.915 ± 0.024    0.883 ± 0.033
                                                     score-1     0.620 ± 0.060    0.555 ± 0.081    0.583 ± 0.065
  original CL RN50   0.899 ± 0.020   0.759 ± 0.041
                                                     score-2     0.764 ± 0.021    0.761 ± 0.076    0.760 ± 0.038
                                                     score-3     0.429 ± 0.294    0.295 ± 0.142    0.318 ± 0.171
                                                       avg      0.754 ± 0.046    0.759 ± 0.041    0.752 ± 0.041

Table 2: Video-based lung severity classification AUC of ROC, Accuracy, Precision, Recall,
         and F1 scores on lung dataset. Highest scores are shown in bold.

      Method         AUC of ROC        accuracy      severity       precision         recall          F1-score
                                                     score-0     0.851 ± 0.083    0.739 ± 0.027    0.788 ± 0.036
                                                     score-1     0.523 ± 0.058    0.527 ± 0.156    0.516 ± 0.098
     CE RN50         0.842 ± 0.027   0.655 ± 0.055
                                                     score-2     0.751 ± 0.088    0.684 ± 0.120    0.708 ± 0.077
                                                     score-3     0.243 ± 0.095    0.440 ± 0.150    0.312 ± 0.116
                                                       avg       0.704 ± 0.053    0.655 ± 0.055    0.669 ± 0.055
                                                     score-0     0.832 ± 0.051    0.843 ± 0.071    0.835 ± 0.044
                                                     score-1     0.630 ± 0.162    0.636 ± 0.199    0.621 ± 0.154
 proposed CL RN50    0.867 ± 0.020   0.734 ± 0.065
                                                     score-2     0.761 ± 0.095    0.768 ± 0.071    0.761 ± 0.060
                                                     score-3     0.457 ± 0.290    0.320 ± 0.160    0.364 ± 0.201
                                                       avg       0.738 ± 0.068   0.734 ± 0.065    0.730 ± 0.064
                                                     score-0     0.819 ± 0.077    0.861 ± 0.017    0.837 ± 0.040
                                                     score-1     0.639 ± 0.026    0.582 ± 0.093    0.606 ± 0.058
  original CL RN50   0.879 ± 0.026   0.731 ± 0.036
                                                     score-2     0.763 ± 0.048    0.747 ± 0.117    0.747 ± 0.051
                                                     score-3     0.503 ± 0.261    0.400 ± 0.219    0.396 ± 0.130
                                                       avg       0.739 ± 0.045    0.731 ± 0.036    0.726 ± 0.036
                                                     score-0     0.911 ± 0.059    0.730 ± 0.139    0.801 ± 0.082
                                                     score-1     0.604 ± 0.081    0.764 ± 0.109    0.672 ± 0.079
     CE TSM          0.897 ± 0.025   0.710 ± 0.060
                                                     score-2     0.745 ± 0.085    0.768 ± 0.026    0.755 ± 0.056
                                                     score-3     0.276 ± 0.097    0.280 ± 0.098    0.270 ± 0.089
                                                       avg      0.744 ± 0.036     0.710 ± 0.060    0.716 ± 0.054

                                                      6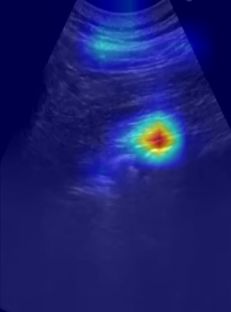
Weakly Supervised Contrastive Learning

4. Results and Discussions
Table 1 shows the mean and standard deviation of the frame-based severity scoring metrics,
obtained by evaluating on the held-out test set using the models from the five indepen-
dent runs. We observe that the contrastive learning (CL) based trained models preform
better than the cross-entropy (CE) trained model, wherein the original and the proposed
contrastive learning loss have similar scores with the original loss performing slightly better.
    We calculate the video-based severity scoring metrics of the models by calculating the
video predicted probability score pv obtained by taking the max severity-category score
from all the corresponding video frame’s predicted probability scores p, as defined in Equa-
tion (6). Table 2 shows the mean and standard deviation of the video-based severity scoring
metrics, obtained by evaluating on the held out test set using the models from the five in-
dependent runs. We again observe that the contrastive learning (CL) based trained models
preform better than the cross-entropy (CE) trained model and has comparable performance
with the video based TSM model. With our proposed loss function achieving the highest
accuracy, recall, and F1-score. The macro average and individual severity score’s RoC plots
of the CL trained model using the proposed loss for video-based prediction is shown in
Figure 2. The lower performance on severity score-3 compared to other scores could be due
to the limited number of training data for severity score-3. Figure 4 shows the confusion
matrix of both the contrastive loss trained models on the combined 5 runs.
    On comparing the model’s scoring metrics on the held out test set with the validation
(val) set used for hyperparameter optimization (see Table 3), we see that though the CE
trained model achieved higher accuracy and F1-score (avg) on the validation set compared
to our CL trained model, it was outperformed on the held out test set by the CL trained
model. This suggests that the CL trained model generalized better to the unseen data,
which is indicative of robust features learned using the contrastive loss.
    We visualize the model’s layer-2 Grad-CAM (Selvaraju et al., 2016) and show the mean
Grad-CAM image corresponding to the four severity scores taken over the entire test set
(∼ 10K images) for the best run in Figure 4. We also shown Grad-CAM on four randomly
selected images for which our CL trained model appeared to be looking at the correct loca-
tions (pleural line and A-line & B-line artifacts), whereas CE trained model was basing its
predictions on non-lung tissue. For these four test images, the CL model correctly predicted
the severity scores, whereas the CE model got all predictions wrong. Which suggests that
the contrastive learning objective lead to learning better discriminative features.
Table 3: Performance comparison of frame-based score prediction on Test and Val dataset.

           Dataset     Method     AUC     of   ROC         accuracy         F1-score
                      CE RN50     0.898   ±    0.016    0.693 ± 0.030    0.703 ± 0.035
           Test set
                      CL RN50    0.903    ±    0.022   0.758 ± 0.042    0.748 ± 0.043
                      CE RN50     0.837   ±    0.074   0.689 ± 0.094    0.685 ± 0.093
            Val set
                      CL RN50    0.839    ±    0.048    0.652 ± 0.069    0.633 ± 0.091

5. Conclusion
We demonstrated a weakly supervised method for scoring the COVID-19 lung ultrasound
scan clips, using our proposed contrastive learning objective. Which treats video-based
severity labels as frame-based severity labels thus reducing labeling cost. While these frame

                                                  7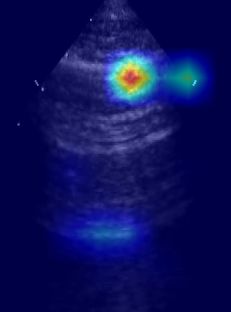
Gare Tran deBoisblanc Rodriguez Galeotti
Figure 3: Confusion matrix of the contrastive learning loss original (left) vs proposed (right). Our
proposed loss is confused between immediate severity scores which is reasonable and is
less confused between non-immediate severity scores compared to the original loss.
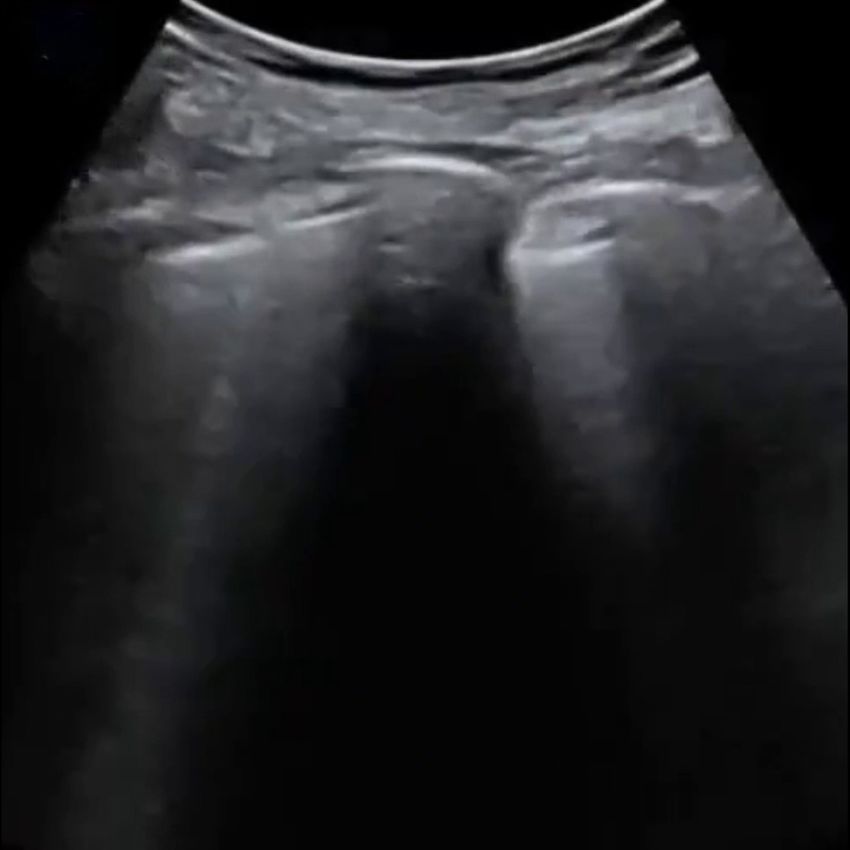
score-0 score-1 score-2 score-3
grey
CL RN50 CE RN50 CL RN50 CE RN50
random sample
mean over
testset
Figure 4: Grad-CAM (Selvaraju et al., 2016) visualization of the layer-2 of cross-entropy (CE) and
contrastive learning (CL) trained model on the four severity score test images (B-mode
grey). We observe that CL trained model bases the predictions predominantly on the
pleural line and A-line & B-line artifacts, whereas the CE trained model predominantly
bases the predictions on the subcutaneous tissues above the pleural line.
labels are noisy, we demonstrated that the contrastive learning objective is robust to such
label noise compared to the cross-entropy learning objective. We showed that the frame
based model trained using the proposed contrastive learning loss achieves comparable per-
formance to a video based TSM model.
8
Weakly Supervised Contrastive Learning

Acknowledgments
This present work was sponsored in part by US Army Medical contracts W81XWH-19-
C0083 and W81XWH-19-C0101. This work used the Extreme Science and Engineering
Discovery Environment (XSEDE), which is supported by National Science Foundation grant
number ACI-1548562. Specifically, it used the Bridges system, which is supported by NSF
award number ACI-1445606, at the Pittsburgh Supercomputing Center (PSC). We would
also like to thank our collaborators at the Carnegie Mellon University (CMU), Louisiana
State University (LUS), and University of Pittsburgh (Upitt). We are pursuing intellectual-
property protection. Galeotti serves on the advisory board of Activ Surgical, Inc. He and
Rodriguez are involved in the startup Elio AI, Inc.

References
Simple, Safe, Same: Lung Ultrasound for COVID-19 - Tabular View - Clini-
  calTrials.gov. URL https://clinicaltrials.gov/ct2/show/record/NCT04322487?term=
  ultrasound+covid&draw=2&view=record.

Yogendra Amatya, Jordan Rupp, Frances M. Russell, Jason Saunders, Brian Bales, and
  Darlene R. House. Diagnostic use of lung ultrasound compared to chest radiograph for
  suspected pneumonia in a resource-limited setting. International Journal of Emergency
  Medicine, 11(1), 12 2018. ISSN 18651380. doi: 10.1186/s12245-018-0170-2.

Jannis Born, Gabriel Brändle, Manuel Cossio, Marion Disdier, Julie Goulet, Jérémie Roulin,
  and Nina Wiedemann. POCOVID-net: Automatic detection of COVID-19 from a new
  lung ultrasound imaging dataset (POCUS), 4 2020. ISSN 23318422. URL https://doi.
  org/10.3390/app11020672.

Jannis Born, Nina Wiedemann, Manuel Cossio, Charlotte Buhre, Gabriel Brändle, Kon-
  stantin Leidermann, Avinash Aujayeb, Michael Moor, Bastian Rieck, and Karsten Borg-
  wardt. Accelerating Detection of Lung Pathologies with Explainable Ultrasound Im-
  age Analysis. Applied Sciences (Switzerland), 11(2), 1 2021. ISSN 20763417. doi:
  10.3390/app11020672. URL https://www.mdpi.com/2076-3417/11/2/672.

Léon Bottou.     Large-scale machine learning with stochastic gradient descent.   In
   Proceedings of COMPSTAT 2010 - 19th International Conference on Computational
   Statistics, Keynote, Invited and Contributed Papers, pages 177–186. Springer Sci-
   ence and Business Media Deutschland GmbH, 2010. ISBN 9783790826036. doi:
   10.1007/978-3-7908-2604-3{\ }16.    URL https://link.springer.com/chapter/10.1007/
   978-3-7908-2604-3 16.

Ting Chen, Simon Kornblith, Mohammad Norouzi, and Geoffrey Hinton. A simple frame-
  work for contrastive learning of visual representations, 2 2020a. ISSN 23318422. URL
  https://github.com/google-research/simclr.

Xiaocong Chen, Lina Yao, Tao Zhou, Jinming Dong, and Yu Zhang. Momentum Contrastive
  Learning for Few-Shot COVID-19 Diagnosis from Chest CT Images. 6 2020b. doi: 10.

                                             9
Gare Tran deBoisblanc Rodriguez Galeotti

  1016/j.patcog.2021.107826. URL http://arxiv.org/abs/2006.13276http://dx.doi.org/10.
  1016/j.patcog.2021.107826.
Tom Fawcett. An introduction to ROC analysis. Pattern Recognition Letters, 27(8):861–874,
  6 2006. ISSN 01678655. doi: 10.1016/j.patrec.2005.10.010.
Gautam Rajendrakumar Gare, Wanwen Chen, Alex Ling, Yu Hung, Edward Chen, Hai V
 Tran, Tom Fox, Peter Lowery, Kevin Zamora, Bennett P Deboisblanc, Ricardo Luis Ro-
 driguez, and John Michael Galeotti. The Role of Pleura and Adipose in Lung Ul-
 trasound AI. doi: 10.1007/978-3-030-90874-4{\ }14. URL https://doi.org/10.1007/
 978-3-030-90874-4 14.
Gautam Rajendrakumar Gare, Andrew Schoenling, Vipin Philip, Hai V. Tran, Bennett P.
 Deboisblanc, Ricardo Luis Rodriguez, and John Michael Galeotti. Dense pixel-labeling for
 reverse-transfer and diagnostic learning on lung ultrasound for covid-19 and pneumonia
 detection. In Proceedings - International Symposium on Biomedical Imaging, volume
 2021-April, pages 1406–1410. IEEE Computer Society, 4 2021. ISBN 9781665412469.
 doi: 10.1109/ISBI48211.2021.9433826.
Kaiming He, Xiangyu Zhang, Shaoqing Ren, and Jian Sun. Deep residual learning for
 image recognition. In Proceedings of the IEEE Computer Society Conference on Computer
 Vision and Pattern Recognition, volume 2016-December, pages 770–778. IEEE Computer
 Society, 12 2016. ISBN 9781467388504. doi: 10.1109/CVPR.2016.90. URL http://
 image-net.org/challenges/LSVRC/2015/.
Hyo Eun Kim, Hak Hee Kim, Boo Kyung Han, Ki Hwan Kim, Kyunghwa Han, Hyeon-
  seob Nam, Eun Hye Lee, and Eun Kyung Kim. Changes in cancer detection and
  false-positive recall in mammography using artificial intelligence: a retrospective, multi-
  reader study. The Lancet Digital Health, 2(3):e138–e148, 3 2020. ISSN 25897500. doi:
  10.1016/S2589-7500(20)30003-0. URL www.thelancet.com/.
Diederik P. Kingma and Jimmy Lei Ba. Adam: A method for stochastic optimization.
  In 3rd International Conference on Learning Representations, ICLR 2015 - Conference
  Track Proceedings. International Conference on Learning Representations, ICLR, 12 2015.
  URL https://arxiv.org/abs/1412.6980v9.
Ji Lin, Chuang Gan, and Song Han. TSM: Temporal Shift Module for Efficient Video
  Understanding. Proceedings of the IEEE International Conference on Computer Vision,
  2019-Octob:7082–7092, 11 2018. URL http://arxiv.org/abs/1811.08383.
Federico Mento, Tiziano Perrone, Veronica Narvena Macioce, Francesco Tursi, Danilo Buon-
  senso, Elena Torri, Andrea Smargiassi, Riccardo Inchingolo, Gino Soldati, and Libertario
  Demi. On the Impact of Different Lung Ultrasound Imaging Protocols in the Evaluation
  of Patients Affected by Coronavirus Disease 2019. Journal of Ultrasound in Medicine,
  2020. ISSN 15509613. doi: 10.1002/jum.15580. URL www.aium.org.
Ronak Raheja, Megha Brahmavar, Dhruv Joshi, and Dileep Raman. Application of Lung
  Ultrasound in Critical Care Setting: A Review. Cureus, 7 2019. ISSN 2168-8184. doi:
  10.7759/cureus.5233.

                                             10
Weakly Supervised Contrastive Learning
M. Mostafizur Rahman and D. N. Davis. Addressing the Class Imbalance Problem in
Medical Datasets. International Journal of Machine Learning and Computing, pages
224–228, 2013. ISSN 20103700. doi: 10.7763/ijmlc.2013.v3.307.
Subhankar Roy, Willi Menapace, Sebastiaan Oei, Ben Luijten, Enrico Fini, Cristiano Saltori,
Iris Huijben, Nishith Chennakeshava, Federico Mento, Alessandro Sentelli, Emanuele
Peschiera, Riccardo Trevisan, Giovanni Maschietto, Elena Torri, Riccardo Inchingolo,
Andrea Smargiassi, Gino Soldati, Paolo Rota, Andrea Passerini, Ruud J.G. Van Sloun,
Elisa Ricci, and Libertario Demi. Deep Learning for Classification and Localization of
COVID-19 Markers in Point-of-Care Lung Ultrasound. IEEE Transactions on Medical
Imaging, 39(8):2676–2687, 8 2020. ISSN 1558254X. doi: 10.1109/TMI.2020.2994459.
Ramprasaath R. Selvaraju, Michael Cogswell, Abhishek Das, Ramakrishna Vedantam, Devi
Parikh, and Dhruv Batra. Grad-CAM: Visual Explanations from Deep Networks via
Gradient-based Localization. International Journal of Computer Vision, 128(2):336–359,
10 2016. doi: 10.1007/s11263-019-01228-7. URL http://arxiv.org/abs/1610.02391http:
//dx.doi.org/10.1007/s11263-019-01228-7.
Ruud J.G. Van Sloun and Libertario Demi. Localizing B-Lines in Lung Ultrasonography
by Weakly Supervised Deep Learning, In-Vivo Results. IEEE Journal of Biomedical
and Health Informatics, 24(4):957–964, 2020. ISSN 21682208. doi: 10.1109/JBHI.2019.
2936151.
Zhao Wang, Quande Liu, and Qi Dou. Contrastive Cross-site Learning with Redesigned
Net for COVID-19 CT Classification. 9 2020. doi: 10.1109/JBHI.2020.3023246. URL
http://arxiv.org/abs/2009.07652http://dx.doi.org/10.1109/JBHI.2020.3023246.
Wufeng Xue, Chunyan Cao, Jie Liu, Yilian Duan, Haiyan Cao, Jian Wang, Xumin Tao,
Zejian Chen, Meng Wu, Jinxiang Zhang, Hui Sun, Yang Jin, Xin Yang, Ruobing Huang,
Feixiang Xiang, Yue Song, Manjie You, Wen Zhang, Lili Jiang, Ziming Zhang, Shuang-
shuang Kong, Ying Tian, Li Zhang, Dong Ni, and Mingxing Xie. Modality alignment
contrastive learning for severity assessment of COVID-19 from lung ultrasound and clin-
ical information. Medical Image Analysis, 69:101975, 4 2021. ISSN 13618423. doi:
10.1016/j.media.2021.101975. URL https://doi.org/10.1016/j.media.2021.101975.
Yuhao Zhang, Hang Jiang, Yasuhide Miura, Christopher D Manning, and Curtis P Langlotz.
CONTRASTIVE LEARNING OF MEDICAL VISUAL REPRESENTATIONS FROM
PAIRED IMAGES AND TEXT. Technical report.
Appendix A. TSM model Training Strategy
We follow the same setup of (Gare et al.) for training a TSM network (Lin et al., 2018)
with ResNet-18 (RN18) (He et al., 2016) backbone and bi-directional residual shift with
1/8 channels shifted in both directions. The model is fed input clips of 16 frames wide
(224x224 pixels) sampled using the same strategy as in Gare et al.. For testing, 3 sequential
sample clips per video are evaluated which are used to get the corresponding video predicted
probability scores pv , as defined in Equation (6). The model is trained for 30 epochs using
11Gare Tran deBoisblanc Rodriguez Galeotti
cross-entropy loss. For fair comparison with the frame based models no augmentation is
used.
Appendix B. Comparison with other existing work
We compare our video-based scoring with prior method reported scores in the literature
(Roy et al., 2020; Xue et al., 2021) in Table 4. We see that our method achieves higher
scores, though noting that these scores are obtained on different datasets.
Table 4: Performance comparison of the video-based score prediction with other existing
work. Scores are obtained on different dataset.
Method AUC of ROC accuracy precision recall F1-score
(Roy et al., 2020) - - 0.70 0.60 0.61
(Xue et al., 2021) - 0.5660 0.5648 0.5630 0.5639
ours 0.867 0.734 0.738 0.734 0.730
12You can also read