West Coast Trade Report - Pacific Merchant Shipping ...
←
→
Page content transcription
If your browser does not render page correctly, please read the page content below

West Coast Trade Report
                                                                                                               July 2021

A First Look at June’s TEU Numbers
Note: Continuing our recent practice of downplaying the       Collectively, the two big Southern California ports pushed
significance of year-over-year comparisons with the dismal    past the 10 million total TEU mark in June, 23.8% more
container trade numbers rung up in last year’s second         than the two ports handled through the first half of 2019.
quarter, this “First Look” contrasts this June’s container    Import loads were higher by 27.6% but outbound loads
tallies with the numbers from the more normal, pre-pandemic   were down by 13.8%.
June of 2019.
                                                              Up at the Port of Oakland, June inbound loads (90,060
The first major port to report June numbers was Long          TEUs) were up by 2.7% from the previous month and
Beach. Inbound loads, while up handily over a year earlier    by 17.5% from June 2019, while outbound loads were
and 7.7% over June 2019, were down sharply from May.          down by 5.9%. Overall, Oakland handled 9.2% more total
The port handled 87,635 fewer inbound loads and 18,398        TEUs this June (222,483) than it had two years earlier
fewer outbound loads than in the previous month, owing        (203,731).
at least in part to the temporary closure of Yantian and      Further up the U.S. West Coast (USWC), the Northwest
congestion at other Chinese ports. June’s total TEU traffic   Seaport Alliance Ports of Tacoma and Seattle handled
at the San Pedro Bay port was off by 182,919 TEUs from        133,904 loaded import TEUs this June, 9.2% more than in
May. Even odder, Long Beach was a busier port in June         June 2019. Export loads, however, were down 19.5% over
2018 than it was this June, with inbound and outbound         the same span. The total of all container traffic through
loads as well as total TEU traffic all lower this June than   the two ports was down 2.9% from June 2019.
they were three Junes ago.
                                                              Overall container traffic at the Port of Vancouver plunged
Over at the adjacent Port of Los Angeles, inbound loads in    by 21.6% in June from the month before owing largely
June (467,763 TEUs) were down 12.7% from the record-          to an interruption in normal rail service to the Port of
high 535,714 inbound loads the port had handled a month       Vancouver caused by wildfires in British Columbia. Still,
earlier. June’s import traffic was, however, up 18.0% over    the 151,144 inbound loaded TEUs the port received
the 396,307 laden TEUs loads the port received in June        in June represented a 17.5% bounce over June 2019.
2019. On the other hand, LA was not exactly an export         Outbound loads, however, were down 13.7% from two
powerhouse in June, with just 96,067 export loads. That       years earlier. The other British Columbia port we track,
turns out to have been the fewest export loads the port       Prince Rupert, posted some particularly disturbing figures
sent out to sea in any month since September of 2005.         for June. Not only was it the only major Pacific Coast port

Pacific Merchant Shipping Association
70 Washington Street, Suite 305, Oakland, CA 94607
                                                                                                 pmsaship.com
510-987-5000 info@pmsaship.com
West Coast Trade Report

A First Look at June’s TEU Numbers                          Documenting the May 2021
Continued
                                                            TEU Numbers
to handle fewer loaded inbound containers in June than
it had during the two previous Junes, but it also did so    Please note: The TEU tallies cited here are not derived from
with elan. Inbound loads were down year-over-year by        forecasting algorithms or the partial information available
42.0% and from June 2019 by 51.5%. Export loads were        from U.S. Customs and Border Protection but instead
off by similar margins, down 46.1% from last June and       represent the actual TEU counts reported by the major
by 39.5% from June 2019.                                    North American seaports we survey each month. The U.S.
                                                            mainland ports we monitor collectively handle over 90% of the
Back East, Boston’s Conley Terminal had a poor June.
                                                            container movements at continental U.S. ports.
Inbound loads (9,014 TEUs) were off by 35.0% from
two years earlier, while its 5,833 outbound loads were      Because of the pandemic’s effect in skewing year-over-
down by 20.8%. Heading down the Atlantic Seaboard,          year comparisons of container trade, we will again be
Charleston posted a 22.8% jump in inbound loads over        offering two sets of comparative statistics. We begin with
June 2019 along with a simultaneous 3.8% gain in            Exhibit 1 which compares the import numbers for this May
outbound loads.                                             with the same month in the two preceding years.
Savannah saw a 27.8% bump over June 2019 in import          Exhibit 1 displays the complete inbound loaded container
loads (215,729 TEUs), while export loads advanced by        traffic numbers for May as reported by the sixteen
4.6%. Over at the Port of Virginia, import loads (138,737   mainland U.S. and two British Columbian ports we track.
TEUs) were up 23.1% from June 2019, while export            Inbound loads for all eighteen ports totaled 2,646,027
loads (78,853 TEUs) rose by 9.6%.                           TEUs, up 25.8% from May 2019.
On the Gulf Coast, Houston handled 139,488 inbound          The brunt of the surge fell on the five major USWC ports,
loaded TEUs this June, a 32.6% jump from the same           which collectively saw a 31.6% bump in inbound loads
month two years earlier. However, its outbound loads        since May 2019.
(84,614 TEUs) were down by 20.5% from June 2019.
Total container traffic at the big Texas port in June       Exports, as Exhibit 2 illustrates, generally continued
(292,627 TEUs) was up 16.4% from June 2019.                 their downward spiral. Collectively, the U.S. and British
                                                            Columbia ports we track shipped 3.4% fewer outbound
Not one of the ports that have so far reported their June
                                                            loads this May than in May 2019. Largely due to the huge
TEU tallies recorded more inbound loads in June than in
                                                            fall-off in export traffic through the Port of Los Angeles,
May.
                                                            the major USWC ports saw a combined 12.4% reduction in
Regionally, the Big Five U.S. West Coast ports handled      export loads since May 2019. Still, several ports showed
1,053,828 inbound loaded TEUs this June, down 12.6%         export gains over the two-year interval. These included
from May but up 13.1% from June 2019. Outbound              Long Beach, Virginia, Maryland, Charleston, Savannah, and
loads this June totaled 341,136 TEUs, down 10.8% from       Jaxport who all shipped more outbound loads this May
June 2019.                                                  than in the same month two years earlier.

                                                                                                  July 2021      Page 2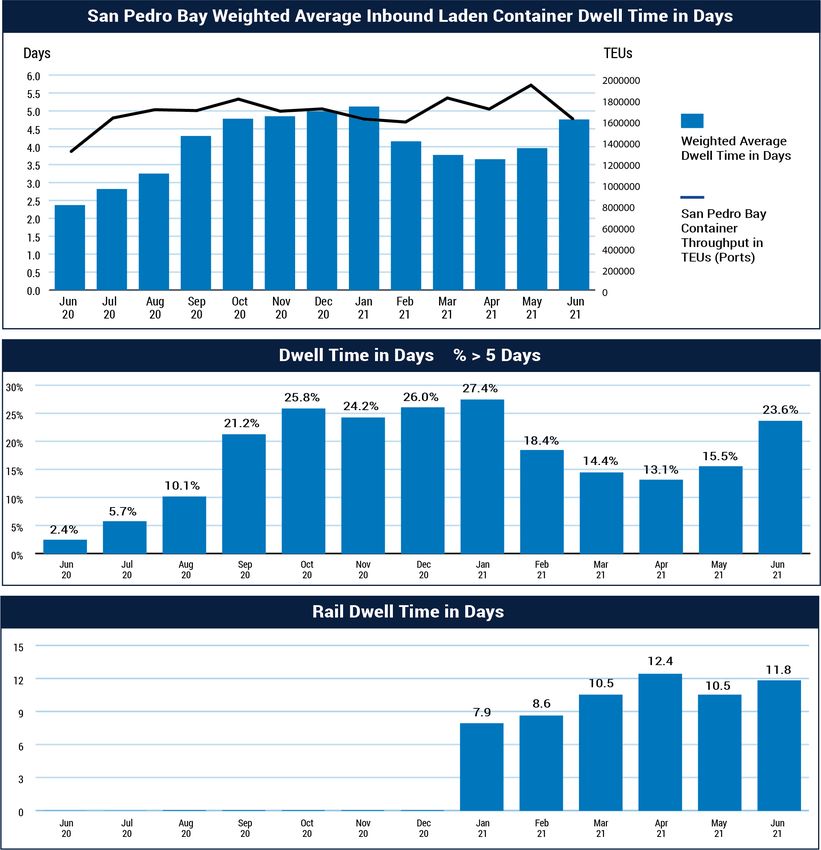
West Coast Trade Report

 Exhibit 1        May 2021 - Inbound Loaded TEUs at Selected Ports

                    May 2021      May 2020       %      May 2019       %      May 2021     May 2020       %        May 2019        %
                                               Change                Change     YTD          YTD        Change       YTD         Change

Los Angeles            535,714      306,323     74.9%     427,789     25.2%    2,366,449    1,581,445    49.6%       1,863,960    27.0%

Long Beach             444,736      312,590     42.3%     290,568     53.1%    1,958,070    1,359,252    44.6%       1,482,193    32.1%

San Pedro Bay
                       980,450      618,913     58.4%     718,357     36.5%    4,324,519    2,940,697    47.1%       3,346,153    29.2%
Totals

Oakland                 92,558       73,423     26.1%      85,970      7.7%     449,581      371,897     20.9%        393,256     14.3%

NWSA                   132,714       86,129     54.1%     111,730     18.8%     607,945      461,594     31.7%        569,673      6.7%

USWC Totals          1,205,722      778,465     54.9%     916,057     31.6%    5,382,045    3,774,188    42.6%      4,309,082     24.9%

Boston                   8,410       10,439    -19.4%      11,436    -26.5%       45,745       58,335   -21.6%          59,324   -22.9%

NYNJ                   396,417      266,004     49.0%     340,680     16.4%    1,854,409    1,444,677    28.4%       1,544,354    20.1%

Maryland                46,049       37,741     22.0%      42,984      7.1%     200,629      205,659     -1.4%        222,182     -4.2%

Virginia               144,916       87,669     65.3%     119,592     21.2%     653,987      493,551     32.5%        561,012     16.6%

South Carolina         107,050       77,072     38.9%      88,009     21.6%     503,348      410,833     22.5%        434,333     15.9%

Georgia                235,687      154,730     52.3%     185,265     27.2%    1,143,883     827,212     38.3%        906,563     26.2%

Jaxport                 33,940       23,661     43.4%      30,022     13.1%     143,898      122,577     11.2%        143,341      0.4%

Port Everglades         30,443       19,410     56.8%      25,619     18.8%     147,511      126,636     16.5%        141,525      4.2%

Miami                   44,645       29,658     50.5%      37,943     17.7%     232,381      165,269     40.6%        180,875     28.5%

USEC Totals          1,047,557      706,384     48.3%     881,550     18.8%    4,925,791    3,854,749    27.8%      4,193,509     17.5%

New Orleans             11,552       13,725    -15.8%      12,994    -11.1%       52,971       59,256   -10.6%          56,944    -7.0%

Houston                132,853       99,509     33.5%     107,126     24.0%     609,958      482,815     26.3%        499,628     22.1%

USGC Totals            144,405      113,234     27.5%     117,653     22.7%     662,929      542,071     22.3%        543,578     22.0%

Vancouver              191,637      132,473     44.7%     130,769     46.5%     840,310      650,339     29.2%        706,273     19.0%

Prince Rupert           56,706       36,439     55.6%      57,578     -1.5%     222,062      223,889     -0.8%        241,625     -8.1%

BC Totals              248,343      168,912     47.0%     188,347     31.9%    1,062,372     874,228     21.5%        947,898     12.1%

US/BC Totals          2,646,027    1,766,995    49.7%    2,103,607    25.8%   12,033,137    9,045,236    33.0%       9,994,067    20.4%

US Total              2,397,684    1,598,083    50.0%    1,915,260    25.2%   10,970,765    8,171,008    34.3%       9,046,169    21.3%

USWC/BC               1,454,065     947,377     53.5%    1,104,404    31.7%    6,444,417    4,648,416    38.6%       5,256,980 122.6%

                                                                                                                 Source Individual Ports

                                                                                                             July 2021           Page 3
West Coast Trade Report

 Exhibit 2       May 2021 - Outbound Loaded TEUs at Selected Ports

                    May 2021     May 2020      %      May 2019      %      May 2021     May 2020       %        May 2019        %
                                             Change               Change     YTD          YTD        Change       YTD         Change

Los Angeles           109,886      104,382     5.3%     167,357   -34.3%     567,768      638,524    -10.1%        769,362    -13.0%

Long Beach            135,345      134,556     0.6%     120,577    12.2%     634,794      616,682      2.9%        598,392      6.1%

San Pedro Bay
                      245,231      238,938     2.6%     287,934   -14.8%   1,202,562    1,255,206     -4.2%      1,367,754    -12.1%
Totals

Oakland                74,726       69,720     7.2%      78,070    -4.3%     387,858      391,878     -1.0%        388,751     -0.2%

NWSA                   62,527       59,595     4.9%      70,541   -11.4%     308,348      340,908     -9.6%        377,171    -19.2%

USWC Totals           382,484      368,253     3.9%     436,545   -12.4%   1,898,768    1,987,992     -4.5%      2,133,676    -11.0%

Boston                  5,994        4,086    46.7%       6,853   -12.5%      31,984       28,685    11.5%           32,833    -2.6%

NYNJ                  134,458       95,462    40.8%     132,315     1.6%     586,264      561,843      4.3%        618,855     -5.3%

Maryland               24,651       12,955    90.3%      19,134    28.8%     107,370       90,338    18.9%           95,166   12.8%

Virginia               99,717       72,160    38.2%      88,065    13.2%     462,335      394,241    17.3%         417,315    10.8%

South Carolina         73,281       58,972    24.3%      71,399     2.6%     361,039      331,400      8.9%        348,234      3.7%

Georgia               137,812      122,271    12.7%     126,895     8.6%     625,711      627,810     -0.3%        641,337     -2.4%

Jaxport                50,311       38,528    30.6%      42,180    19.3%     240,896      190,611    26.4%         209,855    15.8%

Port Everglades        33,655       20,643    63.0%      35,805    -6.0%     159,901      142,075    12.5%         175,566     -8.9%

Miami                  30,790       26,545    16.0%      35,357   -12.9%     146,962      152,579     -3.7%        174,502    -15.8%

USEC Totals           590,669      451,622    30.8%     554,619     6.5%   2,722,462    2,519,582      8.1%      2,448,862    11.2%

New Orleans            26,279       24,176     8.7%      27,757    -5.3%     116,552      122,826     -5.1%        123,259     -5.4%

Houston                95,439      100,538    -5.1%     116,693   -18.2%     473,484      536,954    -11.8%        516,063     -8.3%

USGC Totals           121,718      124,714    -2.4%     141,238   -13.8%     590,036      659,780    -10.6%        611,565     -3.5%

Vancouver              94,002       96,902    -3.0%      95,220    -1.3%     425,675      444,686     -4.3%        480,353    -11.4%

Prince Rupert          16,313       16,282     0.2%      19,458    -8.0%      72,710       83,443    -19.9%          86,393   -15.8%

BC Totals             110,315      113,184    -2.5%     114,678    -3.8%     498,385      528,129     -5.6%        566,746    -12.1%

US/Canada
                     1,205,186   1,057,773    13.7%   1,247,080    -3.4%   5,709,651    5,695,483      0.2%       5,760,849    -0.9%
Total

US Total             1,094,871     944,589    15.7%   1,132,402    -3.3%   5,211,266    5,167,354      0.8%       5,194,103     0.3%

USWC/BC               492,799      481,437     2.4%     551,223   -10.6%    2,397,153    2,516,121    -4.7%       2,700,422   -11.2%

                                                                                                              Source Individual Ports

                                                                                                          July 2021           Page 4
West Coast Trade Report
Documenting the May 2021 TEU Numbers Continued
Exhibit 3 provides the May year-to-date Exhibit 3 May 2021 Total TEUs (Loaded and Empty) Handled at
total container traffic figures for the Selected Ports
U.S., Canadian, and Mexican ports we
monitor. Several major ports were less
busy through the first five months of
this year than they were during the same May 2021 May 2020 % Change May 2019 % Change
months in pre-pandemic 2019. These
Los Angeles 4,551,445 3,070,413 48.2% 3,773,862 20.6%
included Vancouver, Manzanillo, Virginia,
Charleston, and Maryland. Long Beach 4,029,532 2,830,855 42.3% 3,008,468 33.9%
Weights and Values NYNJ 3,645,672 2,854,319 27.7% 3,041,814 19.9%
Yes, we realize that the maritime industry
likes its statistics served up, so to speak, Georgia 2,293,732 1,753,115 30.8% 1,890,322 21.3%
in TEUs. But here, though, we provide Vancouver 1,660,977 1,289,308 28.8% 1,890,322 -12.1%
two alternative measures – the declared
weight and value of the goods housed NWSA 1,515,894 1,277,227 18.7% 1,409,784 7.5%
in those TEUs. The percentages in the
Virginia 1,400,355 1,063,446 31.7% 1,242,957 12.7%
following exhibits are derived from
data compiled by the U.S. Commerce Manzanillo 1,371,151 1,195,646 14.7% 1,572,029 -12.8%
Department that are normally published
with a five-week time-lag. Houston 1,315,166 1,216,877 8.1% 1,215,124 8.2%
Exhibit 4: USWC Ports and the South Carolina 1,103,335 939,722 17.4% 1,209,921 -8.8%
Worldwide Container Trade.
Oakland 1,079,298 969,177 11.4% 1,007,011 7.2%
Exhibit 4 shows how the three major
USWC gateways have been faring with Montreal 679,452 698,966 -2.8% 716,681 -5.2%
respect to their respective shares of
containerized imports discharged at JaxPort 595,141 488,348 21.9% 559,387 6.4%
mainland U.S. seaports in May. However,
Lazaro Cardenas 544,477 449,343 21.2% 553,154 -1.6%
we again wish to remind readers that
the major USWC port complexes do not Miami 529,003 423,794 24.8% 473,834 11.6%
entirely monopolize the movement of
containers through ports in the states Port Everglades 439,629 405,080 8.5% 443,339 -0.8%
of California, Oregon, and Washington. Prince Rupert 434,565 398,510 9.0% 454,406 -4.4%
San Diego and Port Hueneme are both
important conduits for refrigerated Maryland 429,720 419,802 2.4% 453,248 -5.2%
containers laden with fresh fruit imports
Philadelphia 284,183 255,143 11.4% 246,370 15.3%
from Central and South America. And
Portland (the one in Oregon) is re- New Orleans 227,870 253,900 -10.3% 265,361 -14.1%
establishing itself as a container port,
with the number of total TEUs handled in Boston 92,697 113,618 -18.4% 120,460 -23.0%
May (4,259 TEUs) up from zero just two
US/Canada Total 26,307,666 20,721,620 27.0% 23,422,671 12.3%
years ago.
US Mainland Only 23,532,672 18,334,836 28.3% 20,361,262 15.6%
Together, the sundry ports along the
U.S. West Coast handled 37.7% of all Source Individual Ports
containerized tonnage that moved
July 2021 Page 5West Coast Trade Report
Documenting the May 2021 TEU Numbers Continued
Exhibit 4 Major USWC Ports Shares of U.S. Exhibit 5 Major USWC Ports Shares of U.S.
Mainland Ports Worldwide Container Mainland Ports Containerized Trade with
Trade, May 2021 East Asia, May 2021
May 2021 Apr 2021 May 2020 May 2021 Apr 2021 May 2020
Shares of U.S. Mainland Ports Containerized Import Tonnage Shares of U.S. Mainland Ports’ East Asian Container Import Tonnage
LA/LB 28.0% 28.0% 27.0% LA/LB 47.9% 46.0% 42.1%
Oakland 3.9% 4.0% 4.3% Oakland 4.4% 5.1% 4.6%
NWSA 4.4% 4.9% 5.3% NWSA 7.1% 7.8% 7.6%
Shares of U.S. Mainland Ports Containerized Import Value Shares of U.S. Mainland Ports’ East Asian Container Import Value
LA/LB 34.5% 33.7% 35.0% LA/LB 52.5% 50.9% 50.1%
Oakland 3.3% 3.5% 3.9% Oakland 3.9% 4.7% 4.4%
NWSA 5.7% 6.3% 6.3% NWSA 8.5% 9.4% 8.7%
Shares of U.S. Mainland Containerized Export Tonnage Shares of U.S. Mainland Ports’ East Asian Container Export Tonnage
LA/LB 19.8% 19.0% 20.8% LA/LB 33.2% 31.6% 32.1%
Oakland 6.2% 7.6% 6.9% Oakland 8.5% 10.4% 9.6%
NWSA 6.5% 6.9% 8.3% NWSA 10.6% 11.5% 12.8%
Shares of U.S. Mainland Conatainerized Export Value Shares of U.S. Mainland Ports’ East Asian Container Export Value
LA/LB 18.3% 17.7% 22.4% LA/LB 37.7% 35.8% 40.6%
Oakland 6.3% 7.2% 7.2% Oakland 11.2% 12.5% 11.9%
NWSA 3.7% 3.9% 4.5% NWSA 7.7% 8.2% 8.6%
Source: U.S. Commerce Department. Source: U.S. Commerce Department.
through U.S. mainland ports in May. That share was USWC ports share of export tonnage through USWC ports
smaller than in May of last year (38.1%) and in May was 3.7% in May, up from 0.5% in May 2019.
of 2019 (38.6%). By themselves, the Big Five USWC
Altogether, USWC ports -- big and small -- handled 37.7%
gateways handled 36.2% of all containerized import
of all containerized import tonnage through American
tonnage through U.S. mainland ports in May, down from a
mainland ports in May. That was up down from 38.1% a
36.6% share a year earlier and from 37.2% in May 2019.
year earlier, which was down from 38.6% in May 2019.
Meanwhile, all USWC ports handled 29.0% of all
As much as we dwell on containerized trade, it is
containerized exports from mainland ports in May,
perhaps worth noting that the USWC tonnage share of all
down from 29.6% last May and from 34.6% in May 2019.
merchandise (excluding Mineral Fuel) imported through
The smaller USWC ports handled 2.5% of the value of
U.S. mainland ports in May was 30.7%, up from just 27.2%
containerized exports through all USWC ports in May, up
in June 2019. Similarly, the USWC share of the value of
from 1.3% a year earlier, and from 1.6% in May 2019.
those non-Mineral Fuel imports in May was 42.4%, down
Export tonnage, all USWC ports handled 33.7% in May, a half-notch from 42.9% two years earlier in more normal
up from 34.7% in April, and 37.3% in May 2019. Smaller times.
July 2021 Page 6West Coast Trade Report
Documenting the May 2021 TEU Numbers Continued
Exhibit 5: USWC Ports and the East Asia Trade. Not surprisingly, the Port of Los Angeles was also
Exhibit 5 displays the shares of U.S. container trade the nation’s busiest port year-to-date, with 4,551,445
involving the Far East handled by the major USWC total TEUs through May. Second was Long Beach with
ports. Collectively, these five ports handled 59.4% of all 4,029,532 TEUs, while PNYNJ placed third with 3,645,672
containerized import tonnage that entered U.S. mainland TEUs. Savannah handled 2,293,732 total TEUs through
ports in May. That was up sharply from last May, when the May of this year, while the NWSA ports processed
same five ports received 55.0% of all containerized import 1,515,894 TEUs.
tonnage and from the 57.4% share in the pre-pandemic For sticklers who don’t believe empty boxes should
month of May 2019. Adding in the containerized import count, Los Angeles remained in the lead with 645,600
tonnage handled by the smaller ports of California, loaded TEUs in the month of May. In second place
Oregon, and Washington, the USWC share amounted with 580,081 loads was the Port of Long Beach, easily
to 60.2%. While the Big Five clearly dominate USWC ahead of PNYNJ’s 530,875 loaded TEUs. Savannah and
containerized trade with the Far East, their shares are Houston were well behind with 373,499 and 228,292 laden
slipping ever so slightly. May 2021 data show the Big Five TEUs, respectively. (NWSA presents a statistical puzzle,
handing 98.6% of all import tonnage from the Far East being that it’s the only major maritime gateway that
that entered USWC ports and 97.6% of all export tonnage distinguishes its international trade from its domestic
involving the Far East from USWC ports. Those shares services. NWSA reports handling 195,241 laden import
were down, though, from the 98.8% of import tonnage and and export TEUs in May but also 65,720 TEUs in traffic
99.0% of exports they had handled in the last relatively with Hawaii and Alaska. The problem is that NWSA
normal May in 2019. doesn’t tell us how many of those boxes were full.)
On the export side of the ledger, all USWC ports great and In the category of inbound loads discharged in May, Los
small handled 53.7% of all containerized export tonnage Angeles (535,714 TEUs) exceeded Long Beach (444,736
bound for the Far East from America’s mainland ports. TEUs) and PNYNJ (396,417 TEUs). Inbound loads at
That was down from 55.0% a year earlier and from a Savannah meanwhile totaled 235,687 TEUs. Houston,
58.1% share in May of 2019. with 132,853 inbound loads in May, nosed out the NWSA
ports (132,714 laden import TEUs).
Who’s #1?
The Port of Los Angeles was the nation’s busiest Export loads are a different story, one in which the
container port in May 2021, having handled 1,012,048 first will, if not be the least, will certainly plunge in
total TEUs (loads and empties) that month. The the standings. The most provocative news is not that
neighboring Port of Long Beach ran a competitive second Savannah (137,812 TEUs) again bested East Coast rival
with 907,216 total TEUs, its highest monthly total ever. PNYNJ (134,458 TEUs), but that the Georgia port also
Together, the San Pedro Bay complex managed to move swamped the Port of Los Angeles (109,886 TEUs), while
1,919,264 TEUs, a staggering 58.6% leap over last May’s also edging past Long Beach (135,345 TEUs). That leaves
just plain pandemic-suppressed 1,209,870 TEUs but also LA, otherwise the nation’s busiest container port, as its
4th largest container export gateway. Virginia, with 99,717
up 36.9% from the 1,402,285 total TEUs they had handled
laden outbound TEUs in May, came fifth.
in May 2019. In third came the Port of New York/New
Jersey (PNYNJ) with 796,693 TEUs. Fourth place went For the year’s first five months, Long Beach shipped the
to Savannah with 478,621 total TEUs. The Northwest most outbound loads (634,794 TEUs). Savannah was
Seaport Alliance Ports of Tacoma and Seattle ranked fifth the runner-up with 625,7111 TEUs, ahead of third place
among the U.S. ports we track with a total of 333,026 PNYNJ (586,264 TEUs). Los Angeles (567,768 TEUs)
TEUs in May. (For our friends elsewhere in North America, again ran fourth ahead of fifth place Houston (473,484
Vancouver handled 385,292 TEUs in May, while 264,871 TEUs). Honorable mention goes to the Port of Virginia,
TEUs crossed the docks at Manzanillo.) which shipped 462,335 laden TEUs through May.
July 2021 Page 7West Coast Trade Report
Documenting the May 2021 TEU Numbers Continued
The Scrap Paper Trade by half before sliding further as the pandemic spread.
Officials concerned about America’s merchandise trade Through the first five months of this year, shipments
deficit might start worrying about our declining surplus to China were just 4.8% of what they were in the same
in the trade in scrap paper (formally Waste & Scrap Paper months in 2017, the peak year of our scrap paper trade
or Harmonized System Code 4707). Sure, we are such a with China.
prodigious producer of scrap paper that we hardly need Not surprisingly, scrap paper shipments through USWC
anyone else’s. Through the first five months of this year, ports declined sharply. Comparing the first five months of
the U.S. imported 419 metric tons of scrap paper, while this year with the same period in 2017, scrap paper export
exporting 5.67 million metric tons. But, while our trade tonnage through the San Pedro Bay Ports of Los Angeles
surplus in scrap paper has been truly stupendous since and Long Beach was off by 23.5% while exports through
even before the first ticker-tape parades, the surplus has the Northwest Seaport Alliance Ports of Tacoma and
been steadily diminishing in recent years. Not hugely, Seattle dropped by 52.1%. Only Oakland eluded the deep
mind you, but by enough perhaps to cause those suffering fall-off with a decline of just 0.3%. Meanwhile, the Port of
from TMTOTH (too much time on their hands) to start New York/New Jersey saw its scrap paper exports rise by
reaching for the Pepto-Bismol. 16.4%, due largely to India’s emergence as the foremost
importer of America’s scrap paper.
Why is this worth mentioning? One reason is that the
geography of the trade has been shifting ever since China One other interesting point to note. As Exhibit 7 shows,
decided to be much more perspicacious about the quality containerization has only lately come to monopolize
of scrap it was taking off our hands. the seaborne export trade in waste and scrap paper. As
recently as 2015, the majority of scrap paper tonnage
There had been a time when China imported nearly
shipped overseas traveled in bulk. Last year, containers
three-quarters of the scrap paper the United States
moved 99.3% of the trade.
exported. That was in 2016, when Beijing’s share of the
trade stood at 74.1%. Even that, though, was not the peak The Cost of Energy
year in tonnage terms. In 2017, Chinese imports of U.S. One of us here is old enough to remember a gas war on
scrap paper totaled 10,242,829 metric tons. Then China’s LA’s Olympic Boulevard in the summer of 1971 when a
purchases began to tail off precipitously. By pre-pandemic gallon of gas could be had for 19.9 cents. Imagine that:
2019, U.S. exports of scrap paper to China had dropped filling the tank in a VW bug, handing over two busks,
Exhibit 6 U.S. Trade Surplus in Waste & Scrap Paper: 2005-2020
Source: U.S. Commerce Department
In Metric Tons
20,000,000
15,000,000
10,000,000
5,000,000
0
2005 2006 2007 2008 2009 2010 2011 2012 2013 2014 2015 2016 2017 2018 2019 2020
July 2021 Page 8West Coast Trade Report
Documenting the May 2021 TEU Numbers Continued
Exhibit 7 The Rapid Containerization of U.S. Scrap Paper Exports
Source: U.S. Commerce Department
Shares of Seaborne Export Tonnage
100%
80%
60%
40%
20%
0
2005 2006 2007 2008 2009 2010 2011 2012 2013 2014 2015 2016 2017 2018 2019 2020
and getting a dime back in change. That was then. Even highest in the nation. Among the contiguous states, only
adjusting for inflation, today’s gallon costs a lot more than Rhode Island was higher.
$1.33, especially if you’re driving a vehicle in California,
During the same period, California’s higher electricity
where a gallon this June cost $1.26 above the national
prices translated into Commercial & Industrial ratepayers
average.
paying $12.2 billion more than ratepayers elsewhere in
According to GasBuddy, California drivers paid an average the U.S. using the same amount of energy. Compared to
of $4.26. That’s the most expensive gasoline in the the lowest rate states, Commercial & Industrial ratepayers
country. Effective July 1, 2021, the state motor fuel tax paid $15.6 billion more.
increased $0.006 per gallon, keeping California’s fuel
taxes the highest among the states. In addition, sales
California’s Drought is Now Official
How do we know? Has Governor Newsom declared a
and use tax is applied against the full per gallon cost—the
water emergency? No, it’s official because the New York
cost of fuel plus the cost of the taxes—cleverly charging
Times and The Wall Street Journal have both featured
a tax on a tax on top of other taxes and fees. Within the
articles on how the drought is challenging agriculture
state, gasoline prices ranged from a low of $4.12 a gallon
in the Golden State. In a June 28 article, the Times told
in Bakersfield to a high of $4.47 in San Francisco.
readers the story of how farmers in the Central Valley
Diesel’s average price in California was $4.21 a gallon, were selling their water rights instead of using their
almost precisely a third higher than the national average. water allocations to, you know, actually grow crops. “In
Only in Hawaii does diesel cost more than in California. America’s fruit and nut basket, water is now the most
As with gasoline, the Golden State’s state diesel fuel tax precious crop of all.” On July 6, the WSJ reported on how
increased by $0.004 per gallon on July 1. almond growers were ripping out thousands of trees to
conserve irrigation water. The attention of New York-
And then there is the cost of electricity to power a home
based journalists with climate conditions and forest
(or EV recharging station) or a business. According to
fires in the West now vies for column space with their
the U.S. Energy Information Administration, California’s
customary summertime obsession with allegedly timely
average Industrial Price for the 12 months through April
travel articles about Maine.
2021 was 14.78 cents/kWh, 128.4% higher than the
U.S. average of 6.47 cents/kWh for all states other than On a related front, intense heat plus a wildfire in Oregon
California. California’s industrial prices were the fourth that threatened a key transmission line prompted
July 2021 Page 9West Coast Trade Report
Documenting the May 2021 TEU Numbers Continued
California Governor Newsom to issue another emergency be issuing more of these emergency declarations.
proclamation in mid-July. In what no doubt has set
Paging George Westinghouse. Paging Nicolai Tesla.
teeth to grinding in its executive suites, the state Air
Paging anyone who appreciates that you can’t keep
Resources Board was ordered to stand down in its vigilant
adding demand to the grid without also bolstering the
enforcement of sundry clean-air regulations, specifically
supply of kilowatts, especially when they are most
those regarding the “use of stationary and portable
needed.
generators or auxiliary ship engines to reduce the strain
on the energy infrastructure and increase energy capacity One more note before we finish. Each month we receive
during the Extreme Heat Event.” an email from an eminent box-counter who serves up
timely numbers on TEU volumes at the country’s principal
Considering the lack of alacrity with which California has
seaports. Generally, his figures jibe with what the ports
been girding its electric power grid to meet the ever-
themselves report. Except, that is, for the Port of New York/
increasing demand for the juice needed to run everything
New Jersey (PNYNJ). As everyone knows, PNYNJ seldom
from household gadgets to shore power installations at
posts its monthly tallies in a New York Minute. So, we’ve
seaports, one does have to wonder how some government
noticed some significant variances between the number of
agencies expect businesses like the aforementioned
TEUs our correspondent expects that PNYNJ will handle
seaports and their goods movement partners to abide by
and the number that PNYNJ ultimately fesses up to. In May,
clean-air regulations that oblige a transition to electrically
for example, inbound loads as finally reported by PNYNJ
powered equipment.
turned out to be 13,497 TEUs more than our correspondent’s
At a time when a prolonged drought threatens the estimate, while outbound loads were underestimated by
state’s hydroelectric generation capacity and as nuclear 24,868 TEUs. Patience, as we are occasionally reminded, is
continues to be phased out, the chances are only sometimes more than its own reward.
increasing that Governor Newson (or his successor) will
Truck Gate Activity Per Hour at Container Terminals
Ports of Los Angeles and Long Beach
2nd Quarter 2021
220,000
200,000
180,000
160,000
140,000
120,000
100,000
80,000
60,000
40,000
20,000
0
0:00 1:00 2:00 3:00 4:00 5:00 6:00 7:00 8:00 9:00 10:00 11:00 12:00 13:00 14:00 15:00 16:00 17:00 18:00 19:00 20:00 21:00 22:00 23:00
July 2021 Page 10West Coast Trade Report
Jock O’Connell’s Commentary:
Nuts to Houston?
Rumors seem to go a long way down at the general store. (almost all of which is grown in California’s Central Valley)
was shipped to markets in Europe and the Middle East via
“My cousin Wilbur says that he heard a guy up in Oakdale
the Port of Houston. Exhibit A shows the history of that
got so fed up with congestion at Oakland he sent a couple
trade since 2005.
of containers of almonds out through Houston last week,”
reported Farmer Edgar. What happened to minimize Houston’s share of the
almond export trade was not so much that almond
“Why, I heard that someone down Visalia way just did the
growers stopped shipping their product to Houston –
same thing,” chimed in Rancher Dolores.
although they did. What really induced the shift away
“Yup, word is it’s gotten so bad at Oakland that everyone’s from the Texas port was that almond exporters started
shipping almonds through Houston nowadays,” shipping more of their nuts in containers. As Exhibit
confidently added Grower Merle. B testifies, between 2005 and last year, the portion of
almond exports transported in containers doubled, to
Not surprisingly, chit-chat like that might easily and
89.2% from 44.1%.
quickly get around. Even reporters might catch wind of
it, especially if they work at a publication that covers As Exhibit C reveals, the principal beneficiaries of the
agriculture. So it was my phone buzzed the other day: shift from bulk to boxes were California’s big container
“I hear Houston’s the place to send your almonds these terminals but most of all the Port of Oakland, the maritime
days?” gateway closest to the center of the state’s (and therefore
the nation’s) almond production. With the transition to
Nuts, I replied in my best imitation of General McAuliffe.
boxes, the Bay Area port’s share of the almond export
(If you’ve never heard of Anthony McAuliffe’s one-word
trade jumped to 82.0% in 2020 from 52.9% fifteen years
reply to a German offer of surrender at Bastogne during
earlier.
the Battle of the Bulge in December 1944, you probably
know as much about the United States Army as Tucker Well, so much for history. The issue of port congestion is
Carlson.) a here-and-now concern. Are we indeed seeing an uptick
in exports through Houston in the past few months?
So, what’s the story (or non-story) here?
Is a jammed-up Oakland being abandoned by almond
Once upon a time, a fair amount of America’s almond crop shippers?
Exhibit A Houston’s Share of Seaborne Exports of Almonds: 2005-2020
Source: U.S. Commerce Department
25%
20%
15%
10%
5%
0
2005 2006 2007 2008 2009 2010 2011 2012 2013 2014 2015 2016 2017 2018 2019 2020
July 2021 Page 11West Coast Trade Report
Commentary Continued
Exhibit B Container Share of Seaborne Exports of Almonds: 2005-2020
Source: U.S. Commerce Department
100%
80%
60%
40%
20%
0
2005 2006 2007 2008 2009 2010 2011 2012 2013 2014 2015 2016 2017 2018 2019 2020
Exhibit C Leading Ports’ Shares of Seaborne Almond Exports: 2005-2020
Source: U.S. Commerce Department
Shares of Seaborne Export Tonnage
100%
80%
60%
40%
20%
0
2005 2006 2007 2008 2009 2010 2011 2012 2013 2014 2015 2016 2017 2018 2019 2020
n Houston n Oakland n LA/LB
The short answer is not so’s you’d much notice. To be port congestion, the victims would be the Southern
sure, there has been a small bump in almond shipments California Ports of Long Beach and Los Angeles. Their
through Houston. May, for example, did see 1,044 metric combined 10.3% share of seaborne almond exports in
tons of almonds depart from the Texas port, which May declined to 14.3% and 11.0% the previous two Mays.
boosted the Gulf Coast port’s share of the almond export
At the end of the day, when the sheep come home, the
trade to 1.1% from 0.4% a year earlier and from 0.2% the
data show there has lately been a meager boost in the
May before then.
already meager volume of almond exports through the
But, as Exhibit D illustrates, Houston’s share of the Port of Houston. Idle hearsay about the imminent demise
seaborne almond export trade still registers as a barely of the Port of Oakland as a major conduit for almond
blip. By comparison, Oakland’s share this May was 87.9%, exports is nonsense. Interestingly, the last time there was
up from 84.3% last May and from 85.2% in May 2019. If an appreciable surge in almond exports through Houston
Houston gained at anyone’s expense from West Coast came during the latter stages of the labor-management
July 2021 Page 12West Coast Trade Report
Commentary Continued
dispute that slowed the pace of container movements a deterrent to an off-the-mark forecast. A useful, if very
through West Coast ports in the fall and winter of 2014- seldom used synonym for the business of forecasting
2015. After averaging a 1.9% share of almond exports is haruspication, which perhaps fittingly sounds a lot
in the year leading up to the slowdown, Houston’s share like what old-time baseball players used to do with their
jumped to 6.3% in February and then to 12.4% in March chewing tobacco between pitches, or even onto their
and 9.0% in April, before falling back to levels that seldom pitches. Of course, no one doctors the ball today, we are
journey above two percent and ultimately dwelled below assured.
one percent until this spring.
Anyway, those who do have an appreciable financial
There’s no compelling reason to think that the Port of stake in gauging trade flows over the next several months
Oakland will not eventually regain those lost slivers of the are apt to be a good deal hedgier than professional
almond export trade, as it had in the past. clairvoyants. Anyone reading the press should be aware
of the testy state of relations between Washington and
A Foreboding on Forecasting Beijing. So, if I’m an importer who sources a lot of my
I’ve been watching various cargo forecasters implying merchandise from China, I’m probably guessing it might
that the end of the surge in containerized imports might be best to fill my warehouses with merchandise well
be in sight only to those whose models come equipped beyond the level my market research staff are telling me
with binoculars. I have no reason to doubt these outlooks. consumers will want to buy this coming fall and winter. I
But I do have a problem with their methodologies, which might even be willing to pay a premium price for getting
are typically weighted to emphasize (often exclusively) those goods into my stateside inventory just in case the
economic factors such as employment growth, GDP balloon goes up.
increases, the value of the dollar, household consumption,
etc. Of course, the modelers will normally allude to non- If there are more than a few importers thinking the same
economic considerations such as changes in trade policy. grim thoughts, certainly the import surge won’t have
But those are hard to quantify and so are generally left out much reason for ending anytime soon.
of the forecasting methodology.
Disclaimer: The views expressed in Jock’s commentaries
The economists who produce forecasts generally have are his own and may not reflect the positions of the Pacific
only their reputations at stake. Modern attention spans Merchant Shipping Association.
being what they are, the risk to one’s good name is hardly
Exhibit D Houston vs. Oakland Shares of Containerized Almond Exports by Sea: January 2020-May 2021
Source: U.S. Commerce Department
Shares of Containerized Seaborne Export Tonnage
100%
80%
60%
40%
20%
0
Jan-20 Feb-20 Mar-20 Apr-20 May-20 Jun-20 Jul-20 Aug-20 Sep-20 Oct-20 Nov-20 Dec-20 Jan-21 Feb-21 Mar-21 Apr-21 May-21
n Houston n Oakland
July 2021 Page 13West Coast Trade Report
Evolving Public Policies Aimed at Maritime Require an Effective,
Positive Response
By Captain Mike Moore, Vice President PMSA
As Bob Dylan said, “You don’t need a weatherman to know noise when Southern Resident Killer Whales are foraging
which way the wind blows.” nearby. The Quiet Sound program also recently secured
state funding from the Washington state legislature. This
We in the maritime industry know the wind is blowing -- and
program is being modeled after a program already in place
blowing hard. There is pressure to make the supply chain
in Canada. And because we have shared waterways, we are
stronger and more resilient, to make vessels more efficient,
collaborating with those efforts as well.
clean, and quiet, and provide affordable access to Asian
markets for growers and manufacturers at a low cost. In addition to new and evolving strategies, the maritime
All the while, any effort to build a new terminal or expand industry in Puget Sound has a lot to be proud of. Puget
an old one is met with months and years of study, legal Sound has the enviable record of zero oil spill incidents
wrangling, and endless accusations that we are despoiling from a cargo or passenger vessel while transiting to or
the environment. Simply waiting for these pressures to from a Puget Sound port due to a collision, grounding,
ease is not viable and inadequate to the times. We as an explosion or fire.
industry must continue to respond positively, proactively,
Continuous improvement is alive and well with
forcefully, and yes, collaboratively.
adjustments to traffic lanes, moving the entrance buoy
The good news is: we are. The bad news is: it’s not enough. to the Strait of Juan de Fuca further out to push vessel
transits further off the coast, implementing safe routing
Fortunately, the shipping industry and the ports have
through the Aleutian Islands on the way to or from our
stepped up to engage these challenges in a proactive
ports with plans to expand this into a voluntary Pacific
fashion. Perhaps the best example of positive, proactive
Safety Initiative for the entire West Coast. In addition,
leadership by industry was the coordinated push to
vessel designs have moved fuel tanks from the bottom and
implement a North American Emissions Control Area
side of vessels to protected locations within the vessel,
(ECA) and a worldwide use of cleaner fuels, both of which
installed ballast water treatment systems, implemented
continue to significantly reduce emissions – by over 90%
better navigation systems and operators continue to
for some emissions.
implement voluntary Standards of Care embedded in
Container liner services continue to increase vessel size Harbor Safety Plans -- the list goes on.
to leverage more efficient economies of scale operations,
These successes don’t mean that we should get
add vessels to weekly service strings to allow for slower
complacent. It does mean we should continue to
steaming, reduce fuel consumption and emissions, cut
educate policymakers that they should be thoughtful
the number of port calls, participate in incentive programs
when proposing changes to a comprehensive system
offered by ports --all while investing in new ships and
that is working. PMSA staff work with legislators,
technologies. In addition, dual fuel vessels are being
port commissioners, mayors, and city and county
introduced to allow use of lower emission LNG all while
councilmembers to make sure that changes being
other propulsion power options like hydrogen or ammonia
proposed do not compromise safety or the environmental
are being fully evaluated.
gains we have achieved or undermine the international,
The Pacific Merchant Shipping Association was one of bilateral or federal regimes. And with all of this, we need
the original partners in the Puget Sound Clean Air Forum, to keep front and center the men and women who depend
which resulted in air emission inventories and targeted upon the family wage jobs our industry provides.
strategies that significantly reduced emissions from
But attention in the past couple of decades has
all maritime sectors. Currently, PMSA is working with
focused not only on safety but on reducing the overall
governments, tribes, and others to voluntarily reduce ship
July 2021 Page 14West Coast Trade Report
Evolving Public Policies Continued
environmental footprint. Instead of just preventing oil switch. LNG provides across the board emissions reduction
spills, think of ballast water management, air emissions benefits including carbon reduction. Others will follow.
reductions, and now underwater noise reductions for
But of course, the recent focus is on zero carbon
Southern Resident Killer Whale recovery.
emissions, and some will not accept anything less even if
Transboundary issues have also moved beyond navigation not currently feasible. It will happen but not by precluding
in our joint waterways. While we have longstanding treaties smart, achievable near-term steps. Doing so would
with Canada on free navigation and implementation preclude continuous meaningful improvements like LNG
of a highly effective cooperative vessel traffic system, use or the use of hybrid technologies.
discussions now include overall impacts of vessel and
Most industry watchers and regulators have read about
terminal operations.
the testing of alternative fuels like hydrogen and ammonia
Engagement by tribes, environmental groups, First Nations and clearly vessel design and fueling infrastructure
in Canada, elected officials and citizens on both sides of decisions are on the horizon but there has to be a realistic
the border has resulted in the rejection of a number of acknowledgment that this transition will take time. We
proposed maritime projects in part based on concerns over don’t know yet which technologies will offer the most
increased vessel traffic. Ironically, Puget Sound port calls benefit while not compromising safe operations. And to
have decreased by 30% since the peak in the early 90’s. move forward, we can’t let the perfect be the enemy of the
Introduction of larger ships to provide economies of scale good.
and shifts in port call rotation and selection has impacted
It is clear to all of us which way the wind is blowing. We
those numbers.
cannot escape the challenges before us. But through
But the toughest challenge we face is reducing our carbon ongoing engagement, education, and proactive leadership,
footprint. This discussion started many years ago and is our industry will continue to grow and provide the services
now front and center for industry. Some vessel owners and jobs that have been the core of our communities for
have decided to switch to Liquefied Natural Gas (LNG) over 100 years.
-- Puget Sound has a facility coming on-line to do just that
with a weekly service operator already lined up for the
Interested in membership in PMSA?
Contact Laura Germany for details at: lgermany@pmsaship.com or 510-987-5000.
PMSA Copyright © 2021
It is prohibited by law to forward this publication to any other person or persons. This material may not be re-published, broadcast,
rewritten or distributed without written permission from PMSA. Follow PMSA on Twitter @PMSAShip and Facebook.
July 2021 Page 15West Coast Trade Report
Import Dwell Time Is Up For June; Rail Dwell Time Is Up
July 2021 Page 16You can also read