What Affects Dewatering Performance of High Density Slurry?
←
→
Page content transcription
If your browser does not render page correctly, please read the page content below
minerals
Article
What Affects Dewatering Performance of High Density Slurry?
Yunhui Li 1, *, Heather Kaminsky 1 , Xue Yuki Gong 1 , Yijia Simon Sun 1 , Mohammed Ghuzi 1 and
Ardalan Sadighian 2

                                          1   Centre for Oil Sands Sustainability, Northern Alberta Institute of Technology, Edmonton,
                                              AB T6G 2R1, Canada; HKAMINSKY@nait.ca (H.K.); YUKIG@nait.ca (X.Y.G.); SSUN@nait.ca (Y.S.S.);
                                              MOHAMMEDG@nait.ca (M.G.)
                                          2   Suncor Energy Inc., Calgary, AB T2P 3E3, Canada; asadighian@suncor.com
                                          *   Correspondence: yunhuil@nait.ca; Tel.: +1-780-471-8588

                                          Abstract: The dewatering of flocculated high density slurry presents a significant challenge to most
                                          mining industries. The new technologies to treat high density slurry require a consistent and robust
                                          flocculation method in order to enter the market of tailings management. The flocculation of high
                                          density slurry, however, due to its complexity, is always a challenge to be undertaken appropriately
                                          and to evaluate the dewatering performance correctly. This paper probes the complexity by using a
                                          torque-controlled mixing technique to demonstrate the influence of feed properties, polymer type,
                                          polymer dosage, and mixing conditions on dewatering performance. The study shows that flocculant
                                          should be dosed at the optimal range to achieve the highest dewatering performance. A full dosage
                                          responsive curve including under dosage, optimal dosage, and overdosage is critical to evaluate the
                                          dewatering performance of high density slurries and flocculants. The mixing conditions such as
                                          mixing speed, mixing time, and geometry of the mixing impeller affect the flocculation efficacy. It

                                   was found that the dewatering performance of high density slurry is sensitive to solids content, water
                                          chemistry, and clay activity. High sodicity and high clay activity in the high density slurry decreases
Citation: Li, Y.; Kaminsky, H.;
                                          the dewatering performance. Therefore, it is critical to evaluate flocculants across multiple feeds
Gong, X.Y.; Sun, Y.S.; Ghuzi, M.;
Sadighian, A. What Affects
                                          and dosages with replication in order to select optimal dewatering performance. Using multiple key
Dewatering Performance of High            performance indicators (KPIs) to build technical and economic criteria is also critical for polymer
Density Slurry? Minerals 2021, 11, 761.   evaluation.
https://doi.org/10.3390/
min11070761                               Keywords: tailings dewatering; fluid fine tailings; high density slurry; flocculation

Academic Editor: Pedro G. Toledo

Received: 20 June 2021                    1. Introduction
Accepted: 13 July 2021
                                                Most mining industries produce very large volumes of byproduct called tailings such
Published: 14 July 2021
                                          as flotation tailings from bitumen extraction, which are usually in high density slurry form.
                                          High density slurries are defined as the slurries where the solids are uniformly distributed
Publisher’s Note: MDPI stays neutral
                                          in the slurry and do not form a vertical concentration gradient [1,2]. A major environmental
with regard to jurisdictional claims in
                                          and technical challenge to the disposal or reuse of the components of these high density
published maps and institutional affil-
                                          slurries are the efficient separation of fine particles from water. Dewatering the high
iations.
                                          density slurries, for recycling the release water and reducing the tailings storage footprint,
                                          is usually slow and incomplete [3]. The typical solution for this has been dilution prior
                                          to flocculation [4,5]. However, research in oil sands has shown that it can be challenging
                                          to recover more than the dilution water, especially for clay dominated slurries [6]. For
Copyright: © 2021 by the authors.
                                          example, Suncor found that the amount of water release decreased from 20% to 12% in
Licensee MDPI, Basel, Switzerland.
                                          20 min when the mature fine tailings were diluted from 40% of solids to 20% of solids [6].
This article is an open access article
                                          Advances at Suncor Energy Inc. in high density flocculation have been able to dewater
distributed under the terms and
                                          tailings to a greater extent than previously assumed, but significant care and attention must
conditions of the Creative Commons
                                          be paid to the treatment used, both from a chemistry and a mixing perspective [6]. The
Attribution (CC BY) license (https://
creativecommons.org/licenses/by/
                                          primary set of challenges to market entry for new high density slurry treatment reagents is
4.0/).
                                          a consistent and robust method obtained at a meaningful scale of testing.

Minerals 2021, 11, 761. https://doi.org/10.3390/min11070761                                             https://www.mdpi.com/journal/minerals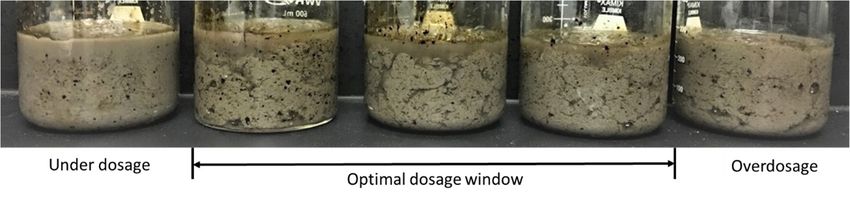
Minerals 2021, 11, 761                                                                                                       2 of 16

                               Most dewatering reagents are high molecular weight flocculants, which induce ag-
                         glomeration of fine particles and solid-liquid separation by binding the particles and
                         enhancing floc strength [7]. Flocculation is a multistep process, normally carried out under
                         conditions that are constantly varying. In general, the flocculation process using a high
                         molecular weight flocculant involves three principal steps: (1) flocculant dispersion in
                         the high density slurry by agitation; (2) floc formation and growth through binding the
                         flocculant on the suspended particles; and (3) floc breakage due to shear, turbulence, etc. [7].
                         Accurate control of any flocculation process is known to depend upon key parameters
                         such as properties of the high-density slurry, type of flocculant, flocculant chemistry, floc-
                         culant dosage, flocculant injection conditions, and mixing conditions employed during
                         the flocculation (Table 1). Mixing conditions are often not sufficiently understood but are
                         absolutely critical in these processes with multiple reaction steps (attachment, growth, and
                         breakage) and where diffusion/concentration of a reagent is important. Bourne provides
                         an excellent summation of the different factors to consider in mixing and selectivity of
                         chemical reactions which all apply in the flocculation of high-density slurries [8]. Given
                         this importance it is critical that the screening tests account for the type of mixing that will
                         be experienced in the field, at least in general terms.

                         Table 1. Key parameters affecting the high density slurry dewatering performance.

                               Parameter               Representative Lab Variables                     Field Reality
                                                                                             Only density can be measured. All
                              Type of high           Solids%, bitumen%, sand content,
                                                                                               other elements vary without
                             density slurry             MBIa , and water chemistry
                                                                                                          control.
                                                       Molecular weight, charge, and         Controlled variable, though degree
                           Type of flocculant
                                                                 structure                        of hydration may vary.
                                                                                                  Since optimum dosage is
                                Dosage of              Continuum from underdose to            determined by the widely varied
                                flocculant                      overdose                      feed properties, this is not easily
                                                                                                   controllable in the field.
                                                    Energy into the high density slurry
                                                                                               Function of FFTb flow rate and
                                 Premix              before flocculation: mixing speed
                                                                                                      pipeline length.
                                                                  and time
                                                        Rate of injection, location of
                                                    injection, and mixing speed of high
                                                                                             Function of FFT flow rate, polymer
                          Flocculant injection      density slurry during injection (i.e.,
                                                                                               flow rate, and injector design.
                                                    Relative energy of flocculant to high
                                                          density slurry at injector)
                                                                                              Function of flow rate & transport
                                 Mixing                    Mixing speed and time
                                                                                                          distance.
                                                       Geometry of mixing blade and          Function of mixing vessel/pipeline
                          Geometry of mixer
                                                             mixing beaker                              length used.
                         Note: MBIa : methylene blue index; FFTb : fluid fine tailings.

                               Laboratory small scale dewatering tests are critical for industry reagent selection
                         to treat the high-density slurry wastes prior to the field trials [9]. This is because large
                         scale trials require long duration and high costs to obtain reliable data; meanwhile, small
                         scale trials are cost- and time-effective for application development and optimization,
                         particularly for initial reagent selection. This present work highlights the key factors
                         affecting the dewatering performance of high density slurries treated with commercial
                         flocculants used in the oil sands industry. The high density slurry samples in this study
                         are fluid fine tailings (FFT) which are the wastes from the oil sands extraction in Northern
                         Alberta, Canada. FFT is defined as a liquid suspension of fines in water, with a solid content
                         greater than 2%, but less than the solids content corresponding to the liquid limit [3].
                         Another byproduct of oil sands extraction, known as oil sands process water (OSPW), was
Minerals 2021, 11, 761                                                                                                                        3 of 16

                                      used to prepare the flocculant solutions and diluted FFT in this study. OSPW is a complex
                                      mixture of dissolved inorganic and organic compounds [3]. The anionic polyacrylamide
                                      flocculant A3338, which is commercially available and widely used in the oil sands tailings
                                      treatment by both industries and researchers, is chosen for the rapid dewatering of FFT
                                      samples in this study. This work describes the repeatable and reproducible flocculation
                                      method used for laboratory small scale dewatering studies. Using this method, this study
                                      reveals the impact of the mixing conditions, FFT feed parameters, and flocculants dosages
                                      and properties on the dewatering performance and robustness of high density slurry. In
                                      addition, a currently used flocculant (NRG1000) by one of the oil sands industries along
                                      with the polymer A3338 are studied as examples for the polymer evaluation on the high
                                      density slurry dewatering.

                                       2. Materials and Methods
                                       2.1. Materials
                                            Four types of FFT (FFT-1, FFT-2, FFT-3, and FFT-4) from oil sands tailings ponds were
                                       characterized by Dean and Stark (D&S) for bitumen, solids, and water contents [10], methy-
                                       lene blue index (MBI) to indicate the clay activity of a sample [11], wet sieving for fines
                                       content [12], density, pH, electronic conductivity (EC), major cations and anions by ion chro-
                                       matography (IC), sodium adsorption ratio (SAR) salinity, and alkalinity (Tables 2 and 3).
                                       Methylene blue index is an index test that measures how much methylene blue dye can
                                       be adsorbed on the clay surfaces of a sample by a titration test [11]. Because methylene
                                       blue has a strong affinity to clay surfaces and hence displaces any other ion on the clay
                                       surfaces, the methylene blue index is used to describe the clay content and activity [11].
                                       FFT-3 and FFT-4 were diluted using the OSPW (Table 4), and the calculated composition
                                       and measured properties were shown in Tables 2 and 3 as well.

                                Table 2. FFT characterization on composition, MBI, fines content, pH, and EC.

                Solids           Bitumen             Water                            Fines Content               Electronic             Sands to
                                                                     MBI
 Sample        Content           Content            Content                          Passing 325 Mesh     pH     Conductivity           Fines Ratio
                                                                  (mEq100 g)
              (Weight %)        (Weight %)         (Weight %)                           (Weight %)                 µS/cm)                  (SFR)
  FFT-1           32.15              2.15              65.70         10.4                   91.7          7.8          2216                0.09
  FFT-2           24.68              1.23              74.09         14.1                   92.8         8.20          2900                0.08
  FFT-3           39.44              1.33              59.23          8.1                   88.0         7.92          1320                0.14
  FFT-4           35.92              3.03              61.05         10.7                   94.0         7.92           660                0.06
 Diluted
                  23.25              0.78              75.97          8.1                   88.0         7.86          1074                0.14
  FFT-3
 Diluted
                  23.10              1.95              74.95         10.7                   94.0         7.80          947                 0.06
  FFT-4

                                                   Table 3. Major cations and anions. Unit is mg/L.

   Sample                Na+                K+            Ca2+             Mg2+             Cl−         HCO3 −         SO4 2−              SAR
     FFT-1            795.83            13.19             15.34            11.51           643.27         -             90.24              37.4
     FFT-2            305.90            23.01             12.80             3.65           137.90       392.94            -                 9.3
     FFT-3             221              16.30             47.00            25.70            490          490            282.2              6.4
     FFT-4            96.60             11.60             20.70            10.50            150          150            174.2              4.3

                         Table 4. The water analysis of OSPW: pH, EC, and major cations and anions (unit is mg/L).

 Sample         pH        EC (µS/cm)             Na+      K+       Ca2+            Mg2+      Cl−        F−       HCO3 −       NO3 −         SO4 2−
  OSPW         8.29            949           162.16       9.57     37.70           12.70     32.44      3.72       -            17.05       241.60

                                           Two anionic polyacrylamide flocculants, polymer NRG1000 and A3338, produced by
                                       SNF Canada, were used in this study. The characterization of the two polymers is shown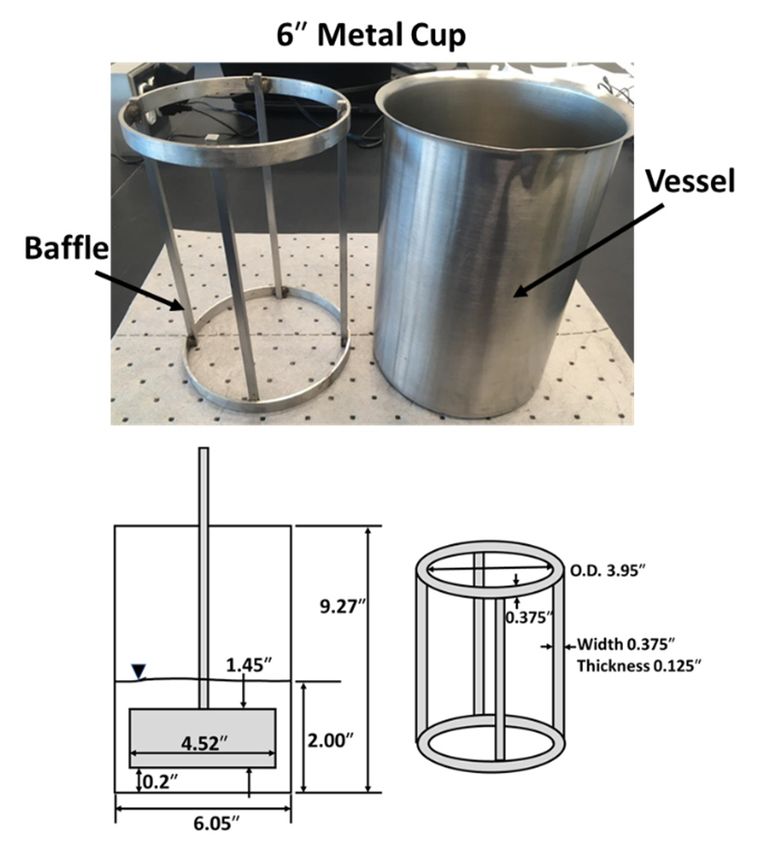
FFT-4 96.60 11.60 20.70 10.50 150 150 174.2 4.3
Table 4. The water analysis of OSPW: pH, EC, and major cations and anions (unit is mg/L).
Sample pH EC (µS/cm) Na+ K+ Ca2+ Mg2+ Cl− F− HCO3− NO3− SO42−
Minerals
OSPW 2021, 11, 761
8.29 949 162.16 9.57 37.70 12.70 32.44 3.72 - 17.05 4 of 16
241.60
Two anionic polyacrylamide flocculants, polymer NRG1000 and A3338, produced by
SNF Canada,
in Table 5. All were used
polymer in this study.
solutions The characterization
were prepared of the two
at a concentration polymers
of 0.45 wt% inisOSPW
shown
in Table 5. All polymer solutions were prepared
and allowed to hydrate for at least 1 h before use. at a concentration of 0.45 wt% in OSPW
and allowed to hydrate for at least 1 h before use.
Table 5. Characterization of polymers A3338 and NRG1000.
Table 5. Characterization of polymers A3338 and NRG1000.
Charge Molecular Bulk Density Brookfield Viscosity (cP) Particle Size
Sample Charge Molecular Bulk(kg/m
Den-3 ) Brookfield Viscosity (cP) Particle
Sample Density Weight at 5.0 g/L at 2.5 g/L At 1.0 g/L (mm)Size
Density Weight sity (kg/m3) at 5.0 g/L at 2.5 g/L At 1.0 g/L (mm)
A3338 High High 0.6–0.9 1520 570 250 0.15–2
A3338 High High 0.6–0.9 1520 570 250 0.15–2
NRG1000 Medium Low 0.80 1250 450 150 0.15–2
NRG1000 Medium Low 0.80 1250 450 150 0.15–2
2.2.
2.2.Equipment
Equipment
The
Thesetup
setupfor forflocculation
flocculationconsists
consistsof
ofaavessel
vesselwith
withaabaffle,
baffle,an
animpeller,
impeller,aaperistaltic
peristaltic
pump
pump(coleparmer
(coleparmerDrive/DISP
Drive/DISP MFLX
MFLX BENCH
BENCH115/230)
115/230) for
for polymer
polymer injection,
injection, and
andan
an
overhead mixer (Heidolph Hei-Torque 100 Precision Base) capable of monitoring
overhead mixer (Heidolph Hei-Torque 100 Precision Base) capable of monitoring the the torque
exerted on the impeller
torque exerted shaft during
on the impeller shaft the mixing
during (Figure(Figure
the mixing 1). Three1). types
Threeof vessels
types were
of vessels
used in this study: 4” metal cup with a built-in baffle [13], 6” metal cup with
were used in this study: 4″ metal cup with a built-in baffle [13], 6″ metal cup with an an inserted
baffle, andbaffle,
inserted a glass beaker
and with
a glass an inserted
beaker with anbaffle (Figure
inserted 2a–c).
baffle (Figure 2a–c).
Figure 1. Flocculation setup.
Figure 1. Flocculation setup.
2.3. Homogenization of FFT
During storage, larger particles tended to settle out of the FFT over time. The following
procedure was used to homogenize and subsample the desired volume of FFT from a 20 L
bucket for each flocculation vessel. (1) Homogenize FFT for 10 min using a drill mixer
with a paint-mixing attachment (Figure 2d). When homogenizing the drill mixer was
kept below the sample surface to minimize entrainment of air which could also influence
flocculation performance. (2) Measure solids content to confirm the FFT was homogenized.
(3) Measure density and calculate the mass of FFT required for 300 mL of FFT for 4” cup
testing, 1000 mL of FFT for 6” cup testing, or 230–270 mL of FFT for 1000 mL glass beaker
testing. (4) Re-homogenize FFT for 10 s with the drill mixer before each subsampling on
the same day testing. (5) Subsample the calculated mass of FFT into the flocculation vessel.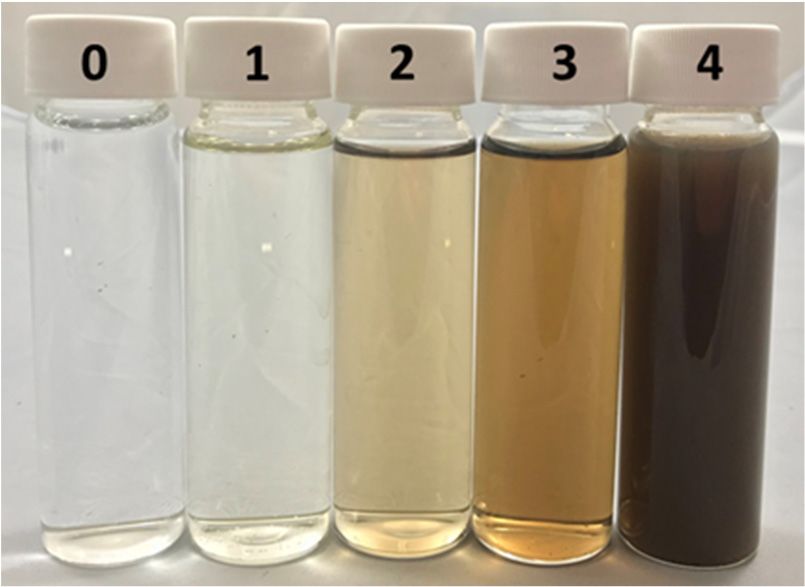
drill mixer with a paint-mixing attachment (Figure 2d). When homogenizing the drill
                                    mixer was kept below the sample surface to minimize entrainment of air which could also
                                    influence flocculation performance. (2) Measure solids content to confirm the FFT was
                                    homogenized. (3) Measure density and calculate the mass of FFT required for 300 mL of
                                    FFT for 4″ cup testing, 1000 mL of FFT for 6″ cup testing, or 230–270 mL of FFT for 1000
Minerals 2021, 11, 761
                                    mL glass beaker testing. (4) Re-homogenize FFT for 10 s with the drill mixer before5 of 16
                                                                                                                         each
                                    subsampling on the same day testing. (5) Subsample the calculated mass of FFT into the
                                    flocculation vessel.

                                    (a)                                                               (b)

                                    (c)                                                               (d)
       Figure2.2. Schematic
      Figure      Schematic dimensions
                            dimensions ofof flocculation
                                             flocculation vessels,
                                                           vessels,baffles,
                                                                    baffles,and
                                                                             andimpellers:
                                                                                 impellers:(a)(a)
                                                                                                4″4”
                                                                                                   metal cup
                                                                                                     metal   setup
                                                                                                           cup      forfor
                                                                                                                setup   flocculation; (b)
                                                                                                                           flocculation;
       6″ metal cup setup for flocculation; (c) dimension of the baffle for a 1000 mL of glass beaker as the flocculation vessel; (d)
      (b) 6” metal cup setup for flocculation; (c) dimension of the baffle for a 1000 mL of glass beaker as the flocculation vessel;
       paint-mixing impeller for the FFT homogenization.
      (d) paint-mixing impeller for the FFT homogenization.

                                   2.4. Flocculation of FFT
                                        The desired mass of FFT was subsampled into the flocculation vessel. The volume
                                   of FFT required was determined based on the ability to place the mixing impeller in a
                                   central position in the flocculation vessel. The mass of FFT was then calculated based
                                   on the average FFT density. Mass was used for each subsample rather than volume to
                                   ensure a consistent sample and that air entrainment did not alter the amount of sample
                                   substantially. The baffled vessel with the sample was assembled onto the overhead mixer
                                   with the impeller. The FFT was pre-sheared until a stable torque was observed in order
                                   to remove thixotropic effects that may be present due to the handling of the FFT prior to
                                   testing [13]. For consistency, pre-shearing for 1 min at 300 rpm was conducted for all the
                                   flocculations in this study. Once the minute of pre-shearing was completed, the polymer
                                   solution was injected into the vessel at a pre-determined rate (20 mL/s in this study). The
                                   injection position was 0.5 cm–1 cm below the surface of the FFT slurry. The torque reading
                                   on the overhead mixer was monitored during the mixing process. Once the peak or max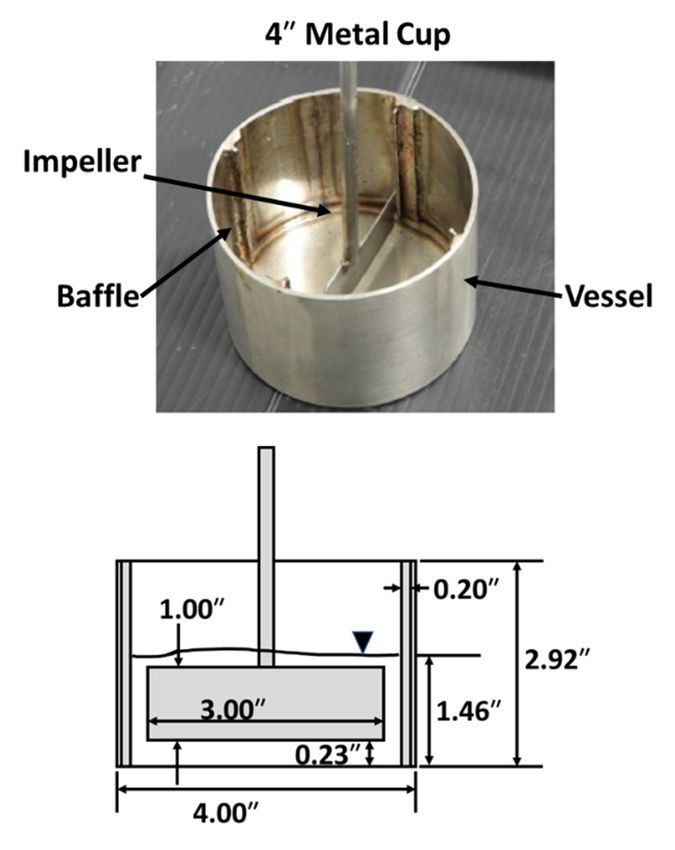
tially. The baffled tially.
vesselThewithbaffled
the sample
vesselwas withassembled
the sample ontowasthe overheadonto
assembled mixer thewith
overhead mixer with
the impeller. The FFT was pre-sheared until a stable torque was observed
the impeller. The FFT was pre-sheared until a stable torque was observed in order to re- in order to re-
move thixotropic effects
move that may beeffects
thixotropic presentthat duemay
to the
be handling
present due of the FFThandling
to the prior to testing
of the FFT prior to testing
[13]. For consistency,[13].pre-shearing
For consistency,for 1 pre-shearing
minute at 300for rpm was conducted
1 minute at 300 rpm forwas
all the floc-
conducted for all the floc-
culations in this study. Once the minute of pre-shearing was completed, the polymer
culations in this study. Once the minute of pre-shearing was completed, the polymer so- so-
Minerals 2021, 11, 761 6 of 16
lution was injectedlution
into thewasvessel
injectedat ainto
pre-determined
the vessel at rate (20 mL/s in this
a pre-determined ratestudy).
(20 mL/s Thein this study). The
injection position was 0.5 cm–1
injection cm below
position thecm–1
was 0.5 surface
cmof the FFT
below the slurry.
surfaceThe torque
of the readingThe torque reading
FFT slurry.
on the overhead mixer was monitored during the mixing process.
on the overhead mixer was monitored during the mixing process. Once the peak or max
Once the peak or max
torque was reached,
torquetorquethe mixing
was reached, speed was
the mixing
was reached, reduced immediately
speed speed
the mixing was reduced to 50 rpm
immediately
was reduced and the
to 50 rpm
immediately mixing
to 50and
rpm the mixing
and the mixing
was continuedwasatcontinued
50 rpm for
at 15
50s.rpm for 15
was continued at 50 rpm for 15 s. s.
The measurement method
The measurement
The of the
measurement dewatering
method method performance
of the of
dewatering
the dewatering was conducted
performance wasusing
performance wasim-
conducted using using
conducted im- im-
mediate drainage
mediate of a flocculation
drainage of a slurry for
flocculation 24 h using
slurry for #18
24 mesh
h using sieves
#18 or
mesh kitchen
sieves
mediate drainage of a flocculation slurry for 24 h using #18 mesh sieves or kitchen sieves sieves
or kitchen sieves
with the same opening
with the
withsame(1 opening
the mm)
same(Figure
(1 mm)
opening 3) (1
[13].
(Figure
mm)After
3) 24 hAfter
[13].
(Figure drainage,
3) the 24
24 After
[13]. solids
h drainage, content
the of
solidsthe
h drainage, content
solidsofcontent
the of
the flocs wasflocs
measured
was by
measured subsampling
by flocs
subsampling into
flocsa small
into a aluminum
small aluminumpan placed
pan
the flocs was measured by subsampling flocs into a small aluminum pan placed in an in
placed anin an oven at
oven at 100 100 ◦ C for
°C for overnight
oven at 100drying.
overnight °Cdrying. TheThe
for overnightrelease water
release water
drying. was
The wascollected
collected
release and
waterand measured
wasmeasured
collected totoand
determine
measured to
mass,clarity,
determine mass, clarity, and
and color.
color.
determine mass, clarity, and color.
Figure
Figure 3. The 3. The
process process
of 24 of 24 htest
h3.drainage drainage
on24 test on dewatering performance.
dewatering
Figure The process of h drainageperformance.
test on dewatering performance.
2.5. Color and2.5. Colorofand
Clarity Clarity
Release
2.5. Color and
of Release Water
Water
Clarity of Release Water
The color of The color of
the release
The color
the release
water offrom thewater from
treated
the release water FFT the
was
from
treated
themeasuredFFT according
treated FFT
was measured according to a
to a self-
was measured according to a self-
self-made
made 5-scale category 5-scale category (Figure 4a): 0—clear and colorless; 1—pale yellow;
or2—yellow or
made(Figure
5-scale4a): 0—clear
category and colorless;
(Figure 4a): 0—clear1—pale yellow; 2—yellow
and colorless; 1—pale yellow; 2—yellow or
light brown;
light brown; 3—brown; 3—brown;
and 4—black. and 4—black.
The and
clarity The clarity
of the release of the release
waterofwas water
measuredwas measured by
by awas measureda
light brown; 3—brown; 4—black. The clarity the release water by a
clarity wedge clarity wedge
withclarity withdonated
0–46 scales 0–46 scales donated by SNF
by SNF Canada (Figure 4b).
wedge with 0–46 scalesCanada
donated (Figure
by SNF 4b).
Canada (Figure 4b).
(a) (a) (b) (b)
Figure 4. (a) Torque profiles of the flocculation on A3338-treated FFT-4 with different dosages; (b) The net water release
(NWR) results corresponding to the torque profiles of the flocculation.
3. Results
3.1. Effect of Polymer Dosage
In general, the flocculation performance of the polymer increases with the dosage
up to a certain optimum point and then decreases with further addition of the polymer
due to the repulsion between the polymer-covered particles [14]. A full dosage response
curve is recommended to determine the dewatering performance of polymer treated FFT.
For a full dosage curve, a single shot injection of polymer solution is performed from
under-dosed conditions (low dewatering performance) to an optimal dosed condition
(highest dewatering performance), and then to an over-dosed condition (low dewatering
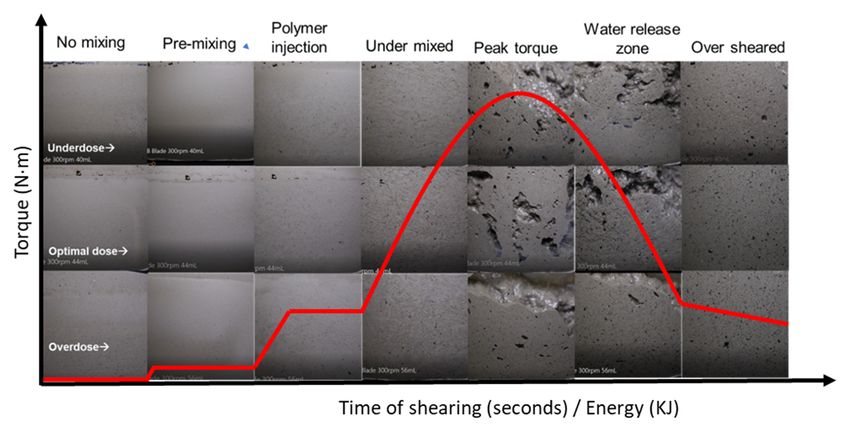
performance) [13]. In the optimal dosage range as shown in Figure 5, large flocs were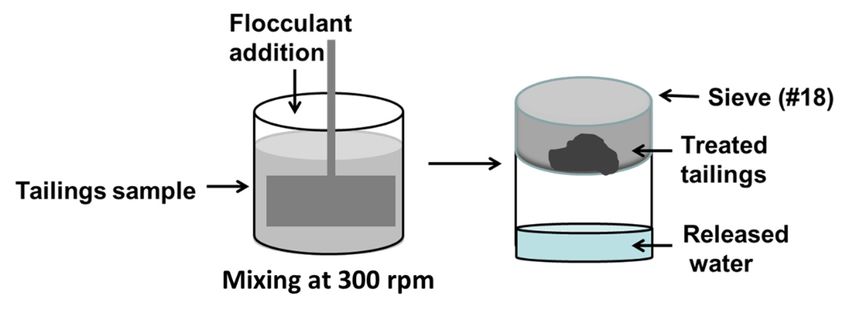
In general, the flocculation performance of the polymer increases with the dosage up
to a certain optimum point and then decreases with further addition of the polymer due
to the repulsion between the polymer-covered particles [14]. A full dosage response curve
is recommended to determine the dewatering performance of polymer treated FFT. For a
Minerals 2021, 11, 761 full dosage curve, a single shot injection of polymer solution is performed from under- 7 of 16
dosed conditions (low dewatering performance) to an optimal dosed condition (highest
dewatering performance), and then to an over-dosed condition (low dewatering perfor-
mance) [13]. In the optimal dosage range as shown in Figure 5, large flocs were observed
observed
and and separated
separated from the
from the slurry slurry resulting
resulting in visibleinrelease
visiblewater;
releasemeanwhile,
water; meanwhile, in the
in the under-
underdose and overdose ranges, small or no flocs were formed and no release
dose and overdose ranges, small or no flocs were formed and no release water could be water could
be observed
observed in the
in the slurry.
slurry. Single
Single or fixed
or fixed dosage
dosage comparisons
comparisons maymay
leadlead to false
to false results
results and
and decisions as different high-density slurries have different compositions and water
decisions as different high-density slurries have different compositions and water chem-
chemistries, resulting in different dosage responses to the same flocculant, which impacts
istries, resulting in different dosage responses to the same flocculant, which impacts the
the flocculation performance [9]. Different flocculants have different molecular weights,
flocculation performance [9]. Different flocculants have different molecular weights,
charges, structures, chemical composition, viscosities, and hence impact on flocculation
charges, structures, chemical composition, viscosities, and hence impact on flocculation
performance as well. Testing over the range of conditions that could be seen rather than
performance as well. Testing over the range of conditions that could be seen rather than
attempting to achieve a ”representative” sample is important in order to properly evaluate
attempting to achieve a ″representative″ sample is important in order to properly evaluate
technology for use.
technology for use.
Figure 5.
Figure Photos of
5. Photos of polymer
polymer A3338-treated
A3338-treated FFT-1
FFT-1 at
at under
under dosage,
dosage, optimal
optimal dosages,
dosages, and
and over
over dosage.
dosage.
Figure 66 shows
Figure shows dosage
dosage response
response curves
curves of
of different
different FFT
FFT treated
treated with
with polymer
polymer A3338,
A3338,
with dosage
with dosage curves
curves based
based on
on g/ton
g/tonsolids
solids(Equation
(Equation(1))
(1))corresponding
corresponding toto
thethe
netnet wa-
water
ter release (NWR) (Equation (2)) after 24 h drainage. The higher the NWR, the better
release (NWR) (Equation (2)) after 24 h drainage. The higher the NWR, the better the de-
the dewatering performance for the target application. Each flocculated FFT in Figure
watering performance for the target application. Each flocculated FFT in Figure 6 shows
6 shows the highest dewatering performance at optimal polymer dosage. At optimal
the highest dewatering performance at optimal polymer dosage. At optimal dosages, the
dosages, the A3338-treated FFT-2 and A3338-treated FFT-3 had comparable dewatering
A3338-treated FFT-2 and A3338-treated FFT-3 had comparable dewatering performance
performance according to the NWR (~18%). The A3338-treated FFT-2 (12% NWR), however,
according to the NWR (~18%). The A3338-treated FFT-2 (12% NWR), however, had
Minerals 2021, 11, x FOR PEER REVIEW had much higher dewatering performance than A3338-treated FFT-3 (6.5% NWR)
much
8 ofat
17the
higher dewatering performance than A3338-treated FFT-3 (6.5% NWR) at the fixed dosage
fixed dosage of 1800 g/ton solids. Therefore, acquiring full dosage response curves is
of 1800 g/ton solids. Therefore, acquiring full dosage response curves is highly recom-
highly recommended to evaluate high-density slurry dewatering performance.
mended to evaluate high-density slurry dewatering performance.
26% Solids based polymer dosage (g/ton) =
FFT-1
24%
FFT-2
/ % (1)
22%
FFT-3 %
20% FFT-4
NWR = 18%
1
16%
(2)
NWR (%)
14%
%
,
12% %
10%
8%
6%
4%
2%
0
600 800 1000 1200 1400 1600 1800 2000 2200 2400
Solids Based Dosage (g/tonne)
Figure
Figure 6. Dosage
6. Dosage curves
curves of 4ofdifferent
4 different
FFTFFT treated
treated with
with polymer
polymer A3338:
A3338: dosage
dosage curves
curves areareplotted
plotted by
NWR versus
by NWR versus solids based dosage. Each dot is the average value of duplicate
duplicate or
or more
more testing
testingresults.
results.
Solids based polymer dosage (g/ton) =
Volume of polymer solution (mL)× density of polymer solution (g/mL)× concentration of polymer solution (wt%) (1)
3.2. Effect of Mixing
Weight of FFT (g)× solids content (wt%)
Water releaseThe
fromefficacy
initial FFTof mixing reliesafter
Water release on24a−combination
hour draining − of factors,
Added including
polymer solution mixing energy
NWR = Water in initial = =1−
(speed and FFT
time), geometry of vessel Waterorinwithout
(with
(1 − solids weight% in flocs)
initial FFTbaffles), geometry of impeller, sol- (2)
ids content of slurry, etc. Baffles are highly recommended for effective mixing of high-
Water weight% in FFT
density slurries, but no limitations are placed on the type of impeller, energy, or solid
concentration as long as basic minimum flocculation requirements are met [15]. Floccula-
tion in a small-scale jar is often done poorly, with inconsistent mixing, and lack of repeat-
ability and reproducibility because the mixing process used to rely on operators’ visual
observations. The determination of flocculation via the operators’ observation heavily re-
lies on the operators’ experience, which required a large amount of training and practicing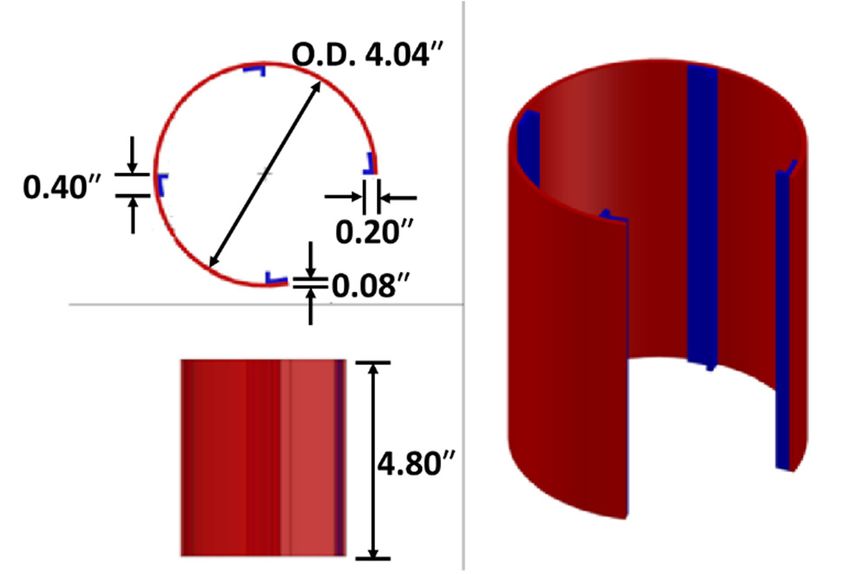
Minerals 2021, 11, 761                                                                                                           8 of 16

                               3.2. Effect of Mixing
                                       The efficacy of mixing relies on a combination of factors, including mixing energy
                                  (speed and time), geometry of vessel (with or without baffles), geometry of impeller,
                                  solids content of slurry, etc. Baffles are highly recommended for effective mixing of
                                  high-density slurries, but no limitations are placed on the type of impeller, energy, or
                                  solid concentration as long as basic minimum flocculation requirements are met [15].
                                  Flocculation in a small-scale jar is often done poorly, with inconsistent mixing, and lack
                                  of repeatability and reproducibility because the mixing process used to rely on operators’
                                  visual observations. The determination of flocculation via the operators’ observation
                                  heavily relies on the operators’ experience, which required a large amount of training
                                  and practicing on flocculations. The 6” metal beakers used in this study made the visual
                                  observation impossible due to the height of the vessel and safety concerns. Inappropriate
                                  mixing can lead to wrongly interpreted results, and time and cost wasted. This study used
                                  a torque-oriented mixing technique that allowed the operators to determine the flocculation
                                  stages in real-time by monitoring the torque progress and stopping the mixing process at
                                  well-defined cues to obtain good flocculation results. This mixing technique was based
                                  on the principles described in the Floccky Tester, manufactured by Koei Industry Co., Ltd.
                                  (Kakogawa, Hyogo, Japan) and adapted for oil sands in Suncor’s patent [16].
                                       The development of torque-oriented mixing procedures was based on the rheological
                                  changes that occurred during the flocculation process: premixing, polymer injection, poly-
                                  mer dispersion, under mixed, water release, and over sheared [13]. A visual representation
                                  of different flocculating stages corresponding to torque progress is presented in Figure 7.
                                  During the pre-mixing, the FFT was observed to be well homogenized, exhibiting stream-
                                  ing birefringence (white swirls). Thixotropic effects of the FFT samples were expected to
                                  be removed after pre-mixing [13]. As soon as the polymer was injected, the white swirls
                                  disappeared, and the small bitumen droplets were observed. As mixing continued, the
                                  polymer was dispersed in the FFT and flocs began to form, as evidenced by the appear-
                                  ance of structure within the image. The viscosity of the slurry increased, resulting in the
                                  increased force on the impeller. After flocs of maximum size were formed, water channels
                                  and air pocket formation became more apparent. When mixing was continued into the
Minerals 2021, 11, x FOR PEER REVIEW                                                                                    9 of 17
                                 ”over-sheared stage”, the flocs structure began to grow smaller, and the separated water
                                  became re-incorporated into the flocs.

                                Figure7.7.Visual
                               Figure     Visualdistinction
                                                 distinctioncorresponding
                                                             correspondingtotothe
                                                                               thestages
                                                                                   stagesofofflocculation
                                                                                               flocculationand
                                                                                                            andtorque
                                                                                                                 torqueprogress.
                                                                                                                        progress.The
                                                                                                                                  Thered
                                red represents
                               line line represents the torque
                                               the torque      progress
                                                           progress     during
                                                                    during       the flocculation.
                                                                           the flocculation.

                                     By
                                      Bymonitoring
                                        monitoringthethe impeller
                                                          impeller shaft
                                                                   shaft torque
                                                                          torque over
                                                                                  over time,
                                                                                        time, the
                                                                                               the various
                                                                                                   various stages
                                                                                                            stages of
                                                                                                                   of the
                                                                                                                       the floccula-
                                                                                                                           floccula-
                               tion
                                tion process
                                     processcan
                                              canbe
                                                  beprecisely
                                                     preciselymonitored
                                                               monitoredand  andidentified
                                                                                  identifiedininreal-time.
                                                                                                  real-time.The
                                                                                                             Theobservations
                                                                                                                 observationson   on
                               the flocculation stages were  well aligned   with the features   in the torque profile.
                                the flocculation stages were well aligned with the features in the torque profile. The  The  shapes
                               shapes of the torque profile were observed to be an indicator of polymer dosage (Figure
                               8a). Increasing polymer dosage tended to delay the appearance of the torque peak and
                               broadened the overall shape of the curve. This was most likely because a large amount of
                               polymer required more time to be fully dispersed within the high density slurry, and more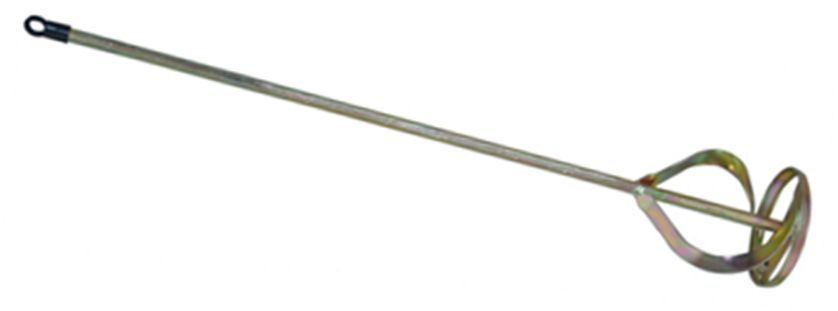
Figure 7. Visual distinction corresponding to the stages of flocculation and torque progress. The
red line represents the torque progress during the flocculation.
Minerals 2021, 11, 761 By monitoring the impeller shaft torque over time, the various stages of the floccula-
9 of 16
tion process can be precisely monitored and identified in real-time. The observations on
the flocculation stages were well aligned with the features in the torque profile. The
shapes of the torque profile were observed to be an indicator of polymer dosage (Figure
of the torque profile were observed to be an indicator of polymer dosage (Figure 8a). In-
8a). Increasing polymer dosage tended to delay the appearance of the torque peak and
creasing polymer dosage tended to delay the appearance of the torque peak and broadened
broadened the overall shape of the curve. This was most likely because a large amount of
the overall shape of the curve. This was most likely because a large amount of polymer
polymer required more time to be fully dispersed within the high density slurry, and more
required more time to be fully dispersed within the high density slurry, and more time
time to become fully flocculated with clay particles. Oversaturation of clay surfaces and
to become fully flocculated with clay particles. Oversaturation of clay surfaces and steric
steric repulsion could explain why the torque peak values began to decrease after a critical
repulsion could explain why the torque peak values began to decrease after a critical
polymer dosage.
polymer dosage.
Dosage
140 20%
Dosage of 1670 g/tonne
Dosage of 1837 g/tonne 18%
120 Dosage of 2004 g/tonne
Dosage of 2171 g/tonne 16%
Torque Reading (N⋅mm)
Dosage of 2339 g/tonne
100 14%
12%
NWR (%)
80
10%
60
8%
40 6%
4%
20
2%
0 0
0 100 200 300 400 500 1600 1700 1800 1900 2000 2100 2200 2300 2400
Mixing Time (Seconds) Solids Based Dosage (g/tonne)
(a) (b)
Figure
Figure 8. 8.(a)(a)Torque
Torqueprofiles
profilesof
ofthe
the flocculation
flocculation on
on A3338-treated
A3338-treatedFFT-4
FFT-4with
withdifferent
differentdosages; (b)(b)
dosages; thethe
NWR results
NWR corre-
results
sponding to the torque profiles of the flocculation.
corresponding to the torque profiles of the flocculation.
Besides
Besides thethe mixing
mixing energy
energy (speed
(speed andand time),
time), the geometry
the geometry of impeller
of impeller usedused for mix-
for mixing
ing isa also
is also a key factor
key factor affecting
affecting the flocculation
the flocculation efficacy.
efficacy. Twoof
Two types types of impeller,
impeller, flat mixerflatand
mixer
and mixer
auger auger (Figure
mixer (Figure
9), were9),studied
were studied
on the on the flocculation
flocculation of threeofFFT
three FFT samples
samples using using
a1L a
1 Lbeaker
glass glass beaker
with a with a baffle.
baffle. The augerThemixer
augertended
mixer tended
to provideto provide gentler and
gentler mixing mixing and re-
required
Minerals 2021, 11, x FOR PEER REVIEW quiredtime
a longer a longer time
to form to form
dense flocsdense
than flocs than
the flat the flat
mixer mixer
(Figure (Figure
10a). 10a).
The flocs The 17 flocs
10 tended
of tended
to form
to formbyabruptly
abruptly by auger
auger mixer mixermore
and were and easily
were over-sheared
more easily over-sheared
than using the than
flat using
mixer.the Theflat
mixer. The
geometry geometry
of impeller hasof different
impeller influences
has differentoninfluences
different FFTon different
samples. FFTFFT-3,samples.
which FFT-3,
has
higher sand content and low clay content, was more influenced
which has higher sand content and low clay content, was more influenced by the geome- by the geometry of mixers
during
try of mixers duringthethe
flocculation
flocculation(Figure
(Figure10b), probably
10b), probably because
because thethe
auger
augermixer
mixercould
could pick up the
sand from the bottom of the slurry and mix
pick up the sand from the bottom of the slurry and mix them in. them in.
(a) (b)
Figure 9. Geometries of mixing impellers:
Figure 9. Geometries of mixing(a) flat mixer;
impellers: (a) (b)
flatauger
mixer;mixer.
(b) auger mixer.
250 26% FFT-2 flat blade
Flat blade for FFT-4 flocculation 24% FFT-2 Auger mixer
Auger mixer for FFT-4 flocculation
22% FFT-3 flat blade
200 FFT-3 Auger mixer
Torque Reading (N⋅mm)
20%
FFT-4 flat blade
18%
FFT-4 Auger mixer
16%
150
NWR (%)
14%
12%
100 10%
8%
6%
50
4%
2%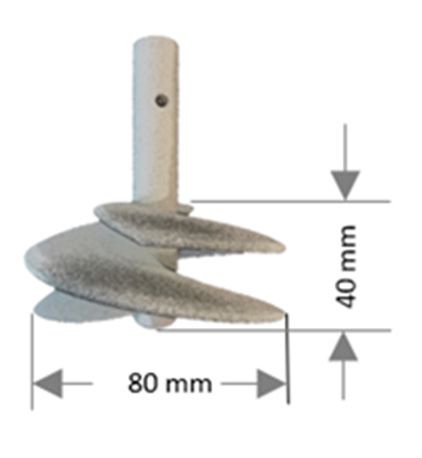
Minerals 2021, 11, 761 (a) (b) 10 of 16
Figure 9. Geometries of mixing impellers: (a) flat mixer; (b) auger mixer.
250 26% FFT-2 flat blade
Flat blade for FFT-4 flocculation 24% FFT-2 Auger mixer
Auger mixer for FFT-4 flocculation
22% FFT-3 flat blade
200 FFT-3 Auger mixer
Torque Reading (N⋅mm)
20%
FFT-4 flat blade
18%
FFT-4 Auger mixer
16%
150
NWR (%)
14%
12%
100 10%
8%
6%
50
4%
2%
0 0
0 100 200 300 400 500 800 1000 1200 1400 1600 1800 2000 2200 2400 2600
Mixing Time (Seconds) Solids Based Dosage (g/tonne)
(a) (b)
Figure
Figure TheThe
10. 10. influence
influence of geometry
of geometry of mixers
of mixers on on flocculation:
flocculation: (a)(a) torque
torque readings
readings byby flat
flat mixer and
mixer
andauger
augermixer
mixerduring
duringthe
theflocculation
flocculation of
of FFT-4
FFT-4 with
with polymer
polymer A3338; (b) dosage curves
curves ofof three
three FFT
FFTsamples
samplesflocculated
flocculatedbybyA3338
A3338using
using flat
flat mixer
mixer andand auger
auger mixer,
mixer, respectively.
respectively. Each
Each dotdot is the
is the average
average value of duplicate or more testing results
value of duplicate or more testing results in (b). in (b).
3.3.3.3. Effect
Effect of Dilution
of Dilution
Dewatering
Dewatering performance
performance of high
of high density
density slurry
slurry is usually
is usually sensitive
sensitive to solids
to solids concen-
concen-
tration. As shown in Figure 11a, the diluted FFT samples had much
tration. As shown in Figure 11a, the diluted FFT samples had much lower NWR than the lower NWR than
undiluted samples when the water added to dilute the FFT was considered for the calcu-the
the undiluted samples when the water added to dilute the FFT was considered for
calculation
lation of NWR of NWR (Equation
(Equation (3)). As a (3)). Asthe
result, a result, the dewatering
dewatering products ofproducts of diluted
diluted FFT samples FFT
had lower solids contents in flocs (Figure 11b). Therefore, FFT dilution might not be anot
samples had lower solids contents in flocs (Figure 11b). Therefore, FFT dilution might
goodbe practice
a good practice for tailings
for tailings treatment,treatment,
assuming assuming
the degreethe of
degree of dewatering
dewatering is the
is the main main
per-
performance indicator
formance indicator of interest. of interest.
Minerals 2021, 11, x FOR PEER REVIEW Water release from initial FFT 11 of 17
NWRfor
NWR fordiluted FFT= =
dilutedFFT Water in initial FFT 1 1−
=
(1−solids weight% in flocs)
% (3) (3)
Water weight% in diluted FFT − added water weight% for dilution
% %
30% 60%
FFT-3 FFT-3
FFT-4 FFT-4
Solids Content in Flocs (weight%)
25%
55% Diluted FFT-3
Diluted FFT-3
Diluted FFT-4 Diluted FFT-4
20%
50%
NWR (%)
15%
45%
10%
40%
5%
35%
0
-5% 30%
600 800 1000 1200 1400 1600 1800 2000 2200 2400 600 800 1000 1200 1400 1600 1800 2000 2200 2400 2600
Solids Based Dosage (g/tonne) Solids Based Dosage (g/tonne)
(a) (b)
Figure11.
Figure 11.Dosage
Dosagecurves
curvesofof2 2FFT
FFT and
and diluted
diluted FFT
FFT samples
samples treated
treated with
with polymer
polymer A3338:
A3338: (a) (a)
NWR NWR results
results corresponding
corresponding to
to the polymer dosage; (b) the solids content in flocs corresponding to the polymer dosage. Each dot is
the polymer dosage; (b) the solids content in flocs corresponding to the polymer dosage. Each dot is the averagethe average value
value of
of duplicate or triplicate testing results.
duplicate or triplicate testing results.
3.4. Effect of Clays
3.4. Effect of Clays
FFT-2, diluted FFT-3, and diluted FFT-4 had comparable solids content in the un-
FFT-2, diluted FFT-3, and diluted FFT-4 had comparable solids content in the untreated
treated FFT samples. However, they have different dewatering performances according
FFT samples. However, they have different dewatering performances according to NWR
to NWR when treated with polymer A3338 (Figure 12a). This is because the three FFT
when treated with polymer A3338 (Figure 12a). This is because the three FFT samples
samples had very different clay activities. Clays are a common component in most tailings
slurries, especially in FFT. The water-holding capacity of clays dominates the behavior of
FFT and hinders the dewatering performance due to the large surface area and reactivity
of clay particles, even when they are present in small proportions [17,18]. The MBI is a
simple index test that provides an indication of clay activity [11]. The dry clay content ofMinerals 2021, 11, 761 11 of 16
had very different clay activities. Clays are a common component in most tailings slurries,
especially in FFT. The water-holding capacity of clays dominates the behavior of FFT and
hinders the dewatering performance due to the large surface area and reactivity
Minerals 2021, 11, x FOR PEER REVIEW of clay
12 of 17
particles, even when they are present in small proportions [17,18]. The MBI is a simple
index test that provides an indication of clay activity [11]. The dry clay content of FFT is
determined by anA3338
to the polymer empirically derived
treatment, FFT-2conversion
produced the between MBI andmaterial
most dewatered the % clay mineral
(highest
as measured by X-ray
CWR of flocs) diffraction
compared (XRD)
to diluted FFT-3and
andparticle
diluted size
FFT-4distribution (PSD),
with a slightly published
higher re-
quiredSethi
by Amar optimal
on dosage (Figure
~70 Suncor 11b). samples (Equation (4)) [19,20]. As shown in Table 6,
tailings
FFT-2 has the highest MBI and
CWR = (Solids % clay
content and hence
weight% the lowestcontent
* Clay%)/(Water dewatering
weight%)performance
(5) of
NWR (Figure 12a), while diluted FFT-3 with the lowest MBI and % clay provided the
highest dewatering performance
Dry clay basedbydosage
presenting thebased
= Solids highest NWR.Clay
dosage/% (6)
% Clay = (MBI (mEq/100 g) + 0.04)/0.14 (4)
35% 0.7
FFT-2
30% 0.65
Diluted FFT-3
Diluted FFT-4
25% 0.6
CWR of flocs
20% 0.55
NWR (%)
15% 0.5
10% 0.45
5% 0.4
0 0.35
-5% 0.3
600 800 1000 1200 1400 1600 1800 2000 2200 600 800 1000 1200 1400 1600 1800 2000 2200 2400
Solid Based Dosage (g/tonne) Clay Based Dosage (g/tonne)
(a) (b)
25
24
23
Water Layer Index of Flocs
22
21
20
19
18
17
16
15
14
13
40 60 80 100 120 140 160 180
MBI Based Dosage
(c)
Figure Figure 12. Dosage
12. Dosage curves
curves of of FFT-2,diluted
FFT-2, diluted FFT-3,
FFT-3,and
anddiluted
dilutedFFT-4 treated
FFT-4 with polymer
treated A3338: (a)
with polymer NWR results
A3338: (a) NWRcorre-
results
sponding to solid based polymer dosage; (b) CWR of flocs corresponding to clay based dosage; (c) water layer index of
corresponding to solid based polymer dosage; (b) CWR of flocs corresponding to clay based dosage; (c)
flocs corresponding to MBI based dosage. Each dot is the average value of duplicate or more testing results.
water layer index of
flocs corresponding to MBI based dosage. Each dot is the average value of duplicate or more testing results.
Since the clay% is determined by an empirically derived conversion and is specific to
Table 6. The set
a single measured MBItaken
of samples value,from
calculated
a single%Suncor
clay and CWR results
tailings pond inoftheFFT-2, diluted
1970s, FFT-3,
it tends to and
leadFFT-4.
diluted to confusion as the “%″ clay calculated can be over 100% if more smectite is present
than was in the original sample set [22]. For this reason, the CWR derived from the em-
pirical value %claySolids
is a confusing MBI
FFT Contentmetric. The thickness of the
(Weight%) adsorbed water layer%on the
Clay
surfaces of clay minerals depends on the total amount of(mEq/100 water and g)the active surface area
of clays
FFT-2in a sample [23]. The24.68thickness of the adsorbed water 14.1 layer, named water101.0 layer
index inFFT-3
Diluted this study, can be calculated
23.25 using Equation (7), whereas 8.1 the total surface area 58.1of
clays is determined
Diluted FFT-4 by MBI (Equation
23.10 (8)) [22]. This is a conversion
10.7 based on the assump-
76.7
tion of a monolayer of methylene blue adsorbed on all available clay surfaces [11,24]. This
water layer index is closer to the direct measurement value and allows for an easier trans-
The relationship
lation between clays and water associated
of Derjaguin–Verwey–Landau–Overbeek’s with clays
(DLVO) theory in performance
into the the treated tailings
of
or the tailings deposit is a critical parameter in defining tailings management performance.Minerals 2021, 11, 761 12 of 16
Clay-to-water ratio (CWR), which is calculated from dry clay content (Equation (5)), has
been used by oil sands industries and tailings researchers to compare the properties of
treated tailings, despite the variations in solids between different tailings samples [18].
Higher CWR in the treated FFT presents that the higher clays are flocculated to the final
product and less water content is associated with the clays. It was also found that polymer
dosing on a dry solid basis often resulted in under dosage or overdosage, but it was found
to be consistent in terms of dry clay content (Equation (6)) [21]. Corresponding to the
polymer A3338 treatment, FFT-2 produced the most dewatered material (highest CWR of
flocs) compared to diluted FFT-3 and diluted FFT-4 with a slightly higher required optimal
dosage (Figure 11b).
CWR = (Solids content weight% ∗ Clay%)/(Water content weight%) (5)
Dry clay based dosage = Solids based dosage/% Clay (6)
Since the clay% is determined by an empirically derived conversion and is specific to
a single set of samples taken from a single Suncor tailings pond in the 1970s, it tends to lead
to confusion as the “%” clay calculated can be over 100% if more smectite is present than
was in the original sample set [22]. For this reason, the CWR derived from the empirical
value %clay is a confusing metric. The thickness of the adsorbed water layer on the surfaces
of clay minerals depends on the total amount of water and the active surface area of clays
in a sample [23]. The thickness of the adsorbed water layer, named water layer index in
this study, can be calculated using Equation (7), whereas the total surface area of clays is
determined by MBI (Equation (8)) [22]. This is a conversion based on the assumption of a
monolayer of methylene blue adsorbed on all available clay surfaces [11,24]. This water
layer index is closer to the direct measurement value and allows for an easier translation
of Derjaguin–Verwey–Landau–Overbeek’s (DLVO) theory into the performance of the
system. Therefore, the water layer index is preferred for future academic publications, and
should be used to report the tailings management performance for a given technique. The
higher the water layer index, the lower the CWR in a sample and the lower the tailings
management performance, as shown in Figure 12c. For the same reason, the MBI based
dosage (Equation (9)) is useful when comparing between feeds in controlled settings, even
though a solid based dose is more relevant in the field.
Thickness of water layer (nm) = (Water content (g/g) × 109 )/(Total surface area (m2 /g) × Density of water (106 g/m3 )) (7)
Total surface area (m2 /g) = MBI × SAmb × 0.06022 m2 /g (8)
where SAmb is the surface area of a methylene blue molecule (1.3 nm2 /molecule), and
0.06022 m2 /g is Avogadro’s constant.
MBI based dosage (g/10 equivalent) = Solids based dosage/MBI (9)
3.5. Effect of Water Chemistry
Water chemistry of high density slurry is an often underestimated factor affecting
the dewatering performance. The oil sands tailings usually have a pH 7.5–9 due to bitu-
men extraction process requirements. Alkaline conditions cause the ionization of ionic
polyacrylamide flocculants and increase the mutual repulsion between negatively charged
groups, resulting in extended polymer chains. The conformation of extended chains favors
bridging flocculation. On the other hand, the pH around 7.5–9 also allows the SAR to affect
the clays behavior [25]. The SAR value was used to determine whether the water chemistry
is prone to generating dispersive slurries. Slurries with high SAR values tend to be alkali
and undergo colloidally dispersive inhibiting flocculation, while slurries exhibiting low
SAR values tend to be naturally coagulated and settling [25]. In this study, the FFT-1,
which has a higher SAR, resulted in a lower dewatering performance than FFT-4 with the
comparable MBI and pH in water chemistry (Table 7).Minerals 2021, 11, 761 13 of 16
Table 7. The comparison of SAR, MBI, pH, and NWR between FFT-1 and FFT-4.
MBI NWR
FFT SAR pH
(mEq/100 g) (%)
FFT-1 37.4 10.4 7.80 9.9
FFT-4 4.3 10.7 7.92 13.7
3.6. Other Effects
Many other factors could influence the flocculation efficiency and repeatability, such
as polymer injection location and injection rate, concentration of polymer solution, the
location and height of mixer, the geometry of baffle, etc. For example, choosing the
optimal polymer injection rate is critical for a polymer solution with a certain viscosity
and concentration. A high polymer injection rate could lead to local overdosing, reducing
flocculant efficiency. In Figure 13, FFT-1 was flocculated by the polymer NRG1000 at two
different solution injection rates—84 mL/s and 33 mL/s. The flocs obtained from the
higher injection rate appeared visibly muddier, indicating worse flocculation performance
than the lower injection rate (Figure 13). One the other hand, a low polymer injection rate
would result in local over-shearing, reducing flocculation efficiency as well. According to
Bourne’s summation, flocculation is a process dominated by mesomixing [8]. The condition
that provides high dewatering performance for one polymer and high density slurry might
not work for another polymer and high density slurry. It is highly recommended to choose
Minerals 2021, 11,the most
x FOR suitable
PEER REVIEWand repeatable flocculation parameters according to the expectation of
the experiment.
(a) (b)
Figure 13.Figure
Flocculated FFT-1 by FFT-1
13. Flocculated polymer NRG1000
by polymer at the same
NRG1000 polymer
at the dosage:dosage:
same polymer (a) polymer solution
(a) polymer injection rate at
solution
mL/s; (b) polymer solution injection rate at 33 mL/s.
injection rate at 84 mL/s; (b) polymer solution injection rate at 33 mL/s.
3.7. Example
3.7. Example of Polymer of Polymer
Evaluation Evaluation
on FFT Treatmenton FFT Treatment
A robust
A robust flocculation flocculation
method is the keymethod is the various
to evaluate key to evaluate various
flocculants flocculants for
for tailings
treatment. The improved
treatment.testing repeatability
The improved andrepeatability
testing reproducibilityand by the torque-oriented
reproducibility by the torque-o
mixing allows the polymer
mixing evaluation
allows and screening
the polymer evaluationtoandbe more credible,
screening to beand
more improves
credible, and im
the ability to confidently
the abilitydiscern performance
to confidently discerndifferences
performance between different
differences polymers.
between different po
Figure 14 shows Figure
the comparison of dewatering performance of polymer A3338 and
14 shows the comparison of dewatering performance of polymer A3338 an polymer
NRG1000 on themer FFT-1. Repeating
NRG1000 theFFT-1.
on the tests, Repeating
choosing the theaverage values and
tests, choosing using thevalues an
the average
statistical analysis
thetostatistical
determineanalysis
the optimal dosage orthe
to determine optimal
optimaldosage
dosagewindow were critical
or optimal dosage windo
to determine dewatering
critical toperformance, because a single
determine dewatering testing result
performance, becausewould lead to
a single wrong
testing result wou
decisions on thetopolymer
wrong evaluation.
decisions onIfthethepolymer
best flocculation results
evaluation. If theof best
the repeated testsresults of
flocculation
were chosen for peated
evaluation
testsaswere
shown in Figure
chosen 14b, the optimal
for evaluation dosage
as shown of polymer
in Figure 14b, A3338
the optimal do
was 123 g of MBI based dosage, and dewatering performance on FFT-1 was
polymer A3338 was 123 g of MBI based dosage, and dewatering performance worse than o
was worse than polymer NRG1000. The average values with statistical analysis in
14a, however, shows that both polymers had a broad optimal dosage window
dewatering performances had no significantly statistical difference. It is recomme
use multiple KPIs including NWR or water layer index of flocs, release water qualiFigure 14 shows the comparison of dewatering performance of polymer A3338 and poly-
mer NRG1000 on the FFT-1. Repeating the tests, choosing the average values and using
the statistical analysis to determine the optimal dosage or optimal dosage window were
critical to determine dewatering performance, because a single testing result would lead
Minerals 2021, 11, 761 to wrong decisions on the polymer evaluation. If the best flocculation results of 14 theof re-
16
peated tests were chosen for evaluation as shown in Figure 14b, the optimal dosage of
polymer A3338 was 123 g of MBI based dosage, and dewatering performance on FFT-1
was worse than polymer NRG1000. The average values with statistical analysis in Figure
polymer NRG1000.
14a, however, showsThe average
that values with
both polymers hadstatistical analysis dosage
a broad optimal in Figure 14a, however,
window and the
shows that both polymers had a broad optimal dosage window and the
dewatering performances had no significantly statistical difference. It is recommendeddewatering to
performances had no
use multiple KPIs significantly
including NWRstatistical difference.
or water layer index It
ofisflocs,
recommended to use
release water multiple
quality (clar-
KPIs including NWR or water layer index of flocs, release water quality (clarity and color),
ity and color), dosage, water chemistry of release water, etc. to build technical and eco-
dosage, water chemistry of release water, etc. to build technical and economic analysis
nomic analysis criteria which meet the researchers’ needs for polymer evaluation. If the
criteria which meet the researchers’ needs for polymer evaluation. If the water quality of
water quality of the release water from the treated FFT is a critical factor to the researcher,
the release water from the treated FFT is a critical factor to the researcher, polymer A3338
polymer A3338 has better dewatering performance than polymer NRG1000 due to the
has better dewatering performance than polymer NRG1000 due to the higher clarity and
higher clarity and lower color scales of the release water (Figure 14c,d).
lower color scales of the release water (Figure 14c,d).
34 34
32 A3338 32 A3338
NRG1000 NRG1000
30 30
Water Layer Index of Flocs
Water Layer Index of Flocs
28 28
26 26
24 24
22 22
20
20
18
18
16
16
14
14
90 100 110 120 130 140 150 160 170
90 100 110 120 130 140 150 160 170
MBI Based Dosage
Minerals 2021, 11, x FOR PEER REVIEW
MBI Based Dosage 15 of 17
(a) (b)
60 5
A3338
50 NRG1000
4
Color of Release Water
40
3
Clarity
30
2
20
1
10
0 A3338
NRG1000
0
-1
90 100 110 120 130 140 150 160 90 100 110 120 130 140 150 160
MBI Based Dosage MBI Based Dosage
(c) (d)
Figure14.
Figure 14.The
Thecomparison
comparisonofoftwo
twopolymers
polymersA3338
A3338andandNRG1000
NRG1000inincase
caseofofFFT-1
FFT-1dewatering:
dewatering:(a)
(a)the
theaverage
averagedewatering
dewatering
results with 95% confident index error bars; (b) the best dewatering results; (c) the average clarity numbers of the release
results with 95% confident index error bars; (b) the best dewatering results; (c) the average clarity numbers of the release
water with 95% confident index error bars; (d) the average color scales of the release water with 95% confident index error
water with 95% confident index error bars; (d) the average color scales of the release water with 95% confident index
bars.
error bars.
4.4.Conclusions
Conclusions
Flocculation
Flocculationofofhigh
highdensity slurry
density is is
slurry notnot
a simple process,
a simple andand
process, thethe
dewatering perfor-
dewatering per-
mance is affected by many critical factors including mixing conditions, feed characteristics,
formance is affected by many critical factors including mixing conditions, feed character-
polymer types, and dosages. When evaluating new polymers or determining if an old one
istics, polymer types, and dosages. When evaluating new polymers or determining if an
is appropriate for a new application, it is therefore important to consider all of the factors
old one is appropriate for a new application, it is therefore important to consider all of the
in testing.
factors in testing.
The dewatering performance of the polymer A3338 treated FFT shows that the NWR
The dewatering performance of the polymer A3338 treated FFT shows that the NWR
results can be reduced from 18% at the optimal dosage to 7% at the underdosage and
results can be reduced from 18% at the optimal dosage to 7% at the underdosage and
overdosage. Single or fixed dosage comparison may lead to false results and decisions,
overdosage. Single or fixed dosage comparison may lead to false results and decisions,
because different types of FFT have different dosage responses to the same flocculant.
because different types of FFT have different dosage responses to the same flocculant.
Acquiring full dosage response curves are necessary to screen flocculants and evaluate
the dewatering performance of high density slurries.
Mixing conditions are application specific, and hence understanding the degree of
shear expected at different parts of the process can be very helpful to develop a bench
scale test plan. If the specific mixing conditions are not well understood, it is important toYou can also read