Wildfire, Smoke, and Outdoor Recreation in the Western United States - Jacob Gellman, Margaret Walls, and Matthew J. Wibbenmeyer - Working Paper ...
←
→
Page content transcription
If your browser does not render page correctly, please read the page content below
Wildfire, Smoke, and Outdoor
Recreation in the Western
United States
Jacob Gellman, Margaret Walls, and Matthew J. Wibbenmeyer

Working Paper 21-22
August 2021
About the Authors
                      Jacob Gellman is a PhD student in Economics and Environmental Science at the Bren
                      School of Environmental Science and Management at University of California, Santa
                      Barbara. His research focuses on the economics of land use, wildfire, and housing.
                      Current projects include the impact of wildfire on outdoor recreation, the effects of
                      wildfire insurance on housing development, and estimation of welfare change from
                      affordable housing policy. Gellman received a BA in Economics from the University
                      of Puget Sound in 2013. Subsequently, he worked as a research assistant focusing on
                      non-market valuation of ecosystem services. He also worked as an energy economics
                      consultant.

                      Margaret Walls is a senior fellow at Resources for the Future. Walls’s current research
                      focuses on issues related to resilience and adaptation to extreme events, ecosystem
                      services, and conservation, parks and public lands. Her work on resilience assesses
                      the factors that affect household location decisions in coastal areas, how individuals
                      perceive flood risks, and how risk perceptions affect adaptation decisions. She has
                      estimated the value of natural lands—such as wetlands—in providing protection from
                      hurricanes and flooding, and is assessing the extent to which hurricanes affect U.S.
                      migration patterns.

                      Matthew J. Wibbenmeyer is a fellow at Resources for the Future. Wibbenmeyer’s
                      research seeks to understand climate impacts and climate mitigation policies related
                      to the forest and land sectors, with a special focus on wildfire. His work frequently
                      makes use of spatial data and interdisciplinary approaches and emphasizes behavioral
                      factors and distributional implications of policy and management choices. Current
                      wildfire-related research studies agency decision-making (including over wildfire risk
                      reduction projects and wildfire suppression strategies) and effects across the income
                      distribution, how wildfire risk is distributed across households of different income
                      levels, and consequences of wildfire and wildfire smoke for the outdoor recreation
                      sector in the western US.

                      Acknowledgements
                      We are grateful for comments from Kevin Ankney, Andrew Plantinga, Olivier
                      Deschênes, Jose Sanchez, Molly Robertson, and participants at the Association of
                      Environmental and Resource Economists 2020 Summer Conference, the American
                      Economic Association 2021 Annual Meeting, and seminar participants at University
                      of Nevada-Reno. This research was supported by a United States Department of
                      Agriculture National Institute of Food and Agriculture Agriculture and Food Research
                      Initiative grant (award number 2020-67023-33258).

Resources for the Future                                                                                        i
About RFF
Resources for the Future (RFF) is an independent, nonprofit research institution in
Washington, DC. Its mission is to improve environmental, energy, and natural resource
decisions through impartial economic research and policy engagement. RFF is
committed to being the most widely trusted source of research insights and policy
solutions leading to a healthy environment and a thriving economy.
Working papers are research materials circulated by their authors for purposes of
information and discussion. They have not necessarily undergone formal peer review.
The views expressed here are those of the individual authors and may differ from those
of other RFF experts, its officers, or its directors.tors.
Sharing Our Work
Our work is available for sharing and adaptation under an Attribution-
NonCommercial-NoDerivatives 4.0 International (CC BY-NC-ND 4.0) license. You
can copy and redistribute our material in any medium or format; you must give
appropriate credit, provide a link to the license, and indicate if changes were made,
and you may not apply additional restrictions. You may do so in any reasonable
manner, but not in any way that suggests the licensor endorses you or your use.
You may not use the material for commercial purposes. If you remix, transform, or
build upon the material, you may not distribute the modified material. For more
information, visit https://creativecommons.org/licenses/by-nc-nd/4.0/.
Wildfire, Smoke, and Outdoor Recreation in the Western United States iiAbstract
Wildfire activity is increasing in the western United States at a time when outdoor
recreation is growing in popularity. Because peak outdoor recreation and wildfire
seasons overlap, fires can disrupt recreation and expose people to poor air quality. We
link daily data on campground use at 1,069 public campgrounds across the western
United States over a ten-year period to daily satellite data on wildfire and smoke. We
use this data set to (1) tabulate the number of campers affected by wildfire and smoke
at campgrounds across the western US, and (2) provide estimates of how campground
use responds to wildfire and smoke impacts, including the first causal estimates of the
impacts of wildfire smoke on recreation behavior. We find that, on average, more than
120,000 campground visitor-days per year are close to an actively burning fire and
nearly 400,000 are impacted by adverse smoke conditions, defined as the presence of
smoke combined with high ground-level air quality monitor readings. In some regions
more than ten percent of camper-days occur when air quality is poor due to wildfire
smoke. Combining the results with monthly national park visitation data at the 30 parks
in our sample, we estimate that fire and smoke affect 400,000 and 1 million visitor-days
per year, respectively. Using fixed effects panel regressions at the campground level, we
estimate declines in campground use in response to fire and smoke. The magnitude of
the smoke effect is small, however, suggesting that smoke fails to deter most visitors to
public lands. Back-of-the envelope welfare calculations suggest that most of the smoke-
related welfare losses that campers experience are due to health impacts from trips
taken rather than lost utility from cancelled trips.
Keywords: Outdoor recreation, wildfire, smoke, air pollution, public lands, national parks.
JEL Classification: Q51, Q53, Q54
Resources for the Future iiiContents
1. Introduction 1
2. Materials and Methods 4
2.1. Recreation Data 4
2.2. Active Fire and Smoke Data 5
2.3. Quantification of Total Wildfire and Smoke Impacts on Outdoor Recreation 6
2.4. Analysis of Behavioral Responses to Fire and Smoke 7
3. Results 8
3.1. Campgrounds and Campground Visitor-Days Affected by Wildfire and Smoke 8
3.2. National Park Visitor-Days Affected by Wildfire and Smoke 9
3.3. Changes in Recreation Site Use Due to Wildfire and Smoke 10
4. Discussion 13
References 15
Figures and Tables 18
Appendices 24
Wildfire, Smoke, and Outdoor Recreation in the Western United States iv1. Introduction
Outdoor recreation on public lands in the United States has never been more popular.
National parks saw 327.5 million visitors in 2019, and the six highest-visitation years
on record were 2014–2019 (NPS 2019a). Visits to Bureau of Land Management (BLM)
sites, such as national monuments and national conservation areas, rose by 20 percent
over the past ten years (BLM 2019). In the western United States, where more than half
the land is owned by the federal government and many of the most famous national
parks are located (including the Grand Canyon, Glacier, Yellowstone, and Yosemite),
outdoor recreation is a significant economic driver. In Montana, for example, outdoor
recreation accounts for 5 percent of state GDP, compared to 2.2 percent nationally
(BEA 2019).
As outdoor recreation has increased in popularity, wildfires in the American West have
become more frequent and more severe (Abatzoglou and Williams 2016; Westerling
2016; Crockett and Westerling 2016). Wildfires pose a problem for outdoor recreation
for three reasons. First, they frequently burn on public lands used for recreation, in
some cases impacting visitor experiences for years into the future (Englin et al. 2001;
Hesseln et al. 2003; Hilger and Englin 2009). In 2018, 63 percent of the acreage burned
in wildfires in the western United States was on federal lands (Hoover and Hanson
2019). Second, fire season coincides with outdoor recreation season. Approximately
48.5 percent of visits to national parks in 2018 occurred between June and September,
which overlaps with peak wildfire season in many parts of the western US (NPS 2019b).
Third, outdoor recreationists spend large amounts of time outside. Recent estimates
indicate that up to half of PM2.5 exposure in some parts of the western United States
is attributable to wildfire smoke (Burke et al. 2021). Exposure to unhealthy air quality
from wildfire smoke can reduce enjoyment of the recreation activity, lead to respiratory
health problems, and offset the health benefits of physical activity (Korrick et al. 1998).
Much of the literature on wildfire and outdoor recreation has focused on the impacts
that a fire-damaged landscape has on recreation in the years after a fire. Using a
combination of recreation site visit data and responses to survey questions about
visitation under hypothetical fire conditions, studies have examined how various
fire characteristics, such as size, severity, and age, affect the frequency of trips and
the value of outdoor recreation (Englin et al. 2001; Hesseln et al. 2003; Loomis et al.
2001; Hesseln et al. 2004; Starbuck et al. 2006; Boxall and Englin 2008; Sánchez et al.
2016). These studies typically focus on relatively small geographic areas and a limited
number of fires, or sometimes a single fire event. Two studies have used multiple years
of national park visitation data to analyze how fire affected visitation in Yellowstone
National Park (Duffield et al. 2013) and five national parks in Utah (Kim and Jakus
2019). Some studies have used the effects of fire as a way to assess the value of forest
characteristics, including forest age (Englin et al. 2006).
The effect of wildfire smoke on recreation has received decidedly less attention. Two
studies collected survey data to analyze how outdoor activity, including exercise and
recreation, changed in response to a wildfire event (Richardson et al. 2012; Fowler et
al. 2019), but these studies were focused in urban areas. We are aware of only one
Wildfire, Smoke, and Outdoor Recreation in the Western United States 1study focused on evaluating the impact of wildfire smoke on outdoor recreation away
from home, a recent paper that used a case study and survey approach to evaluate
changes to public lands users’ recreation experiences and trip planning (White et al.
2020). A few studies have examined effects of air quality on recreation. For example,
a 2018 study using monthly visitation data found that air pollution is about as severe
in some national parks as in US urban areas, and that it negatively affects visitation
(Keiser et al. 2018). In a study of the effect of smog alerts on outdoor recreation in
southern California, Graff-Zivin and Neidell (2011) found that residents make short-run
adjustments to shift outdoor activities from days with smog alerts to days with better
air quality. However, the specific effects of wildfire smoke on outdoor recreation are
largely unexplored, and several studies show that exposure to particulate matter (PM)
from smoke has different effects on health outcomes and behavior than exposure to
PM from typical urban sources (Kochi et al. 2010).
We combine daily observational data on outdoor recreation over a ten-year period
across the western continental United States, daily satellite data on wildfire burn
areas and smoke plumes, and ground-level air quality monitoring data. We assess the
impact of wildfire and smoke on outdoor recreation across a large region and multiple
fire events. Our recreation data are drawn from the Recreation.gov website, which
is used to make reservations for a variety of activities at more than 3,700 federally
managed facilities across the United States. We focus on camping, one of the most
popular nature-based recreation activities and the source of most reservations in the
Recreation.gov system. Camping has relatively high smoke exposure, given the many
hours campers spend outdoors. Our data include camping reservations and walk-in
registrations at more than 1,000 individual campgrounds in the western United States
on each day of the year from 2008 through 2017 and information on reservation
cancellations and early check-outs.
We address two main research questions. First, we ask how many people are directly
affected by wildfires and wildfire smoke each year while camping on public lands in the
western United States. Using these estimates, we calculate the share of total camper-
days affected by wildfires and smoke and the spatial variation of the impacts across
the region. The daily data from the Recreation.gov system allows us to calculate the
first comprehensive estimates of fire and smoke impacts on outdoor recreationists.
Compared to other data sources, which are often either survey-based and limited
geographically or aggregate monthly or annual data, Recreation.gov provides daily
counts of visitors at specific latitude-longitude locations (the locations of their
reserved campgrounds). Not only does this give us a better understanding of the
number of individuals in a recreation area at a given time, but once merged with daily
data on fire and smoke, it allows us to estimate smoke and fire impacts at a much finer
spatial resolution than in previous research. In addition to quantifying the number
of campers affected, we combine our data with broader monthly visitation data for
the national parks in our sample to estimate the total number of all visitors (not just
overnight campers) at national parks affected by fire and smoke.
Second, we ask how fire and smoke alters campground use. Specifically, using panel
fixed effects regression models, we analyze the following outcomes at the individual
campground level: (i) campground occupancy rates, (ii) trip cancellation rates prior to
Resources for the Future 2arrival, and (iii) trip cancellation rates after arrival. The estimates from these models
provide evidence on the extent to which people alter their recreation plans to avoid fire
and smoke, and the first causal estimates thus far on the effects of wildfire smoke on
outdoor recreation behavior. Our daily campground use data are particularly valuable
for estimating impacts of wildfire smoke on visitation since wildfire smoke may be
transient and short-lived.
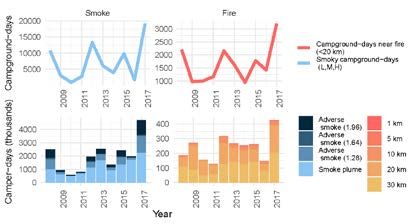
Our analysis reveals that 124,000 campground visitor-days per year, on average, were
within 20 kilometers (km) of an active wildfire over our ten-year sample period and
nearly 400,000 campground visitor-days per year were affected by air pollution from
wildfire smoke. Seventy percent of the campground visitor-days affected by fire and 42
percent affected by adverse smoke conditions were in California, highlighting both the
prevalence of wildfire and popularity of outdoor recreation on public lands in the state.
The northern states of Montana, Idaho, Washington, and Oregon accounted for only 16
percent of the campground visitor-days affected by fire but 38 percent of the visitor-
days affected by smoke, underscoring the tendency of smoke to travel long distances
with prevailing winds from south to northeast. Moreover, because of the shorter
outdoor recreation season in the north, these four states had the greatest share of
campground visitor-days affected by smoke, seven percent over the ten-year period.
A total of 392,000 national park visitor-days per year were near a wildfire, and 1 million
park visitor-days per year were affected by air pollution from wildfire smoke.
Finally, our regression results show statistically significant impacts on campground
occupancy rates and cancellation rates from fire and smoke. When a fire is within 20
km of a campground, the occupancy rate drops 6.4 percentage points, on average,
and cancellation rates before arrival more than double. The magnitudes of the smoke
impacts are comparatively small, however. The occupancy rate falls by only 1.3
percentage points under adverse smoke conditions. We attribute this small effect, in
part, to the challenge of finding an open campsite at many national parks in the peak
summer months (Walls et al. 2018). Cancelling a trip because of smoky conditions may
mean foregoing a visit for the entire season, which many travelers may be unwilling
to do. Indeed, we estimate separate regressions by campground popularity quartiles
and find that smoke has the smallest effect on occupancy rates in the most popular
campgrounds. In a back-of-the envelope welfare calculation, combining our results
with valuation estimates in the literature, we find that wildfire smoke causes welfare
losses from smoke-related illnesses and avoided camping trips of approximately $4.8
million per year. These losses are an underestimate of the full welfare loss, as they do
not include the additional disutility of camping during smoky conditions. Nonetheless,
they provide some sense of the welfare losses to outdoor recreationists from wildfire
smoke—losses that are likely to rise as wildfire activity continues to escalate in the
western United States.
Wildfire, Smoke, and Outdoor Recreation in the Western United States 32. Materials and Methods
2.1. Recreation Data
We assembled a panel dataset comprising daily campsite reservations, proximity
to active wildfires, and air-pollution-related smoke conditions at federally managed
campgrounds. We source the camping data from Recreation.gov. Though not all
federally managed campgrounds are reservable, and some sites are managed through
alternative systems, Recreation.gov is the primary online system through which visitors
can make and cancel reservations at federal campgrounds. We obtained historical
data for 2008–2017 from the website managers. The complete database includes 90
million transactions by 7 million unique users of federal outdoor recreation facilities
for each day of the year between 2008 and 2017. We focus on campground facilities
in the 11 western continental US states, reducing the dataset to approximately 25
million transactions by 3.1 million unique users at 1,069 campgrounds managed by
the US Forest Service, BLM, the US Army Corps of Engineers, National Park Service
(NPS), and Bureau of Reclamation. Campgrounds in our dataset belong to 269 distinct
“recreation areas,” which include national parks, lakes or reservoirs managed by the
Army Corps of Engineers, ranger districts in national forests, and resource areas or
districts managed by BLM.
Our dataset includes all transactions online, by phone, and on-site (such as walk-in
reservations or early check-outs). For the western campgrounds in our analysis, 81
percent of transactions were made online, 10 percent over the phone, and 9 percent
on-site. The dataset includes the date of each transaction, the scheduled arrival and
departure dates, payments, dates of cancellation, group size, zip code of origin, and
campground information. For most campgrounds, we do not observe whether the
individual checked in to the campground on the scheduled date, so we cannot identify
“no-shows” at all locations. However, campers have a financial incentive to cancel
when plans change, mitigating this concern. They usually receive a full refund less a
$10 service fee if they cancel more than one day prior to the scheduled arrival date
and a full refund less a $10 service fee plus the cost of one night’s stay when they
cancel within one day of the scheduled arrival date. We aggregate reservation records
from the individual campsites to the campground level to construct a daily panel of
use measures for each campground in our dataset. Our measures of interest are the
number of occupants, occupancy rate (i.e., the share of sites in use), and pre- and
post-arrival cancellation rates (the number of reservations cancelled prior to arrival
and during the stay, respectively, as a share of all reservations). Appendix A provides
more information about the construction of the dataset from the raw Recreation.gov
database.
For every campground we determine the number of daily occupants based on the
number of uncancelled reservations. We measure the occupancy rate on date t as the
proportion of campground sites that are reserved (and for which reservations have
not been cancelled) on date t. Formally, the occupancy rate variable for campground i
on date t is (occupied campsitesit)/(total number of campsitesit). The occupancy rate
Resources for the Future 4provides a measure of overall site use, which we expect will decline during nearby
wildfire activity or periods of heavy smoke, due to both decreases in new reservations
and increases in cancelled reservations. Appendix A describes how we calculate the
total number of campsites (the denominator in the occupancy rate variable) for each
campground on each day.
We also consider two measures of cancellations. The prearrival cancellation rate is
the number of cancelled reservations as a share of total reservations for arrival date t.
We consider only the cancellations that occurred within one week of arrival, because
these trips are most likely to be influenced by current and anticipated fire and smoke
conditions.
Visitors may also decide to end their visit early in response to fire or smoke. Therefore,
for each campground, we also measure the postarrival cancellation rate as the
number of cancellations made on date t for visits that began prior to date t and had a
scheduled departure date after day t, calculated as a share of the number of occupants
at the campground on day t.
In a supplementary analysis, we estimate the total number of national park visitors
(campers and noncampers) exposed to fire and smoke. For this analysis, we use data
from NPS Visitor Use Statistics, which provide monthly visitation data for individual
national parks (NPS 2019a). We combine these data with our estimates of calculated
exposure of campground users to obtain an estimate of total numbers of national park
visitors affected by fire and smoke.
2.2. Active Fire and Smoke Data
Locations of active wildfires come from MODIS fire detection data (Giglio et al. 2016).
MODIS is an instrument aboard NASA’s Terra and Aqua satellites capable of detecting
fire activity. MODIS fire detection data provide centroids of 1 km observations with
a temporal resolution of 1–2 days for all observed fire activity, including agricultural
burning and prescribed fires. We restrict fire detections to those associated with
wildfires by selecting those near in space (within 1 km) to and occurring during the
same time as wildfires in the USGS Monitoring Trends in Burn Severity (MTBS)
dataset, which maps perimeters of wildfires larger than 1,000 acres in the western
United States (Eidenshink et al. 2007). An advantage to using this modified MODIS
dataset, rather than simply the final fire perimeters from MTBS, is that MODIS data
more reliably identify the period during which fires are actively burning. We measured
the distance between each campground and the nearest active wildfire for each date
in the study period and used that distance to identify campgrounds that were within
20 km of an actively burning fire on each date. In Appendix B, we show results for
alternative distances.
Days with adverse smoke conditions are based on data from the NOAA HMS and
the US Environmental Protection Agency (EPA). Since 2005, NOAA analysts have
used imagery from GOES satellites to map smoke plume boundaries. Usually twice a
day—once in the morning and once in the evening—analysts use 2–4 hour satellite
Wildfire, Smoke, and Outdoor Recreation in the Western United States 5imagery animations to trace polygons delineating the boundary of each smoke plume
they observe. They identify each plume as low, medium, or heavy smoke. The NOAA
HMS smoke product has been used recently in studies of smoke’s contribution to
air pollution and air pollution’s effect on crime (Preisler et al. 2015; Burkhardt et al.
2019). A disadvantage of the NOAA HMS smoke data is that because plumes are
identified based on aerial imagery, and smoke may be high in the air column, they do
not necessarily identify locations with poor on-the-ground air quality. We combine the
smoke data with data provided by Burkhardt et al. (2019), who interpolate EPA daily
surface-level PM2.5 monitoring data to a 15 km grid using kriging, a geostatistical spatial
interpolation method that has been shown to be effective for air quality data over
large areas (e.g., Jerrett et al. 2005). The data and interpolation method are described
in detail in Burkhardt et al. (2019). Following their approach, we calculate seasonal
means and standard deviations of air quality on days that each cell is not covered by
a smoke plume. We then identify air-quality-impacted smoke days as days on which a
campground is covered by a smoke plume and PM2.5 is at least 1.64 standard deviations
above the within-cell seasonal mean for nonsmoky days, which represents the 95th
percentile of a normal distribution. This method eliminates many of the areas covered
by smoke plumes because they fall below the 95th percentile for PM2.5. In Appendix B,
we show results for an alternative, less conservative, assumption using only the smoke
plume data without the adjustment from the ground-level monitors.
2.3. Quantification of Total Wildfire and Smoke
Impacts on Outdoor Recreation
The first part of our analysis involves a spatial merge of the campgrounds in our
dataset with the wildfire data and combined smoke plume-PM2.5 monitor data to
calculate the total number of campground-days near wildfires and affected by adverse
smoke conditions over the 2008–2017 sample period. Using the total number of days
the campground is open (as described in Appendix A), we then calculate the share of
campground-days affected by fire and smoke in each year.
Using the reservation data from Recreation.gov, we tally the sum of campers at each
campground on each day in our sample. An individual camper that visits a park for one
day is tallied as a single camper-day. We merge the daily camper-days panel with the
wildfire, smoke, and PM2.5 data at the campground level and estimate the total number,
and share, of camper-days affected by fire and smoke over the ten-year sample period.
Finally, we estimate the total number of national park visitor-days affected by fire
and smoke by multiplying monthly visitor-days from the NPS Visitor Use Statistics
database for each of the 30 national parks in our sample by the ratio of monthly
camper-days affected to total monthly camper-days at each park.
Resources for the Future 62.4. Analysis of Behavioral Responses to Fire and
Smoke
We estimate the effects of wildfire and wildfire smoke on camping behavior at
campground i on date t using the following regression specification:
yit = βf fireit + βs smokeit + γ precipit + ϕ tempit + Ψi + δt + λk(i),t + εit (1)
where yit = {occupancy rate, prearrival cancellation rate, postarrival cancellation
rate} at campground i on date t; fireit is an indicator equal to 1 if a fire is within 20
km of campground i on date t; smokeit is an indicator equal to 1 if campground i is
affected by adverse smoke conditions on date t; precipit is the amount of rainfall, in
millimeters, at the campground on date t; tempit is the normalized difference between
the campground’s temperature on date t and its ten-year average on that week of year,
where the normalization is based on the standard deviation of temperatures for that
week; Ψi is a set of campground fixed effects; δt includes week-of-year and day-of-
week fixed effects and indicators for federal holidays; and λk(i),t includes recreation area
by month-of-year and recreation area by year fixed effects. The fixed effects control for
seasonal factors and unobserved campground and recreation area characteristics that
drive occupancy rates and cancellations. The precipitation and temperature variables
control for weather effects that might affect camping decisions and outcomes.
Thus, our model isolates the impacts of fire and smoke by controlling for a variety of
unobserved factors that could be correlated with both fire and smoke and campground
use. Regressions are weighted by the number of campsites at campground i on date t
to account for heteroskedasticity. Standard errors are clustered at the recreation area
level to allow for errors to be correlated across campgrounds in the same area.
In Appendix B, we test distance bandwidths of 10 km and 30 km for the fire variable
and relax our measure of adverse smoke conditions by using the smoke plumes data
without the ground-level PM2.5 readings adjustment.
Wildfire, Smoke, and Outdoor Recreation in the Western United States 73. Results
3.1. Campgrounds and Campground Visitor-Days
Affected by Wildfire and Smoke
Consistent with our initial expectations, and the findings of previous literature, we
find that increased recreational activity coincides with wildfire and smoke events.
Participation in camping and other outdoor recreation activities on public lands is
highly seasonal. Good weather, long hours of daylight, school holidays, and other
factors lead most people to national parks and other recreation areas during summer
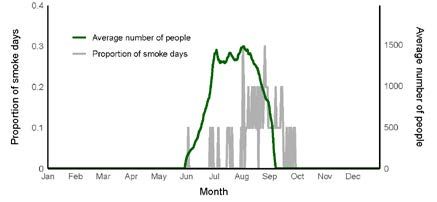
months, when wildfires are most common. Figure 1 plots average campground
occupancy rates within each week of the year against the frequency of campground-
days with smoke (left y-axis) or a wildfire nearby (right y-axis) for six subregions of
the western United States. Each triangle (fire) and circle (smoke) is colored by week—
redder colors are closer to the middle of the summer, and bluer colors correspond
to winter. In each region, higher occupancy rates are positively correlated with the
fraction of campground-days that are smoky or near a fire; further, campground
occupancy, fire, and smoke all coincide in the summer months.
Campgrounds in our sample were near active burning fires (within 20 km) an average
of 1.5 days per year, corresponding to 1.7 percent of the days those campgrounds
were open (Table 1, panel I, columns 1 and 2). The frequency with which campgrounds
experienced nearby fires varied across western subregions. In Southwest states
(Arizona and New Mexico) and California, campgrounds experienced nearby fires more
than two days per year on average, and the Rocky Mountains (Colorado and Wyoming)
and Great Basin (Nevada and Utah) campgrounds had fires nearby an average of
only 0.5 days per year. The result for California is relatively high because wildfires
were common in the state. Fires were less frequent in the Southwest, but those that
did occur were often close to federally managed campgrounds, especially the Grand
Canyon. Within a larger distance of 30 km to the nearest fire, more campgrounds were
affected: an average of 2.8 days per year, or 3.0 percent of the days campgrounds were
open during the period (Appendix B).
On average, 124,000 camper-days per year were within 20 km of an active wildfire, and
86,000 of these—nearly 70 percent—were in California (Table 1, panel I, columns 3
and 4). As a share of total camper-days, the number near an active fire ranged from an
average of 0.2 percent in the Rocky Mountains to 2.1 percent in California; the overall
average was 1.4 percent. If we relax the distance bandwidth to 30 km within an active
wildfire, the number of affected camper-days rises to 218,000, and the percent of
affected days rises to 2.5 (Appendix B).
In contrast to fire, smoke affects campgrounds and campers more often. On average,
across the western states, campgrounds experienced adverse smoke conditions seven
days per year, representing seven percent of the days that campgrounds were open
(Table 1, panel II, columns 1 and 2). Campgrounds in the Northern Rockies (Idaho and
Resources for the Future 8Montana) and Pacific Northwest states (Oregon and Washington) were especially
affected, with 10 and 12 percent of campground-days, respectively, experiencing
adverse smoke conditions. These subregions have actively burning wildfires less
frequently than other regions, but prevailing wind patterns bringing smoke from fires
in the south mean that they are disproportionately affected by smoke. Not only was
the average number of smoky days higher than in other subregions, but the percent
of available campground-days affected by smoke was much higher due to the shorter
camping season in those subregions, particularly in the Northern Rockies.
Nearly 400,000 camper-days per year, on average, were under adverse smoke
conditions during our sample period, with 160,000 in California (Table 1, panel II,
columns 3 and 4). However, that number accounts for only 4 percent of all camper-
days in California, much lower than the Pacific Northwest and Northern Rockies
subregions. This difference likely owes to the comparatively longer camping season in
California. By contrast, in the Northern Rockies, 7 percent of camper-days were under
adverse smoke conditions. On average, across the western continental United States,
4 percent of camper-days had air quality impaired by wildfire smoke. These findings
suggest that a nontrivial portion of the camping season is impacted by poor air quality
due to smoke in many parts of the western United States. If we use a less conservative
measure for smoke, the plumes without the adjustment from ground monitors, the
average number of camper-days per year rises to nearly 1.6 million (see Appendix B).
Impacts show substantial regional heterogeneity. Figure 2 combines the fire and smoke
information in a map of the western United States. The gray base map shows the
average number of annual days with adverse smoke conditions on a 15 km by 15 km
grid. Smoke is most frequent in northern California and southern Oregon and along the
Idaho-Montana border. Markers represent the location of campgrounds, with colors
denoting the total number of campground-days with a nearby wildfire (within 20 km)
over the study period. The map shows that California has a higher number of fire-
affected campground-days than most other states. Colorado, for example, has many
campgrounds but few campground-days near a fire, and Eastern Oregon has many
days with smoky conditions but few campgrounds.
Although wildfire activity has increased in the western United States over the past
several decades (Westerling 2016), we observed no clear trend in the number of
campground-days near wildfires over 2008–2017 (see Figure B2 in Appendix B). The
10-year study period is likely too short to observe longer term trends in campground
impacts, especially given the substantial year-to-year variation in fire events.
3.2. National Park Visitor-Days Affected by
Wildfire and Smoke
Campers are only a subset of all visitors at many federal recreation sites, particularly at
national parks. Although we do not have daily data on all visitors, we can approximate
the full impact of fire and smoke at national parks by combining our estimated fire- and
smoke-affected camper-days with monthly total visitation data collected by the NPS.
Wildfire, Smoke, and Outdoor Recreation in the Western United States 9We find that, on average, 392,000 visitor-days per year at the national parks in our
sample were close to active wildfires; Yosemite accounts for over half of this number
(Table 2). Approximately 1 million visitor-days per year occurred during adverse smoke
conditions, and these impacts were spread out across a larger number of parks. Once
again, this highlights the wide-ranging effects of smoke across the region. Total visitor-
days affected by fire and smoke exceed the numbers of camper-days at national parks
by factors of 6 and 12, respectively.
3.3. Changes in Recreation Site Use Due to Wildfire
and Smoke
Our results suggest a substantial number of people are affected every year by fire and
smoke while recreating on public lands. In this section, we analyze the extent to which
fire and smoke lead to averting behavior that affects campground use outcomes.
Table 3 displays summary statistics for the dependent variables of interest for
estimation of equation (3)—campground occupancy rates and pre- and postarrival
cancellation rates (as defined above). Before controlling for other factors, Table 3
shows evidence of changes in recreation site use in response to fire and smoke.
Column 1 reports means for a baseline scenario with no smoke or fire. Column 2
shows how mean occupancy and cancellation rates change when a fire is burning
within 20 km. Column 4 reports mean values for dates with adverse air quality due to
wildfire smoke. As expected, cancellation rates increase with fire or smoke. In contrast,
occupancy rates are higher, on average, on dates with fire or smoke. This result may
be because fire and smoke tend to occur during times of year that are popular for
camping (Figure 1). This highlights the need for a regression analysis that controls for
these temporal effects.
Table 4 shows the results of estimating the model in equation (3). We find statistically
significant evidence that campground use decreases and campground cancellations
increase on smoky days and days when wildfires burn within 20 km. On days with
nearby wildfires, the campground occupancy rate declines, on average, by 6.4
percentage points. With an average of 30.6 percent of campsites occupied in the
baseline (Table 3), this indicates a drop to 24.6 percent when a fire is nearby. The
prearrival cancellation rate increases by 8.7 percentage points with a fire nearby, more
than double the baseline average cancellation rate of 7.3 percent. The postarrival
cancellation (or early departure) rate increases by 1.3 percentage points, an order of
magnitude greater than the baseline average postarrival cancellation rate, which is only
0.2 percent. Using a relaxed bandwidth of 30 km for the nearest fire, we still observe
statistically significant effects: a campground occupancy rate that is 4.2 percentage
points lower and increases in prearrival and midstay cancellation rates of 6.1 and 0.8
percentage points, respectively (Appendix B).
Our estimates for the effect of fire on recreation do not distinguish among several
channels through which fires affect campground use. During fire events, campgrounds
may close, causing reservations to be cancelled by the managing agency. Fires can also
result in road closures, and even if roads remain open, campers may cancel if they are
Resources for the Future 10worried that further fire spread might disrupt their plans. We interpret our estimates of
the effect of fire on campground use as inclusive of each of these channels.
The estimated effects of smoke on camping decisions are more modest (Table 4). On
days with adverse smoke conditions, occupancy rates decline by only 1.3 percentage
point (from 30.6 percent of campsites occupied to 29.3 percent for the average
campground). Prearrival cancellation rates rise by approximately 2.3 percentage
points (a 32 percent increase from the baseline average cancellation rate of 7.3), and
postarrival cancellation rates rise by one-tenth of a percentage point (nearly a 50
percent increase from the baseline rate). When using only smoke plumes to identify
smoky days, estimated effects of smoke on occupancy and cancellation are more
modest but remain statistically significant in most cases (Appendix B).
Campgrounds and roads do not typically close due to smoke; therefore, we interpret
changes in campground use as indicative of avoidance behavior on the part of
campers. This behavior may be driven by concern over health impacts of exposure
to smoke or by decreased amenity values due to diminished views. Regardless of
motivation, we find that the magnitude of the resulting changes in total campground
use is, on average, relatively small.
The detail provided in our daily damping data allowed us to further investigate
differential avoidance behavior responses based on specific recreation areas. We posit
that visitors could be more willing to camp during adverse conditions at a popular
location like Glacier National Park relative to a smaller local campground. Limited
visitation seasons at northern parks like Glacier, as well as competitive reservations
at popular parks like Yosemite, could lead campers to brave the smoky conditions
rather than forego a trip altogether. To test for heterogeneous responses, we ran a
version of the regression that allows responses to fire and smoke to vary according to
campground popularity. To determine popularity, we measured campgrounds’ historical
average occupancy rates and segmented the results into quartiles (Table 5). In line
with our hypothesis, the occupancy rate was less responsive to smoke at the most
popular campgrounds (the top occupancy quartile) than at less popular ones. We
found no statistically significant differences in cancellation rates in response to smoke
by site popularity, however. Responsiveness to fire was greater at more popular sites.
Figure 3 uses our estimated regression results from Table 4 to map total declines
in the number of camper-days due to fire and smoke over the course of the study
period. We calculate declines in the number of campground-days due to fire (smoke)
by multiplying the estimated fire (smoke) coefficient in the occupancy rate regression
by the product of the average number of occupied sites at each campground on
days without fire (smoke), the average number of campers per campsite at each
campground, and the average number of days per year with fire (smoke) at each
campground. We aggregate these campground figures to the recreation area level,
which are the numbers shown on the map. Because fires tend to occur during times
of year with greater occupancy (Figure 1), we expect that these estimates understate
total reductions in campground use due to fire and smoke.
The figure highlights several key findings. First, although fires occur infrequently at
many locations, our regression results suggest that the marginal effects of fire on
Wildfire, Smoke, and Outdoor Recreation in the Western United States 11recreation behavior are relatively large. As a result, fires have large effects compared to
smoke. This shows up as large circles on the fire maps, which are mainly in California—
Yosemite in particular.
Second, although fire has much larger effects in some locations than others, the
magnitude of the smoke effects is more consistent across locations. Fire caused much
greater decreases in visitation than smoke at the most impacted campgrounds, but
the median campground experienced 259 fewer camper-days per year on average
due to smoke and only 95 fewer camper-days per year on average due to nearby
fires. In subregions with comparatively few fires—namely, the Pacific Northwest and
the Northern Rockies—smoke is still prevalent and has a similar impact on recreation
behavior as in other locations.
Third, the consequences of fire and smoke for changes in recreation site use over
the 10-year period are low to moderate in most places, but we see large impacts in
some regions and years. In Yosemite, the recreation area most impacted by fire, nearly
3,400 camper-days each year were lost due to fires. These impacts were not spread
evenly across years. In 2012, the year of the Cascade fire, which struck Yosemite and
surrounding areas in June and July, we estimate more than 8,500 fewer camper-days
due to nearby fire. Smoke also had its greatest effects in Yosemite: campers spent 590
fewer days per year there, on average, as a result of adverse smoke conditions.
We can combine our estimates of the reductions in camper-days from fire and smoke
with consumer surplus values for outdoor recreation estimated in the literature to
obtain a back-of-the-envelope estimate of the total annual consumer surplus loss to
campers who forego their trips because of fire or smoke. Rosenberger et al. (2017)
provide a review and summary of estimates of the value of fourteen outdoor recreation
activities, including camping, on US Forest Service lands by region. Kaval and Loomis
(2003) provide similar estimates for national parks, also by region. We combine the
mean values from these two studies, which are per activity day per person, with our
predicted declines in camper-days, and inflate to 2020 dollars. The consumer surplus
loss from fire and smoke across the 11 western states in our study averages $1.3 million
and $662,000 per year, respectively. Seventy-five percent of the consumer surplus loss
from fire and 41 percent of the loss from smoke occurs in California.
These are the losses from recreationists who forfeit their trips. There are also losses
experienced by recreationists who continue with their plans but experience health
effects or visual disamenities from smoke. Richardson et al. (2012), using survey data
from households in the Los Angeles area after a major fire, estimate an average cost
of smoke-related illness (costs of medications, doctor visits, and missed workdays)
per exposed person per day of $9.50. Inflating to 2020 dollars and multiplying by
the average number of camper-days per year affected by adverse smoke conditions,
383,000, from Table 1, we estimate illness costs of $4.1 million per year. Adding these
costs to the losses from avoided trips gives a total loss of $4.8 million per year from
wildfire smoke. This calculation is back-of-the-envelope and underestimates the
full welfare losses to exposed campers as it only includes cost of illness and not the
diminished value of the trip. Nonetheless, it provides some sense of the magnitude of
the welfare impacts from wildfire smoke experienced by campers on public lands.
Resources for the Future 124. Discussion
Increases in the popularity of outdoor recreation and increases in visitation to western
public lands in the United States are coinciding with another trend: the rising number
and size of wildfires. Our study, which merged detailed daily camping data at 1,069
western campgrounds with spatial wildfire, smoke plume, and air quality data over a 10-
year period, documents the extent of the impacts nearby actively burning wildfires and
wildfire smoke have on outdoor recreation in the region, and provides causal estimates
for how outdoor recreationists respond to fires and smoke. Importantly, we provide
the first estimates of wildfire smoke impacts on recreation on public lands across
the continental western United States. Smoke, which disperses over great distances,
affects many more people than fire itself. We calculated that 383,000 camper-days
per year, on average, took place under adverse smoke conditions, or 4 percent of all
camper-days. Using monthly visitation data for the 27 national parks in our sample, we
scaled the camping results and estimated that approximately one million national park
visitor-days per year, on average, were potentially affected by smoke over the 10-year
sample period. As our data exclude a few national parks in the region, this is likely to be
an underestimate of the full effects of smoke on national park visitors.
We found that campground use declines in response to fire and smoke. The
magnitudes of the estimated adjustments were relatively small, however. Average
occupancy rates, for example, decline by 6.4 percentage points for a fire within 20 km
and only 1.3 percentage points for adverse smoke conditions. Effects on recreation
site use on particularly threatening days (when a fire is very close by or air quality is
especially poor) are likely to be greater. Moreover, measurement error may bias these
estimated effects downward to some extent. Campers may change their plans without
cancelling their reservations, so that we are counting some visits that do not occur.
We feel that the magnitude of this error is likely to be small, however, as we observe
cancellations in the data and the refund policy provides a financial incentive to cancel.
The minimal effects of fire and smoke on campground usage may be a consequence of
constraints on either vacation times or campground availability. As shown in Walls et
al. (2018), it is challenging to find an open campsite at many national parks in the peak
summer months, so cancelling a trip because of smoky conditions may mean foregoing
the entire season. Indeed, we find that the effect of smoke on the average occupancy
rate is attenuated in the most popular campgrounds (Table 5).
Unfortunately, this lack of behavioral response by campers may mean significant
exposure to poor air quality. The contribution of wildfire smoke to PM2.5 concentrations
in the United States has increased substantially since about the mid-2000s, now
accounting for approximately half of overall PM2.5 exposure in many parts of the
western United States (Burke et al. 2021). The literature finds consistent evidence of an
association between wildfire smoke and general respiratory health effects, especially
exacerbation of asthma and chronic obstructive pulmonary disease, as well as an
association between smoke and increased risk of respiratory infections and all-cause
mortality (Reid et al. 2016; Cascio 2018). Because camping involves extended time
outdoors and is often accompanied by strenuous activities, such as hiking, recreational
Wildfire, Smoke, and Outdoor Recreation in the Western United States 13campers are likely to be particularly at risk of health impacts in smoky conditions.
Some studies have found that the negative health effects of elevated levels of air
pollution can offset the benefits of exercise (Korrick et al. 1998; Guo 2020).
In addition to health impacts, smoke can cause haze and reduced visibility. For visitors
to scenic public lands in the western United States, especially signature national
parks, such as Grand Teton, Glacier, and the Grand Canyon, reduced visibility can
significantly lower the value of the visit. Stated preference survey studies of visibility
in national parks have found that improved visibility is highly valued (Rowe et al. 1980;
Schulze et al. 1983). One study found that survey respondents would pay about $120
per year in the southeastern United States and about $80 per year in the Southwest
for visibility improvement programs that would remove the 20 percent worst visibility
days (Boyle et al. 2016). A separate study in southwestern British Columbia found that
survey respondents were willing to pay $92–$112 per year per household (in 2002
Canadian dollars) for a 5–20 percent improvement in visual range (Haider et al. 2019).
The authors apply these estimates to the number of poor visibility days due to wildfire
in July and August of each year from 2002 through 2018 and calculate that the value
of improving those days from “poor” to “excellent” would total $120 million over the 17-
year period.
US federal land management agencies could consider several policies to reduce
the impacts that wildfires and associated smoke have on outdoor recreation. These
policies can focus on lowering the threat of fire or increasing the ability of outdoor
recreationists to adapt. Lowering the threat can be achieved through mechanical
thinning of forests, prescribed burns, and managed wildfires (Kalies and Kent 2016).
These activities work in areas where heavy fuel loads have contributed to increasing
wildfire activity. Although prescribed burns and managed wildfires produce smoke,
they can be used opportunistically during times of the year with minimal impacts on
human activities, including outdoor recreation. Prescribed burns also reduce future
wildfire activity (Cochrane et al. 2012). While these land management strategies are
routinely used by agencies to reduce wildfire hazard, their pace and scale needs to
increase dramatically to result in substantial reductions in wildfire hazards and impacts
to recreationists and the region’s outdoor recreation economy (Clavett et al. 2021)
Adaptation can take the form of shifts in the location and timing of visits to public
lands to reduce exposure. To encourage these behavioral adjustments, recreationists
may need a “nudge.” As one example, land managers could employ flexible pricing
strategies across peak and nonpeak camping seasons by region that could be coupled
with other incentives to visit less fire- and smoke-prone locations during peak fire
season. In addition, increasing the supply of campsites in less risky locations could
help. With wildfires predicted to increase with climate change and outdoor recreation
on public lands more popular than ever, policymakers will need to devise creative
strategies to both reduce the likelihood and severity of fires and mitigate their impacts
on outdoor recreationists.
Resources for the Future 14References
Abatzoglou, J.T., and A.P. Williams. 2016. Impact of Anthropogenic Climate Change on Wildfire
Across Western US Forests. Proceedings of the National Academy of Sciences 113(42),
11770-11775.
Boxall, P. C., and J. Englin. 2008. Fire and Recreation Values in Fire-Prone Forests: Exploring
an Intertemporal Amenity Function Using Pooled RP-SP Data. Journal of Agricultural and
Resource Economics 33, 19–33.
Boyle, K.J., R. Paterson, R. Carson, C. Leggett, B. Kanninen, J. Molenar, and J. Neumann. 2016.
Valuing Shifts in the Distribution of Visibility in National Parks and Wilderness Areas in
the United States. Journal of Environmental Management 173, 10–22.
Bureau of Economic Analysis (BEA). 2019. Outdoor Recreation Satellite Account, US and
Prototype for States. Technical Report BEA 19-45. Washington, DC: BEA.
Bureau of Land Management (BLM). 2019. Public Land Statistics. Technical Report P-108-8.
Washington, DC: BLM.
Burke, M., A. Driscoll, S. Heft-Neal, J. Xue, J. Burney, and M. Wara. 2021. The Changing Risk
and Burden of Wildfire in the United States. Proceedings of the National Academies of
Sciences 118.
Burkhardt, J., J. Bayham, A. Wilson, E. Carter, J.D. Berman, K. O’Dell, B. Ford, E.V. Fischer, and
J.R. Pierce. 2019. The Effect of Pollution on Crime: Evidence from Data on Particulate
Matter and Ozone. Journal of Environmental Economics and Management 98, 102267.
Cascio, W.E. 2018. Wildland Fire Smoke and Human Health. Science of the Total Environment
624, 586–595.
Clavet, C., C. Topik, M. Harrell, P. Holmes, R. Healy, D. Wear. 2021. Wildfire Resilience Funding:
Building Blocks for a Paradigm Shift. The Nature Conservancy, May 2021.
Crockett, J.L. and A.L. Westerling. 2018. Greater Temperature and Precipitation Extremes
Intensity Western US Droughts, Wildfire Severity, and Sierra Nevada Tree Mortality.
Journal of Climate 31(1), 341-354.
Cochrane, M.A., C.J. Moran, M.C. Wimberly, A.D. Baer, Mark A. Finney, K.L. Beckendorf, J.
Eidenshink, and Z. Zhu. 2012. Estimation of Wildfire Size and Risk Changes Due to Fuels
Treatments. International Journal of Wildland Fire 21, 357–367.
Duffield, J.W., C.J. Neher, D.A. Patterson, and A.M. Deskins. 2013. Effects of Wildfire on Na-
tional Park Visitation and the Regional Economy: A Natural Experiment in the Northern
Rockies. International Journal of Wildland Fire 22, 1155–1166.
Eidenshink, J., B. Schwind, K. Brewer, Z.L. Zhu, B. Quayle, and S. Howard. 2007. A Project for
Monitoring Trends in Burn Severity. Fire Ecology 3, 3–21.
Englin, J., J. Loomis, and A. González-Cabán. 2001. The Dynamic Path of Recreational Values
Following a Forest Fire: A Comparative Analysis of States in the Intermountain West.
Canadian Journal of Forest Research 31, 1837–1844.
Englin, J., J.M. McDonald, and K. Moeltner. 2006. Valuing Ancient Forest Ecosystems: An
Analysis of Backcountry Hiking in Jasper National Park. Ecological Economics 57,
665–678.
Fowler, M., A.M. Rad, S. Utych, A. Adams, S. Alamian, J. Pierce, P. Dennison, J.T. Abatzoglou, A.
AghaKouchak, L. Montrose, and M. Sadegh. 2019. A Dataset on Human Perception of and
Response to Wildfire Smoke. Scientific Data 6, 1–10.
Giglio, L., W. Schroeder, and C. O. Justice. 2016. The Collection 6 MODIS Active Fire Detection
Algorithm and Fire Products. Remote Sensing of the Environment 178, 31–41.
Guo, C., Y. Bo, T.C. Chan, Z. Zhang, C. Lin, T. Tam, A.K.H. Lau, L. Chang, G. Hoek, and X.Q. Lao.
Wildfire, Smoke, and Outdoor Recreation in the Western United States 152020. Does Fine Particulate Matter (PM2.5) Affect the Benefits of Habitual Physical Ac-
tivity on Lung Function in Adults: A Longitudinal Cohort Study. BMC Medican 18, 1–15.
Haider, W., D. Knowler, R. Trenholm, J. Moore, P. Bradshaw, and K. Lertzman. 2019. Climate
Change, Increasing Forest Fire Incidence, and the Value of Visibility: Evidence from Brit-
ish Columbia, Canada. Canadian Journal of Forest Research 49, 1242–1255.
Hesseln, H., J. Loomis, and A. González-Cabán, S. Alexander. 2003. Wildfire Effects on Hiking
and Biking Demand in New Mexico: A Travel Cost Study. Journal of Environmental
Management 69, 359–368.
Hesseln, H., J. Loomis, and A. González-Cabán. 2004. The Effects of Fire on Recreation De-
mand in Montana. Western Journal of Applied Forestry 19, 47–53.
Hilger, J., and J. Englin. 2009. Utility Theoretic Semi-Logarithmic Incomplete Demand
Systems in a Natural Experiment: Forest Fire Impacts on Recreational Values and Use.
Resource and Energy Economics 31, 287–298.
Hoover, K., and L. Hanson. 2019. Wildfire Statistics. Congressional Research Service (CRS)
Technical Report IF10244. Washington, DC: CRS.
Jerrett, M., R.T. Burnett, R. Ma, C.A. Pope III, D. Krewski, K.B. Newbold, G. Thurston, Y. Shi, N.
Finkelstein, E.E. Calle, and M.J. Thun. 2005. Spatial Analysis of Air Pollution and Mortality
in Los Angeles. Epidemiology, 727–736.
Kalies, E. L., and L.L.Y. Kent. 2016. Tamm Review: Are Fuel Treatments Effective at Achieving
Ecological and Social Objectives? A Systematic Review. Forest Ecology and Manage-
ment 375, 84–95.
Keiser, D., G. Lade, and I. Rudik. 2018. Air Pollution and Visitation at US National Parks.
Science Advances 4, eaat1613.
Kim, M.K., and P.M. Jakus. 2019. Wildfire, National Park Visitation, and Changes in Regional
Economic Activity. Journal of Outdoor Recreation and Tourism 26, 34–42.
Kochi, I., G.H. Donovan, P.A. Champ, and J. Loomis. 2010. The Economic Cost of Adverse
Health Effects from Wildfire-Smoke Exposure: A Review. International Journal of Wild-
land Fire 19, 803–817.
Korrick, S.A., L.M. Neas, D. W. Dockery, D.R. Gold, G. A. Allen, L.B. Hill, K.D. Kimball, B.A. Rosner,
and F.E. Speizer. 1998. Effects of Ozone and Other Pollutants on the Pulmonary Function
of Adult Hikers. Environmental Health Perspectives 106, 93–99.
Loomis, J.A. González-Cabán, and J. Englin. 20001. Testing for Differential Effects of Forest
Fires on Hiking and Mountain Biking Demand and Benefits. Journal of Agricultural and
Resource Economics 26, 508–522.
National Park Service (NPS). 2019a. National Park Visitor Use Statistics. NPS Annual Summa-
ry Report. Washington, DC: NPS.
NPS. 2019b. National Park Service Current Year Monthly and Annual Summary Report. Wash-
ington, DC: NPS.
Preisler, H.K., D. Schweizer, R. Cisneros, T. Procter, M. Ruminski, and L. Tarnay. 2015. A Sta-
tistical Model for Determining Impact of Wildland Fires on Particulate Matter (PM2.5)
in Central California Aided by Satellite Imagery of Smoke. Environmental Pollution 205,
340–349.
Reid, C.E., M. Brauer, F.H. Johnston, M. Jerrett, J.R. Balmes, and C.T. Elliott. 2016. Critical Re-
view of Health Impacts of Wildfire Smoke Exposure. Environmental Health Perspectives
124, 1334–1343.
Richardson, L.A., P.A. Champ, and J. Loomis. 2012. The Hidden Cost of Wildfires: Economic
Valuation of Health Effects of Wildfire Smoke Exposure in Southern California. Journal of
Forest Economics 18, 14–35.
Resources for the Future 16You can also read