Working Paper Series Covid-19 and rural landscape: the case of Italy - European ...
←
→
Page content transcription
If your browser does not render page correctly, please read the page content below

Working Paper Series
          Mauro Agnoletti, Simone Manganelli,   Covid-19 and rural landscape:
                              Francesco Piras
                                                the case of Italy

                                                   No 2478 / October 2020

Disclaimer: This paper should not be reported as representing the views of the European Central Bank
(ECB). The views expressed are those of the authors and do not necessarily reflect those of the ECB.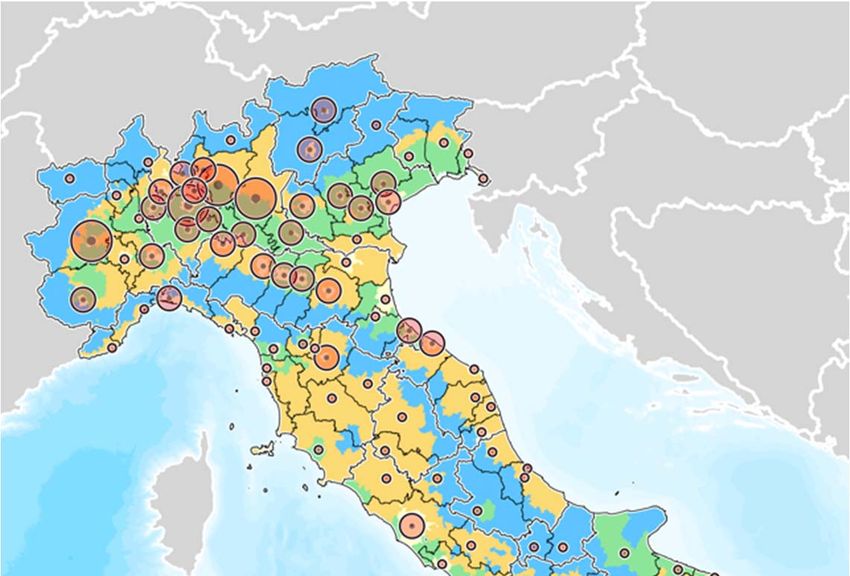
Abstract
Throughout the covid‐19 emergency, health authorities have presented contagion data divided by
administrative regions with no reference to the type of landscape, environment or development
model. This study has been conducted to understand whether there is a correlation between the
number of infections and the different rural landscapes of the country. Italy’s rural landscape can
be classified in four types, according to the intensity of energy inputs used in the agricultural
process, socioeconomic and environmental features. Type A includes areas of periurban
agriculture surrounding the metropolitan cities, type B areas of intensive agriculture with high
concentration of agroindustry, type C hilly areas with highly diversified agriculture and valuable
landscape, and type D high hills and mountains with forests and protected areas. Areas A and B
are located in the plains, covering 21% of the territory and accounting for 57% of the population.
They produce most of the added value, consume high levels of energy and represent the main
source of pollution. Areas C and D cover 79% of the territory and 43% of the population. We find
that provinces with 10% more type C and D areas exhibit on average 10% fewer cases of
contagion. The result is statistically significant, after controlling for demographic, economic and
environmental characteristics of the provinces. The pollution produced in more energy‐intensive
landscape has triggered an intense debate of how to ensure the economic competitiveness of
Italian agriculture, without compromising environmental integrity or public health. Our findings
speak to this debate, by suggesting that planning for more rural territory with lower energy inputs
may come with the added benefit of new development opportunities and decreasing the exposure
of the population to covid‐19. Cost benefit‐analyses should take into account that policies aimed
at repopulating more rural areas may reduce the economic impact of covid‐19 and of potential
future pandemics.

Keywords: Exposure to covid‐19; environment; sustainable agriculture.
JEL classification: Q1; Q15; O13.

ECB Working Paper Series No 2478 / October 2020                                                  1
NON‐TECHNICAL SUMMARY

Italy has been one of the worst hit countries by covid‐19. This study links the diffusion of covid‐19
to the socio‐economic and environmental features of the Italian territory. It does so by collecting
and matching data on rural classification of Italian regions, cases of covid‐19 infections, as well as
demographic characteristics of the Italian population. Italians living in less energy‐intensive
provinces are less exposed to covid‐19. Less energy‐intensive areas have an average of 49 infected
per square kilometre and 28 per 10.000 inhabitants, compared to 134 per square kilometre and 37
per 10.000 inhabitants in more energy‐intensive zones. These results are confirmed by a more
formal regression analysis and are robust to controlling for demographic, economic or
environmental characteristics of the province.

The underlying causes remain unclear. Some studies suggest a relationship with pollution or
wildlife used as food, but more research is needed to confirm our findings at international level
and to establish a clearer causal link. What is certain is that energy‐intensive areas are more
vulnerable to pollution by nitrates, methane and emissions of nitrous oxide. They are also
contributing to ecosystem simplification, loss of ecosystem services and species extinctions.
Independently of whether there is a causal link between pollution and covid‐19, incentives for a
more sustainable agriculture are needed, to meet the demands of improving yields without
compromising environmental integrity or public health.

The concentration of cultures in more energy‐intensive areas and the consequent abandonment
of marginal areas in Italy is the result of socio‐economic forces which have shaped the Italian
society since World War II. Few figures can best illustrate these developments: more than 10
million hectares of agricultural land has been abandoned, the labour force in the agricultural
sector went from 42% of the total employment in the after‐war period to about the current 4%,
resulting in an increased concentration of the population in urban areas and depopulation of more
rural regions. The side effect has been an increase in pollution, in hydrogeological risks and the
loss of fertility due to the abandonment of traditional agricultural practices. From the
environmental point of view, the potential of low‐energy agriculture should be promoted more
actively by policy‐makers and the public opinion, recongnizing that protecting European
landscapes and biotopes of high natural conservation value requires low‐intensity farming.

The findings of this paper speak to this debate, by suggesting that cultivating more rural territory
with lower energy inputs comes with the added benefit of decreasing the exposure of the

ECB Working Paper Series No 2478 / October 2020                                                     2
population to covid‐19 disease. Given the exorbitant costs covid‐19 is imposing on our society,
preparing for future outbreaks calls for policies that would increase the overall resilience of our
system should a new pandemic strike again. Claiming back abandoned land and returning to more
landscape friendly cultures should be part of this discussion. The positive externalities associated
with the conservation and correct management of the landscape resources should be explicitly
recognised in the economic assessment of rural development strategies.

People have moved out of rural areas for a variety of reasons. They will not go back unless proper
incentives are provided. Investments in information and communication technology in these
regions should be substantially increased. Faster internet connections should be considered as a
basic public service. Access to healthcare, welfare and education services in these areas should
also be drastically improved.

ECB Working Paper Series No 2478 / October 2020                                                   3
1. Introduction

In the 14th century, Giovanni Boccaccio escaped the Great Plague that was ravaging Europe by
finding shelter in the countryside near Florence. Not only did he and his nine companions survive,
but he went on to write about that experience in The Decameron, widely considered the first
example of western narrative. This paper confirms that Boccaccio chose wisely. People living in
more rural areas are less likely to contract covid‐19. The surprising element of our findings is that
they are not explained away by the lower population density of these areas, or other
demographic, economic or environmental characteristics.

Italy has been one of the worst hit countries by covid‐19 and since February 2020 has been at the
forefront in the fight against the pandemic. The first cases were found in Rome, on 31 January,
when tourists returning from China were found positive to the virus. As a first measure, Italian
authorities supended all flights to and from China. On 18 February, an outbreak was identified in
Codogno (Lodi), triggering wide media reactions and inducing the Italian government to
quarantine the town. The contagion subsequently spread first to the nearby municipalities, and
eventually to the whole country. Figure 1 presents a timeline of the events, together with the
spreading of the contagion. On 9 March, the country entered the “phase 1”, a partial lockdown of
the commercial, industrial and entertainment activities. This initially involved only the so‐called
“red areas” (the most afflicted municipalities), but as of 11 March, in combination with the peak of
the infections, it was extended to the entire national territory. After 21 March, these restrictions
became stricter, by stopping every activity not deemed absolutely necessary. The “phase 2”, with
a gradual return to normal activities, started on 4 May. Since the contagion was not yet
eradicated, many activities continued to be subject to restrictions (social distancing, booking
requirements and obligation of wearing masks indoor).

Figure 1: Chronology of covid‐19 infections in Italy

Official data about contagion have been collected at province level, with no consideration about
the different typologies of the territory. The novel perspective of this study is to link the diffusion
of covid‐19 to the socio‐economic and environmental features of the Italian territory. We do so by
collecting and matching data on rural classification of Italian regions, cases of covid‐19 infections,

ECB Working Paper Series No 2478 / October 2020                                                      4
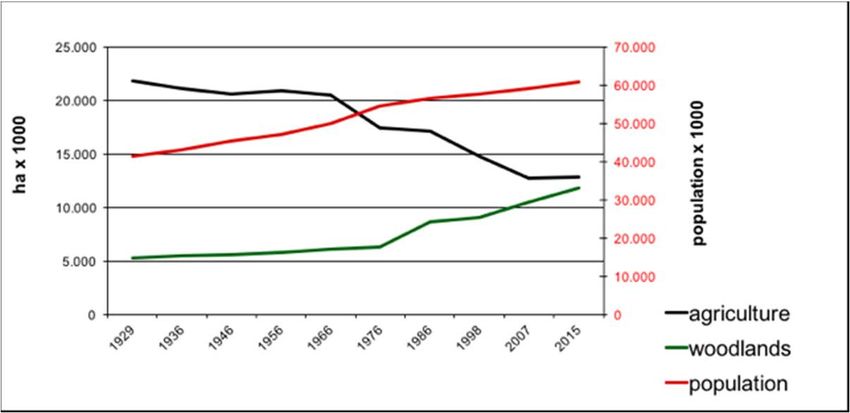
as well as demographic, economic and health characteristics of the Italian population. We find
that provinces with greater share of rural territory tend to have significantly less exposure to
covid‐19, controlling for pollution, population and unemployment. The results are not only
statistically significant, but economically relevant: provinces with 10% more share of rural land
exhibit on average 10% fewer cases of contagion. This is, to the best of our knowledge, the first
scientific contribution to consider the problem from this perspective (Torero 2020).

Understanding the current composition of the Italian territory requires to briefly recalling the
changes it went through over the past few decades (see Figure 2). The period after World War II
has been characterized by an increasing exploitation of plains and abandonment of marginal areas
(Levers et al. 2018). The abandonment of more than 10 million hectares of agricultural land has
resulted in an increase in forests by 8 million approximately (Agnoletti 2013, ONPR 2018). The
labour force in the agricultural sector went from 42% of the total employment in the after‐war
period to about the current 4%. These developments have been mirrored by a parallel
concentration of the population in urban areas and depopulation of more rural regions (ISTAT
2018). This is also demonstrated by the reduction of residents in municipalities with less than
10.000 inhabitants dropping from 45% of the total population in 1951 to 35% in 1971. This trend
continued in the following decades, accompanied by a parallel migration from southern to
northern regions (De Rubertis 2019, ISTAT 2014).

The causes behind these developments are numerous, but to a large extent can be traced to the
effects of competition. The need to prosper in an increasingly competitive environment led to the
adoption of more specialized cultures, the development of productivity enhancing techniques and
the elimination of traditions such as terracings and low‐density systems which were no longer cost
effective (Agnoletti et al. 2019). The side effect has been an increase in pollution, as these areas
are the main responsible for the production of nitrates, methane and nitrous oxide (Houser et al.
2020). Inverting this trend is part of a larger political debate and requires incentives aimed at
ensuring the sustainability of agriculture, without compromising environmental integrity or public
health (Tilman et al. 2002).

The findings of this paper speak to this debate by suggesting that cultivating more rural territory
with lower energy inputs may come with the added benefit of decreasing the exposure of the
population to covid‐19 disease. The underlying causes remain unclear. Some studies suggest a
relationship with pollution (Wu et al. 2020) or wildlife used as food (Yuan et al. 2020), but more

ECB Working Paper Series No 2478 / October 2020                                                   5
research is needed to confirm our findings at international level and to establish a clearer causal
link. However, given the exorbitant costs covid‐19 is imposing on our society, preparing for future
outbreaks calls for policies that would increase the overall resilience of our system should a new
pandemic strike again. Claiming back abandoned land and returning to more landscape friendly
cultures should be part of this discussion, as well as re‐imagine and re‐work agricultural and food
systems, perhaps in line with different values and strategies (Sanderson 2020).

The paper is structured as follows. Section 2 describes in greater detail the classification of the
Italian territory and its socio‐economic and environmental characteristics. It also presents the
statistical framework used to analyse the data. Section 3 discusses the results from the regression
analysis. Section 4 places our statistical findings into the boader policy discussion. Section 5
concludes.

Figure 2: population growth and dynamics of the agricultural and forest surfaces in Italy between
1929 and 2015 (Agnoletti 2013)

    2. Methods
    2.1 Classification of the Italian rural landscapes

The Italian Ministry of Food, Agriculture and Forest Policies has classified the Italian rural
landscape into four distinct types. It is an official classification, also adopted by the National
Observatory for Rural Landscapes, with precise policy objectives and used to allocate funds for
specific interventions. The identified categories are:

    A. Urban and periurban rural landscapes
    B. High intensity landscape types
    C. Medium intensity landscape types
    D. Low intensity landscape types

This type of classification is used both in the context of the National Strategic Plan for Rural
Development 2007‐13, when landscape was introduced for the first time among the objectives of

ECB Working Paper Series No 2478 / October 2020                                                  6
the plan, and the National Strategic Framework of EU Cohesion Policy. These classifications are
also relevant in the context of the Common Agricultural Policy and the Biodiversity Strategy
towards 2030, especially when spatial information is required to assess the stated objectives.
Classifications based on intensity of agricultural activities, environmental features and economic
development is supported by a rich scientific literature, usually measuring intensity as the
anthropogenic energy required in the primary crop production (Tieskens et al. 2017, Estel et al.
2016). The intensification of agriculture with high‐yielding crop varieties, fertilization and
pesticides led to a substantial increase in food production over the past 50 years, but had also
damaging environmental consequences. The amount of nitrogen – a major air pollutant
contributing, among other things, to the formation of ozone and acid rains – is a frequently used
proxy for agricultural intensity (Overmars et al. 2014, Temme and Verburg 2011, van der Zanden et
al. 2016). Land conversion and agricultural intensification alter the biotic interactions and patterns
of resource availability in ecosystems. The implications for the local, regional and global
environmental can be serious (Erb et al. 2013, Rega et al. 2020).
A. Urban and periurban landscape types
These landscapes comprise 195 municipalities with high average population density (about 1,510
inhabitants per square kilometre), including regional capitals, large metropolitan cities, as well as
those areas with high population density and low territorial extension of agriculture. They include
30% of the Italian population and cover 4% of the territory, representing urban and periurban
landscapes in the plains of Italy (see light yellow areas in the Figure 3). They are characterized by a
strong presence of the tertiary sector and a moderate level of manufacturing activity. Agriculture
accounts for 12% of the national added value, mostly concentrated in territories around large
urban centres. These areas provide short‐range consumer demand for high‐quality products, but
the quality standards of production are not always up to the demand. Immediately adjacent to the
urban fabric, there is a strong concentration of industrial activities, employing 31% of the agro‐
industrial workforce. Most of these activities require high external energy inputs, putting these
areas in the highly energy‐intensive category (Tello et al. 2016).
The urban centres are characterized by highly profitable land, with over €5,000 of added value per
hectare of Utilized Agricultural Area (UAA). The high value of the land results in a significant
decrease in total agricultural area in favour of urban sprawl. Indirect impacts on farms of these
ECB Working Paper Series No 2478 / October 2020 7areas include splitting of cultivation units, constraints on agricultural practices due to the
proximity of inhabited centres and pollution phenomena caused by non‐agricultural sources
(Houser et al. 2020).
Proximity to urban centres makes these areas fairly well equipped with services for the population
and the economy. Although no data is available at this level of territorial breakdown, these rural
areas are those with a greater supply of internet services. The particular orographic and
demographic situation leads to the co‐habitation of residential and tourist settlements with highly
specialized and intensive agricultural activities. They represent important economic and
employment realities, but, at the same time, have a significant environmental impact.
B. High intensity landscape types
This group includes lowland landscapes that are classified as rural, significantly rural or even
urbanized rural. They are located in plains and in the immediately adjacent low altitude hill areas,
mainly in the northern regions of the country (see green areas in Figure 2) as the Po river valley.
The urban footprint represents 10% of the territory, cultivated areas 80%, forests 7%. They include
over 1,782 municipalities, representing over a quarter of the total national population (27%).
These areas constitute the backbone of the agro‐industrial system: while they account for 24% of
the UAA and 29% of the agricultural workers in the country, they produce 38% of the national
agricultural added value.
Type B areas are densely populated (313 inhabitants per square kilometre). Its population is
relatively younger and growing strongly (more than 10% in the last decade) attracting young
people from marginal rural areas and the south of the country. Agricultural and forest areas cover
87% of the territory and there is also a strong specialization in agricultural production and food
industry, with a concentration of agro‐industrial chains.
The strong agricultural specialization and recent migratory phenomena have led, in some specific
areas, to increase competition in the use of primary resources, creating problems of
environmental impact and sustainability of agricultural activity. These areas have a higher
concentration of zones vulnerable to nitrates, over 35% of the country total against an area of
about 5%, causing river degradation and harming people’s respiratory system (Ladrera et al. 2019,
Arauzo et al. 2011, Burt et al. 2010). Type B zones include also 6% of the national protected areas
ECB Working Paper Series No 2478 / October 2020 8that fall within the Natura 2000 network. They are, nevertheless, significantly affected by the
strong anthropization of the territory and by the commercial and tourist industry.
C. Medium intensity landscape types
This typology includes mostly hills and small parts of mountain landscapes, especially in the center
of the country, but also in the north and south of Italy. They are mainly or significantly rural and
have a good level of diversification of economic activities (see orange areas in Figure 2). There are
3,084 municipalities, representing about 30% of the Italian population and 33% of the territorial
surface. The urbanized area covers 5% of the total territory, agricultural area 62%, forest area
29%. The population has grown by 5.7% in the last decade, but is characterized by a higher aging
index. Agriculture plays a significant role, both in terms of surface and employment, even if the
intensity of production is more modest than in previous areas (about €2,200 per hectar). In the
last decade, this type of landscape has shown strong signs of crisis, significantly losing agricultural
area (‐12% of UAA and ‐14% of Total Agricultural Area (TAA), with percentages that drop
respectively to ‐18% and ‐20% in the less developed regions) and jobs (‐27%). The main factors
behind these developments are the high production costs and lower profitability due to the
morphology of the territory and the presence of traditional agricultural arrangements, such as
terraces and polycultures (Barbera and Cullotta 2016). These problems are compounded by
commercial difficulties of promoting the rich variety of typical products, abundant in these areas.
Farmers with alternative income represent 28% of the total also because agriculture in these areas
is complementary to other activities and promotes growth of the local economic system in an
integrated form. The highly qualified agricultural sector is supported by the presence of highly
valued resources such as attractive landscape, cultural and historical landmarks, as well as typical
food and wine. This is confirmed by the fact that more that 83,9% of agritourism firms is located
on mountain and hilly areas in Italy. Synergies among these resources help creating an integrated
local economic system, with a balanced development of tertiary activities related to tourism, trade
and specialized services. These areas can be considered as cultural landscapes, where the term
cultural becomes a value‐laden concept putting a premium on historical agricultural traditions
(Agnoletti 2013, Antrop 1997, Bignal and McCracken 1996, Fischer et al. 2012, Plieninger et al.
2006).
ECB Working Paper Series No 2478 / October 2020 9About 23% of Natura 2000 areas of Italy are concentrated in this area, for a total surface of about
10%. The nitrate vulnerable areas instead represent 29% of those identified at national level, with
an incidence on the total area of only 2.3%. The infrastructure is typically rural, limited to roads
and railways, with often reduced connections and services. Same goes for telematic
infrastructures, with broadband serving only a minority of the population. The reduced
specialization of agriculture, less developed infrastructure, the lower urban and industrial
concentrations, and the good presence of natural and landscape resources contribute to classify
these areas as medium energy‐intensity (Marull et al. 2016).
D. Low intensity landscape types
These areas include 2,865 municipalities, mostly in the mountains and significantly rural high hills
in southern Italy, the central and northern mountains with a more markedly rural nature, and
some areas of the southern plains and islands (see blue areas in Figure 2). The urbanized area
covers 2% of the territory, the agricultural areas 34% and forests 54%. They are the least densely
populated areas of the country (59 inhabitants per square kilometer), characterized by scarce
presence of local development processes in all sectors and abandonment by the population (‐
0.76% in the last decade). The demographic decline in southern regions has been accelerated by
migration, in particular from mountain areas, consistent with developments in other European
mountain areas (Macdonald et al. 2000). The aging index is far above the national average. Type D
areas represent 13% of the population, occupy 46% of the country’s territory, 42% of the TAA and
35% of the UAA. They represent 20% of the agricultural workers and 18% of the national added
value. The agricultural workers in these areas are around 225,000, the agro‐industrial 53,000, the
non‐agricultural 2.6 million.
The presence of widespread extensive agriculture is accompanied by the presence of most of the
Italian forests (69%) and a great variety of natural habitats. These areas are of particular
environmental importance, with 68% of Italian protected areas and over 62% of Natura 2000
areas, accounting for more than 2.5 million hectares and an incidence on the total area of over
21%. This contrasts sharply with the rapid agricultural intensification occurred in Europe and
northern Italy after World War II, which sacrificed heterogeneity for more homogeneous and
commercially profitable landscapes (Agnoletti 2013, Bignal and McCracken 1996, Isselstein 2003).
Only 16% of the nitrate vulnerable areas are located in these areas, with an incidence on the total
ECB Working Paper Series No 2478 / October 2020 10area of 1%. Type D areas can be classified as low energy‐intensity, given their limited industrial,
urban and infrastructural development.
Farming is characterized by low levels of profitability of the land (just over €1,000 per hectare of
Utilized Agricultural Area) and a low level of production intensification (on an average of 100
hectares of Total Agricultural Area only 56 are used). Abandonment processes are particularly
intense, especially in the inner mountains. Traditional Mediterranean crops (olive trees, vines,
promiscuous arboriculture with arable crops, forest crops) are widespread even if at low
productivity and characterized by traditional planting schemes and reduced presence of chemical
inputs in the land. The chances of survival and growth of these realities are connected to the local
resources. They range from the more effective promotion of typical and quality products, to
development based on diversification of local economic activities, and attraction of tourism
through environmental resources and cultural landscapes, when not affected by intense
abandomenmt and inappropriate policies (Agnoletti 2014). This could help alleviate socio‐
economic problems, such as high unemployment levels, lower disposable income, gap in the
provision of services compared to other areas of the country.
Overall, type A and B areas account for 21% of the Italian territory and 51% of the population.
They can be described as high energy‐intensity areas due to a combination of factors like urban
areas, industrial facilities and intensive farming. Type C and D areas, on the other hand, account
for 79% of the Italian territory, 43% of the population. They can be classified as low energy‐
intensity areas.
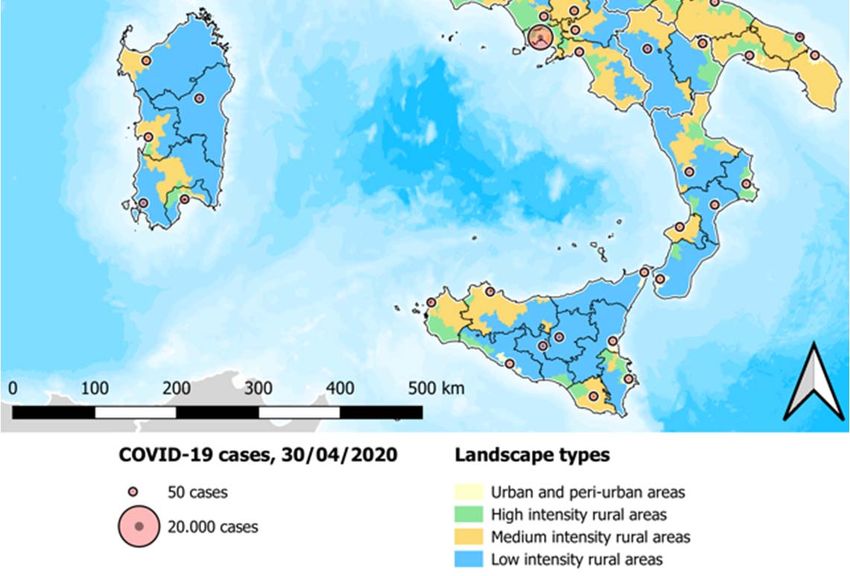
Figure 3: map of rural landscape types with the distribution of cases of COVID‐19.
2.2 Applied statistical analysis
The objective of this study is to understand whether there is a correlation between the different
landscape types and the cases of covid‐19 contagion. To answer this question, we first match four
different databases and next discuss the econometric strategy to analyse the data.
The type of data used and related sources are the following.
i. Administrative borders: the shapefiles available on the website of the Italian statistical
agency (ISTAT) provide the administrative borders for towns, provinces and regions.
ECB Working Paper Series No 2478 / October 2020 11(https://www.istat.it/it/archivio/222527 )
ii. Covid‐19: the website of the Health Ministry provides data on total covid‐19 cases for each
Italian province. The cut‐off date for our analysis is 30 April 2020.
(http://www.salute.gov.it/portale/nuovocoronavirus/dettaglioContenutiNuovoCoronavirus
.jsp?area=nuovoCoro%20navirus%20&id=5351&lingua=italiano&menu=vuoto, last update
30/04/2020)
iii. Demographics: data about population is obtained at province level by ISTAT, as of 2019.
(http://demo.istat.it/index.html, last update 30/04/2020.)
iv. Classification of the Italian rural landscape types: This classification has been described in
the previous section and it is based on data provided by the Ministry of Food, Agriculture
and Forest Policies. (https://www.reterurale.it/psrn)
A visual representation of the data is presented in Figure 3. The figure maps the Italian territory
into its different landscape types and superimposes the number of covid‐19 cases per province.
The high correlation between high energy‐intensity landscape and contagion is self‐evident. We
first complement this graphical analysis with a few summary statistics and next proceed to a more
formal econometric analysis.
Since the data on contagion are provided at province level, we need to work at this level of
aggregation, even though the classification of rural areas is available at a finer degree of precision.
It is worth noting the uncertainty of available official data, particularly pertaining to the true
baseline number of infected cases, potentially leading to ambiguous results and inaccurate
forecasts (Anastassopoulou et al. 2020).
We impute the contagion cases to the different rural areas following two alternative hypotheses.
Proportional to the landscape types – We compute for each province the percentage of
surface occupied by type A, B, C and D areas and allocate the number of contagion
available per province according to this percentage break down. We further divide by the
total surface in square kilometres and report the results per 100 km2.
Proportional to the rural population – We compute for each province the percentage of
population living in type A, B, C and D areas and allocate the number of contagion available
per province according to this percentage break down. We further divide the number of
inhabitants and report the results per 10.000 people.
To further simplify, we report the results in two macro‐categories:
ECB Working Paper Series No 2478 / October 2020 12 Intensive landscapes: areas A and B
Non‐intensive landscapes: areas C and D
The results are reported in Table 1. It shows that intensive landscape areas have on average a
higher number of infected people. The gap between intensive and non‐intensive landscapes is
more pronounced when contagion is computed proportionally to the areas, than when it is
computed proportionally to the population living in those areas. This is not surprising: the
population is not homogenously distributed within the province according to its rural composition,
but tends to be more concentrated in intensive landscape areas. The second classification takes
this partially into account and shows a much lower gap. These descriptive statistics raise three
obvious concerns. First, since data on covid‐19 is available only at province level, the attribution of
cases within the areas of each province is arbitrary (even though the allocation proportional to the
population appears to be more plausible). Second, the difference between the intensive and non‐
intensive landscapes could be entirely explained by the higher population density of the intensive
areas, as the drop in column B of Table 1 seems to suggest. Third, is the difference statistically and
economically significant?
We address each of these issues simultaneously with the help of a linear regression analysis. The
dependent variable to be explained is the number of covid‐19 cases per province. The explanatory
variables are the percentages of type A, B, C and D per province. We compute these percentages
in the two alternative ways already discussed: first as a fraction of the total surface and second as
a fraction of the total population. In the empirical analysis, we focus on this second definition, as it
provides a more plausible classification and it fits the data better. We also use as controls the
average age, the density, the percentage of population relative to the national total, the level of
pollution, the rate of unemployment, the percentage of over 65 and the mortality rate. All
statistics are computed at province level, with the exception of the level of pollution which is
available only at regional level. We refer to the notes at the bottom of Table 2 for a precise
definition of each variable. All the data comes from the ISTAT database site (http://dati.istat.it).
The data characteristics are summarised in Table 2. The average number of cases is 34 per 10,000
inhabitants, ranging from a minimum of 2.6 registered in Sud Sardegna, to a maximum of 168 in
Cremona. Areas A, B, C and D accommodate about 22%, 23%, 35% and 21% of the population,
respectively. The average age of the population is 46, with a maximum of 49 in Savona and Genoa
and a minimum of 41 in Naples. The most and least densely populated provinces are Naples and
ECB Working Paper Series No 2478 / October 2020 13Nuoro, respectively. The most and least populous provinces are Rome and Isernia, with 7,19% and
0.14% of the Italian population. The average unemployment is 10%, Crotone has the highest rate
(29%) and Bolzano the lowest (3%). The provinces with the highest and lowest percentages of over
65 are Savona (29) and Caserta (18). Finally, mortality rates are highest in Alessandria (18) and
lowest in Bolzano (8).
Since type‐D areas tend to be scarcely populated, type‐C and type‐D areas are aggregated into a
single category, and we consider in the regression analysis only non‐intensive landscape areas. All
standard errors are heteroscedasticity consistent, following White (1980). We run regressions at
an increasing level of sophistication.
First, to have an initial confirmation of the validity of the results of Table 1, a simple regression is
estimated, without controls. These results serve to understand whether the relation between the
cases of covid‐19 and rural areas found before is also statistically significant:
Model 1:
Since the sum of the two areas (intensive and non‐intensive) is 100 by construction, intensive
areas are omitted from the regression and are absorbed by the constant. Estimating Model 1 with
as regressors instead of gives the same value for the coefficient , but with
opposite sign.
Second, one obvious concern is that the energy‐intensive areas are also those more densely
populated, and therefore more prone to the diffusion of covid‐19. To rule this possibility out, we
control for a number of variables:
Model 2:
where X includes demographic, economic, health and environmental variables.
Third, we relax the assumption of linear relationship, by adding quadratic and cubic terms of the
control variables. We have also added the share of population older than 65, as older people have
been disproportionally affected by covid‐19. The specification takes the following form
Model 3:
where stands for the control variable whose nonlinearity is being tested and we allow for
nonlinearity in more control variables.
ECB Working Paper Series No 2478 / October 2020 14Fourth, given that our data is collected with reference to provinces, which can be measured as
points in space, we consider also spatial variables. The concern addressed here is that the
relationship between covid‐19 and the control variables may be entirely explained by the
proximity with the epicentre of the contagion. For instance in Italy, one of the worst hit regions
was Lombardy, a region with a high share of energy‐intensive landscape. It is reasonable to
suspect that neighbouring provinces may have been more exposed to covid‐19 than those further
away, as our Figure 1 visually confirms. Spatial information can be incorporated in numerous
ways. There is a large literature on spatial econometrics discussing alternative parsimonious
specifications (see Le Sage 1999, for a comprehensive review). Spatial econometrics can be quite
involved, requiring non‐standard estimation techniques, due to the endogeneity of the dependent
variables (see Le Sage 2008, for a recent review). In this paper, we adopt a simple approach which
makes direct use of the latitude‐longitude coordinates associated with the provinces included in
our analysis. Denoting with and the spatial coordinates of a province (where m stands for
meridian and p for parallel), we compute the Euclidean distance from the province of Bergamo as
, where , denote the coordinates of Bergamo. We chose
Bergamo as reference point, as it was the worst hit province of Italy. We then augmented the
model with this distance as an additional variable:
Model 4:
where again stands for the generic control variable.
Since the number of possible regressors can be very large and we have a relatively small sample of
observations, we use the Akaike Information Criterion (AIC) and the adjusted for model
selection purposes. The best model minimises the AIC and maximises the adjusted .
3. Results
All the results of our econometric analysis are reported in Table 3, which is structured as follows.
The dependent variable is always COVID, while the control variables used in the analysis are
reported in the first column on the left. Although many alternative specifications have been
estimated, we report in this table only six of them, labelled in the first row according to the model
typology. For each coefficient, we report the ordinary least square (OLS) value, with the robust
standard errors in parenthesis. Statistical significance at 1%, 5% and 10% levels is denoted by
ECB Working Paper Series No 2478 / October 2020 15three, two and one star respectively. Coefficients without stars are not statistically significant at conventional confidence levels. The last two rows of the table report the AIC and adjusted R2. The simplest possible specification is Model 1. The coefficient associated with the non‐intensive landscape areas is negative (‐0.29) and statistically significant at 1%. The interpretation is that provinces with a higher share of non‐intensive landscape areas tend to have lower cases of covid‐ 19. Taken at face value, this result says that if one were to increase C and D areas by 10%, one should on average observe 2.9 less covid‐19 cases per 10,000 inhabitants (=0.29*10). Since the average number of overall covid‐19 cases is 34 per 10,000 inhabitants (see Table 1), this corresponds to almost a 10% decrease. The result is therefore not only statistically significant, but also economically meaningful. Model 2 includes various control variables to provide a first check that the negative correlation found so far is not spurious. Adding demographic, economic and health data substantially increases the fit of the model, as can be seen by the adjusted jumping from 0.08 to 0.50. Adding these controls reduces by about a half the coefficient associated with the non intensive areas (‐0.15), which however remains significant at the 10% level. Of the control variables, only the levels of pollution and unemployment appear to be statistically significant, implying that provinces with higher levels of pollution and lower levels of unemployment tend to be more affected by covid‐19. This result is intuitive and consistent with the punchline of this paper: more energy intensive areas tend to be more polluted and characterised by lower levels of unemployment. The result of this regression says that the landscape composition of the provinces continues to be negatively correlated with covid‐19 infection rates over and above their levels of pollution and economic activity. Under Model 2A, we have selected the variables which minimise the AIC, a standard way to perform model selection in econometrics. Although we have not performed a systematic search across all possible model specifications, Model 2A improves over Model 2, as can be seen by the lower AIC and higher adjusted . Our coefficient of interest, C+D, remains negative and statistically significant at 10%. Model 3 considers robustness to non linearities. We have added square and quadratic terms of some of the control variables (age, density and pollution), as well as the share of inhabitants over 65. The coefficient associated with the non intensive areas is still negative and with a higher statistical significance (it is now significant at 1%). Model 3A optimises the non linear variables using the AIC criterion. We notice that the fit of this non linear model is not as good as that of Model 2A. ECB Working Paper Series No 2478 / October 2020 16
Finally, Model 4 addresses non linearities by taking into account spatial dependence by adding the
distance of each provice from Bergamo as explanatory variable. The distance is significant and
with the expected negative sign: provinces further away from Bergamo tend to have lower rates
of covid‐19 infection. Results (not reported here) are robust to breaking the measure in short and
long distances. Although statistically significant, adding the distance increases the fit of the model
only marginally, since the AIC and adjusted       are only slightly better than those of Model 2A (the
numbers are identical, as the improvement is at the level of the third decimal). More importantly
for the discussion of this paper is that the coefficient associated with C+D is still negative and still
statistically significant.

Overall, we can conclude that our econometric analysis points to a robust relationship between
the composition of the Italian rural landscape and covid‐19 infection rates. One important caveat
is that correlation does not imply causation. Many other factors, not considered in our analysis,
may be responsible for this correlation. For instance, these regions are also characterised by
colder temperatures and higher humidity levels, which in turn may be correlated with the share of
energy‐intensive areas and exposure to covid‐19. More research is needed to shed light on the
true causal links behind our findings.

    4. Discussion

The COVID‐19 pandemic has led to the publication of numerous articles in many fields of study.
The most analysed topics are related to the economic impact of the pandemic on the agricultural
market, both from a global point of view (Elleby et al. 2020) or from a local point of view (Villulla
2020, AA. VV. 2020, Kumar et al. 2020), including articles considering food production (Torero
2020). Some studies have also linked the expansion of the intensive agriculture to the increasing
insurgence of the zoonotic infection like the COVID‐19, underlying the consequence of the
deforestation process that reduces the distance between the humankind and the wild animals
(Baudron and Liégeois 2020). There are studies investigating the spatial and temporal distribution
of the infection, but without taking into account the type of agricultural landscape (Xie et al. 2020,
Kuebart and Stabler 2020). The attempt of this research is to offer another point of view, crossing
the spatial distribution of the infection with the type of agricultural landscape, in order to find a
possible correlation between the spread of the virus and the intensity level of the agricultural
landscape.

ECB Working Paper Series No 2478 / October 2020                                                      17
From this point of view, our empirical analysis reveals the presence of a strong negative correlation between less energy‐intensive landscapes and covid‐19. These results are confirmed by a more formal regression analysis and are robust to a variety of controls, such as demographic, economic, health and environmental variables, as well as potential non linearities and spatial dependence. The results are even more striking if one considers that the population of less energy‐intensive provinces is on average older and according to the most recent medical research more vulnerable to the virus (Williamson et al. 2020). The ultimate causes behind the strong negative correlation remain unknown and more research is needed on an international scale to confirm the statistical results of this paper and to find possible scientific explanations. What is certain is that energy‐intensive areas are also more vulnerable to pollution by nitrates, methane and emissions of nitrous oxide (Houser et al. 2020) and they are also contributing to ecosystem simplification, loss of ecosystem services and species extinctions (Tilman et al. 2001). Independently of whether there is a causal link between pollution and covid‐ 19, incentives for a more sustainable agriculture are needed to meet the demands of improving yields without compromising environmental integrity or public health (Tilman et al. 2002). The presence of the strong correlation between energy‐intensive landscapes and contagion unearthed in this paper should provide an additional rationale for the scientific and political communities to rethink the relationship between humans and their territory. From the environmental point of view, the potential of low‐energy agriculture should be acknowledged by policy‐makers and the general public, as already suggested in the past (Bignal and McCracken 1996). Protecting European landscapes and biotopes of high natural conservation value requires low‐intensity farming. Maintaining farmers in rural areas would contribute to reducing hydrogeological risk and the loss of fertility due to the abandonment of traditional agricultural practices (Agnoletti et al. 2019). It would also foster sustainable quality food resources, one of the most important assets of the Italian rural economy (ISMEA 2018), and reduce the tendency to import raw material from abroad. Most of this farmland has little political clout, with decisions often shaped by farm businesses lobbying at European and national levels. The positive externalities associated with the conservation and correct management of the landscape resources should weigh in the economic assessment of rural development strategies. This discussion is intimately linked to the broader issue of which actions are best suited to help the Italian economy emerging from the severe recession triggered by the pandemic. Many economists think that the most expansionary fiscal policy at the current juncture is investment in health ECB Working Paper Series No 2478 / October 2020 18
research, because until a cure is available, people continue to be afraid to resume their normal
life. Even if large subsidies are granted to sustain their livelihood, chances are that they will go
unspent because they are paralyzed with fear (Summers 2020). From this perspective, policies
aimed at returning people back to rural areas, to the extent that they reduce contagion and inject
confidence, have a fiscal expansionary element which should be taken into account when
performing a cost‐benefit analysis. This holds true not only in the current circumstances but
especially in the light of future pandemics, suggesting different policies for the different parts of
the territory.

People have moved out of rural areas for a variety of reasons. They will not go back unless proper
incentives are provided. We highlight three main avenues. First, the next EU Common Agricultural
Policy 2021‐2028 should promote a sustainable development of less energy‐intensive areas, aimed
at reducing or reverting the depopulation of these territories. The main objective should be to
identify opportunities based on the specific unique resources of these areas rather than trying to
make them function in the same way as “mainstream industrialized regions” (ESPON 2020).
Second, larger investments in information and communication technology (ICT) are fundamental
for these regions. The percentage of agricultural firms using ICT stands at only 3.8% and is
concentrated (54% of the total) in northern Italy (ISTAT 2014). Third, access to healthcare, welfare
and education services can be drastically improved by more general digitalisation. Faster internet
connections should be considered as a basic public service.

    5. Conclusions

Italians living in less energy‐intensive landscapes are less exposed to covid‐19. Less energy‐
intensive landscapes have an average of 49 infected per square kilometre and 28 per 10.000
inhabitants, compared to 134 per square kilometre and 37 per 10.000 inhabitants in more energy‐
intensive zones. These results are confirmed by a more formal regression analysis and are robust
to a variety of controls.

The payoffs for the country to revitalize rural areas can be large, paving the way to a more
sustainable development model, valorizing landscape and local economic resources (ISTAT 2016).
The findings of this paper add another payoff, potentially the largest of all: making the population
more resilient to the current and future pandemics. Not everybody will be inspired as Boccaccio to
produce a timeless masterpiece, but a more harmonious and balanced relationship with our

ECB Working Paper Series No 2478 / October 2020                                                   19
environment will surely help our society to better cope with the unknown ahead of us, including socio‐economic and enviromnmental challanges. Literature Agnoletti M. (2013). Italian historical rural landscapes; dynamics, data analysis and research findings. In: Agnoletti M. (ed.) The Italian Historical Rural Landscape. Cultural values for the environment and rural development, Springer Verlag, Dordrecht. 3‐88. Agnoletti M. (2014). Rural landscape, nature conservation and culture: Some notes on research trends and management approaches from a (southern)European perspective, Landscape and Urban Planning. 126, 66‐73. Agnoletti M., Errico A., Santoro A., Dani A., & Preti F. (2019). Terraced landscapes and hydrogeological risk. Effects of land abandonment in Cinque Terre (Italy) during severe rainfall events, Sustainability, 11, 235. Anastassopoulou C., Russo L, Tsakris A., & Siettos C. (2020). Data‐based analysis, modelling and forecasting of the COVID‐19 outbreak. PLOS ONE, March 31. Antrop M. (1997). The concept of traditional landscapes as a base for landscape evaluation and planning: the example of Flanders Region. Landscape and Urban Planning 38, 105–117. Arauzo M., Valladolid M., & Martinez‐Bastida J.J. (2011). Spatio‐temporal dynamics of nitrogen in river‐alluvial aquifer systems affected by diffuse pollution from agricultural sources: Implications for the implementation of the Nitrates Directive. Journal of Hydrology Vol 411, 1‐2, 155‐168. Baudron F. & Liégeois F. (2020). Fixing our global agricultural system to prevent the next COVID‐ 19. Outlook on Agriculture, 49(2), 111–118. https://doi.org/10.1177/0030727020931122 ECB Working Paper Series No 2478 / October 2020 20
Barbera G. & Cullotta S. (2016). The Traditional Mediterranean Polycultural Landscape as Cultural
Heritage: Its Origin and Historical Importance, Its Agro‐Silvo‐Pastoral Complexity and the Necessity
for Its Identification and Inventory. In Agnoletti M., Emanueli F. (eds), Biocultural Diversity in
Europe. Environmental History, vol 5. Springer, Cham.

Bignal E. M. & McCracken D. I. (1996). Low‐intensity farming systems in the conservation of the
countryside. Journal of Applied Ecology 33, 413–424.

Burt T. P., Pinay G., & Sabater S. (2010). Riparian Zone Hydrology and Biogeochemistry. IAHS Press,
Oxfordshire.

De Rubertis S. (2019). Dinamiche insediative in Italia: spopolamento dei comuni rurali. In Cejudo
E. & Navarro F. (eds), Despoblación y transformaciones sociodemográficas de los territorios
rurales: los casos de España, Italia y Francia. Perspectives on rural development, 3. 71‐96.

Elleby C., Domínguez I. P., Adenauer M., & Genovese G. (2020). Impacts of the COVID 19
Pandemic on the Global Agricultural Markets, Environmental and Resource Economics.
https://doi.org/10.1007/s10640‐020‐00473‐6

ESPON (2018). Fighting rural depopulation in Southern Europe, ESPON EGTC, Luxembourg.

Fischer J., Hartel T., & Kuemmerle T. (2012). Conservation policy in traditional farming landscapes.
Conservation Letter 5, 167–175.

Erb K.H, Haberl H., Jepsen M. R., Kuemmerle T., Lindner M., Mueller D., Verburg P. H., & Reenberg
A. (2013). A conceptual framework for analysing and measuring land‐use intensity. Current
Opinion, Environmental Sustainability, 5: 464–470.

Estel S., Kuemmerle T, Levers C., Baumann M., & Hostert P. (2016). Mapping cropland‐
use intensity across Europe using MODIS NDVI time series. Environmental Research letters, 11(2).

ECB Working Paper Series No 2478 / October 2020                                                  21
Houser M., Gunderson R., Stuart D, & Riva C.H.D. (2020). How farmers "repair" the industrial
agricultural system, Agriculture and Human values, March.

Isselstein J. (2003). Erhaltung und Foerderung der Pflanzenartenvielfalt auf dem Gruenland aus
landwirtschaftlicher Sicht. Nova Acta Leopoldina NF 87/328, 99–111.

Kuebart A., & Stabler, M. (2020). Infectious Diseases as Socio‐Spatial Processes: The COVID‐19
Outbreak In Germany. Tijds. voor econ. en Soc. Geog., 111: 482‐496.
https://doi.org/10.1111/tesg.12429

Tieskens K. F., Schulp C. J. E., Levers C., Lieskovsky J., Kuemmerle T., Plieninger T., & Verburg P. H.
(2017). Characterizing European cultural landscapes: Accounting for structure, management
intensity and value of agricultural and forest landscapes. Land Use Policy 62, 29–39.

ISTAT, FUB, (2014). Internet@Italia 2014, l’uso di internet da parte di cittadini ed imprese, ISTAT,
Roma.

ISMEA (2018). Rapporto sulla competitività dell’agroalimentare italiano, ISMEA, Roma.

ISTAT (2016). Le aziende agriturstiche in Italia, Report 2015, ISTAT, Roma.

ISTAT (2018) L’evoluzione demografica in Italia dall’Unità a oggi, Roma.

Ladrera R., Belmarid O., Tomas R., Prat N., & Canedo‐Arguelles M. (2019). Agricultural impacts on
streams near Nitrate Vulnerable Zones: A case study in the Ebro basin, Northern Spain. PLOS ONE,
Vol 14, 1.

ECB Working Paper Series No 2478 / October 2020                                                     22
Levers C., Müller D., Erb K., Haberl H., Jepsen R., Metzger M.J., Meyfroidt P., Plieninger T., Plutzar
C., Stürck J., Verburg P.H., Verkerk P.J., & Kuemmerle T. (2018). Archetypical patterns and
trajectories of land systems in Europe. Regional Environ Change 18, 715–732.

LeSage J. (1999). The theory and practice of spatial econometrics, University of Toledo, Ohio.

LeSage J. (2008). An Introduction to Spatial Econometrics. Revue d'économie industrielle, 123(3),
19‐44.

Yuan J.J., Lu Y.L., Cao X.H., & Cui H. T. (2020), Regulating wildlife conservation and food safety to
prevent human exposure to novel virus. Ecosystem health and sustainability, 6, 1.

Macdonald D., Crabtree J.R., Wiesinger G.; Dax T., Stamou N., Fleury P., Gutierrez Lazpita J., &
Gibon A. (2000). Agricultural abandonment in mountain areas of Europe: Environmental
consequences and policy response. Journal of environmental management 59, 47–69.

Marull J., Font C., Padrò R., Tello E., & Panazzolo A. (2016). Energy Landscape Integrated Analysis:
A proposal for measuring complexity in internal agroecosystem processes (Barcelona Metropolitan
Region, 1860‐2000). Ecological Indicators 66. 30‐46.

Sanderson M.R. (2020), Here we are: Agriculture and Human values in the Corona Virus (COVID‐
19) pandemic, Agricultural and human values.

ONPR (Osservatorio Nazionale del Paesaggio Rurale) (2018), Primo Rapporto sullo Stato del
Paesaggio Rurale, Ministero delle Politiche Agricole Alimentari e Forestali, Roma , Settembre 2018.
(https://www.reterurale.it/flex/cm/pages/ServeBLOB.php/L/IT/IDPagina/18583).

Overmars K.P., Schulp C.J.E., Alkemade R., Verburg P.H., Temme A.J.A.M., Omtzigt N., &
Schaminée J.H.J. (2014). Developing a methodology for a species‐based and spatially explicit
indicator for biodiversity on agriculturalland in the EU. Ecological Indicators 37, 186–198.

ECB Working Paper Series No 2478 / October 2020                                                    23
Plieninger T., Höchtl F., & Spek T. (2006). Traditional land‐use and nature conservation in
European rural landscapes. Environmental Science & Policy 9. 317–321.

Rega C., Shortb C., Pérez‐Sobaa M., & Paracchini M.L. (2020). A classification of European
agricultural land using an energy‐based intensity indicator and detailed crop description,
Landscape and Urban Planning 198, 103793.

Summers, L. (2020). Given what we’re losing in GDP, we should be spending far more to develop
tests, The Washington Post, 6 May.

Tello E., Galan E., Sacristan V., Cunfer G.I., Guzmán G.I., González de Molina M., Krausmann F.,
Gingrich S., Padró R., Marco I., & Moreno‐Delgado D., (2016). Opening the black box of energy
throughputs in agroecosystems: a decomposition analysis of final EROI into its internal and

external returns (the Vallจจs County Catalonia, c.1860 and 1999). Ecological Economics 121, 160‐

174.

Torero M. (2020). Without food, there can be no exit from the pandemic, Nature, Vol 850, April.

Temme A.J.A.M., & Verburg P.H. (2011). Mapping and modelling of changes inagricultural intensity
in Europe. Agriculture, Ecosystems & Environment 140, 46–56.

Tilman D., Cassman K.G., P.A., Matson P. A., Naylor R., & Polasky S. (2002). Agricultural
sustainability and intensive production practices. Nature 418, 671–677.

Tilman D., Fargione J., Wolff B., D'Antonio C. Dobson A., Howarth R., Schindler D., Schlesinger
W.H., Simberloff D., & Swackhamer D. (2001). Forecasting agriculturally driven global
environmental change. Science, Vol. 292, Issue 5515, pp. 281‐284.

ECB Working Paper Series No 2478 / October 2020                                                   24
van der Zanden E. H., Levers C., Verburg P. H., & Kuemmerle T. (2016). Representing composition,
spatial structure and management intensity of European agricultural landscapes: A new typology.
Landscape and Urban Planning, 150, 36–49. https://doi.org/10.1016/j.landurbplan.2016.02.005

Villulla J.M. (2020) COVID‐19 in Argentine agriculture: global threats, local contradictions and
possible responses. Agric Hum Values 37, 595–596 (2020). https://doi.org/10.1007/s10460‐020‐
10096‐8

Xie X., Naminse E.Y., Liu S., & Yi Q. (2020) The spatial and temporal pattern of COVID‐19 and its
effect on humans’ development in China, Global Journal of Environmental Science and
Management. https://doi.org/10.22034/GJESM.2019.06.SI.10

Weersink, A., von Massow, M., & McDougall, B. (2020). Economic thoughts on the potential
implications of COVID‐19 on the Canadian dairy and poultry sectors, special issue on Canadian
Journal of Agricultural Economics/Revue canadienne d'agroeconomie, vol 68 (2). 2020. DOI:
https://doi.org/10.1111/cjag.12240

White H. (1980). A Heteroskedasticity‐Consistent Covariance Matrix Estimator and a Direct Test
for Heteroskedasticity. Econometrica 48 (4): 817–838.

Williamson E., Walker A.J., et al. (2020). OpenSAFELY: factors associated with COVID‐19‐related
hospital death in the linked electronic health records of 17 million adult NHS patients. medRxiv.
doi: https://doi.org/10.1101/2020.05.06.20092999

Wu X., Nethery R.C., Sabath B.M., Braun D., & Dominici F. (2020). Exposure to air pollution and
COVID‐19 mortality in the United States. medRxiv.04.05.20054502;

ECB Working Paper Series No 2478 / October 2020                                                     25
You can also read