2019 UPDATE ON THE ESTIMATION OF THE METHANE AND HELIUM RESERVES OF THE TETRA4 VIRGINIA GAS FIELD IN THE FREE STATE OF THE REPUBLIC OF SOUTH ...
←
→
Page content transcription
If your browser does not render page correctly, please read the page content below
730 17th St, Suite 410
                                                     Denver, CO 80202 USA

                                                  Phone: 01 303 277 0270
                                               Email: jaldrich@mhausa.com
                                                           www.mhausa.com

Independent Reserve and Resource Evaluation Report

2019 U PDATE ON THE E STIMATION
OF THE M ETHANE AND H ELIUM
R ESERVES OF THE T ETRA 4 V IRGINIA
G AS F IELD IN THE F REE S TATE OF
THE R EPUBLIC OF S OUTH A FRICA

Renergen Limited

Prepared for: Mr. Stefano Marani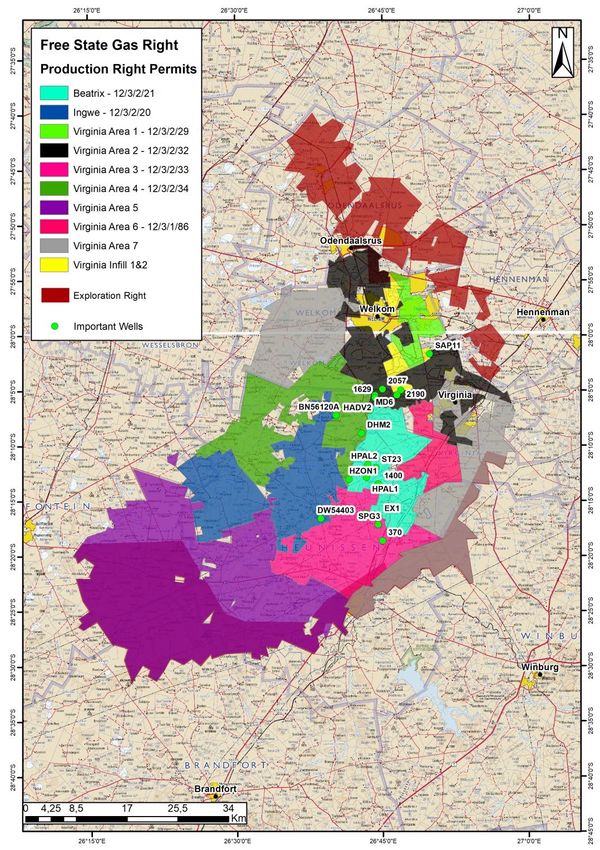
March 01, 2019

Mr. Stefano Marani
Chief Executive Officer
Renergen Limited
1 Bompas Road
Dunkeld West
Johannesburg, 2196
Republic of South Africa

Re: AN UPDATE ON THE ESTIMATION OF METHANE AND HELIUM RESERVES AND
RESOURCES AND ASSOCIATED ECONOMICS OF THE TETRA4 VIRGINIA GAS FIELD IN
THE FREE STATE OF THE REPUBLIC OF SOUTH AFRICA

Dear Mr. Marani:

At the request of Renergen Limited (Renergen), MHA Petroleum Consultants (MHA) has
conducted an update to its March 2018 independent assessment of the unconventional methane
and helium reserves and resources in the Tetra4 Virginia Gas Field, located in the Free State of
the Republic of South Africa. This evaluation is primarily an economic update, based on the
analysis methodology described herein using technical and economic data supplied by Tetra4,
has an effective date of March 1, 2019. Material changes to this report are the inclusion of the
HDR-1 well as a Proved Developed Producing well, updated CAPEX and OPEX costs, updated
currency exchange rates, and an updated field development plan. Ongoing work by Tetra4 that
may have a positive future impact that is discussed within this report includes the evaluation of a
shallow conventional “White Sandstone” play, increased evaluation and definition of the helium
market, and future potential of the South Africa liquid fuels market.

This evaluation includes estimates of recoverable methane and helium volumes from Proved
Developed Non-Producing wells (PDNP’s), Proved Undeveloped locations (PUDs), total proved,
probable, and possible reserves. MHA has now added the HDR-1 well as a Proved Developed
Producing reserve (PDPs) due to the established history of production and sales of gas to the
Megabus fleet. Associated pre-tax net present value of future income for selected discount rates
are presented for Reserves volumes. MHA has estimated the volumes of Contingent Resources,
those volumes of gases that are discovered but are not yet considered commercially viable for
extraction due to one or more contingencies. MHA has also estimated the volumes of Prospective
Resources, those volumes of gases that are undiscovered, but the likelihood of their existence
can be estimated. Prospective Resources thus carry significant exploration risk. All Prospective
Resources volumes presented in this report are un-risked. The estimates of reserves and future
net revenue for individual properties may not reflect the same confidence level as estimates of
reserves and future net revenue for all properties, due to the effects of aggregation. Further,
estimates of Net Present Value, either discounted or undiscounted, are a calculation of the
reserve value at a given date and are not a representation of the fair market value of the company
or corporation owning working interest in the project.

Renergen | April 24, 2019                                                                  Page | 2

Resource and reserve estimates and associated economics contained in this report are prepared
in accordance with the Society of Petroleum Engineers (SPE) Petroleum Resources Management
(PRMS) guidance and provides a Technical Value, defined as an assessment of a mineral asset’s
future net economic benefit at the valuation date under a set of assumptions deemed most
appropriate by a practitioner excluding any premium or discount to account for market
considerations. These estimates are aligned with the Australian Stock Exchange (ASX) rules in
conjunction with the SPE PRMS guidance and specific additional rules. Our evaluation based
upon data supplied by Tetra4, supplemented where necessary by MHA’s corporate awareness of
current South African industry costs and best practices.

RESERVE AND RESOURCE ESTIMATES
The reserve and resource estimates presented in this report have been prepared for publication
in both South Africa under the SAMOG regulatory guides and Australia using an evaluation
approach for unconventional resources consistent with Society of Petroleum Engineers
Petroleum Resources Management System (SPE PRMS) 2018 and the SPE 2011 PRMS
guidelines (attached). The reserve and resource estimates contained in this report have been
prepared as of March 1st, 2019 and are generated from the data supplied to MHA from Tetra4.
Sustained commercial sales of methane gas from pilots located on the Tetra4 licenses and
periodic measurements of the free flow gas volumes from multiple blowers, some producing for
decades, allow estimation of the gas production decline rate and thus ultimate recoverable
volumes of gas.

Estimated net methane and helium reserves and net present values at Tetra4 specified discount
rates are summarized in Table 1. For the purposes of clarification the use of the abbreviation ‘M’
equates to millions throughout this text and the abbreviation of ‘m’ equates to thousands.

Renergen | April 24, 2019                                                                 Page | 3
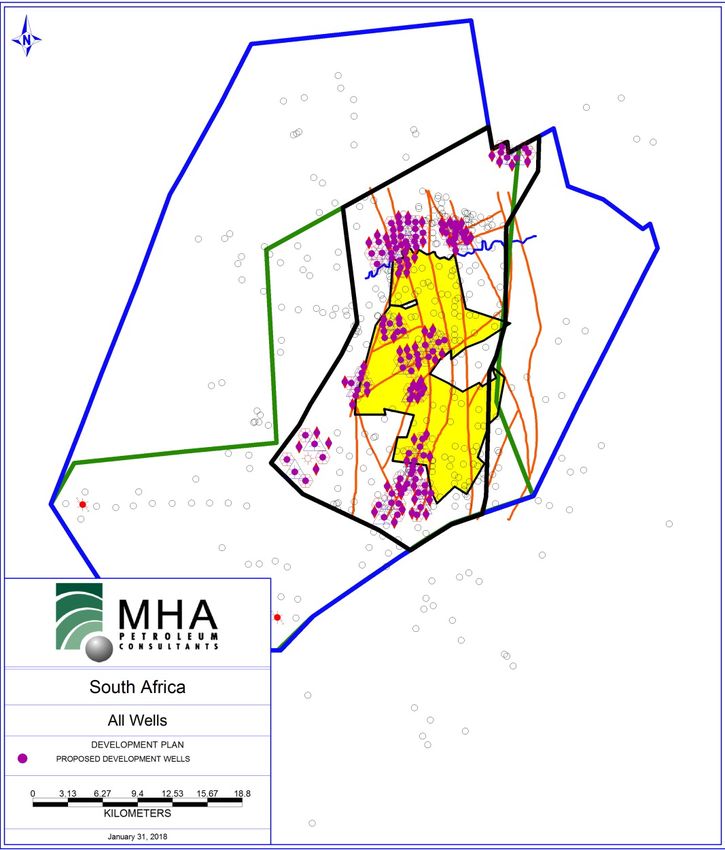
Table 1: Summary of Methane and Helium Net Gas Reserves and Net Present Values at
                              Selected Discount Rates

                       Virginia Gas Project – Specified Prices and Costs

                                                                                   Proved+
                                             Total              Proved
                                                                                  Probable+
                    PDP     PDNP    PUDs    Proved    Probable +Probable Possible
                                                                                   Possible
                                             (1P)                 (2P)
                                                                                     (3P)
  Methane
                      .89   13.29   26.57     40.76     98.23      138.99    145.18      284.18
  (BCF)

  Helium (BCF)        .03    0.33    0.65      1.01      2.39        3.41      3.45        6.86
                                                                      Net Present Value (MZAR)
  Undiscounted       466    6,462 13,440    17,069     50,367      64,477    75,065    135,196
           5%        231    3,471 5,820      7,995     20,988      27,754    30,430      56,387
           8%        172    2,580 4,049      5,599     14,369      19,059    20,481      38,224
          10%        146    2,170 3,303      4,541     11,620      15,375    16,376      30,624
          15%        106    1,502 2,175      2,878      7,516       9,788    10,301      19,242
          20%         83    1,113 1,562      1,945      5,318       6,758     7,092      13,162
          30%         58      695    934       978      3,104       3,699     3,929       7,127

Unrisked net Contingent Resources were calculated from the technically recoverable gas volumes
for each type well multiplied by the number of locations in the portion of the Virginia Gas Field
classified as Contingent Resources and, in the case of helium, multiplied by a constant helium
content of 3%. These gas volumes were combined with the same prices and costs used for
estimating Reserves to obtain the net Contingent Resources in Table 2 below.

Renergen | April 24, 2019                                                                Page | 4
Table 2: Summary of Net Methane and Helium Contingent Resources
                       Virginia Gas Field – Specified Prices and Costs

           Category
                                Low Case (C1)         Best Case (C2)              High Case (C3)
   Contingent Resources
          (BCF)
 Methane                             237.3                435.9                       648.5

 Helium                               7.9                  14.4                        20.9

Unrisked gross Prospective Resources (Table 3) were calculated volumetrically as the technically
recoverable gas volumes for each type well multiplied by the number of locations in that portion
of the Virginia Gas Field classified as Prospective Resources. No economics were calculated for
methane Prospective Resources, and no helium Prospective Resources were estimated as part
of this work.

                 Table 3: Summary of Gross Methane Prospective Resources
                                     Virginia Gas Field

           Category

   Prospective Resources           Low Case             Best Case                   High Case
           (BCF)

 Methane                              640                 1,278                       2,069
PROSPECTIVE RESOURCES: The estimated quantities of petroleum that may potentially be recovered
by the application of a future development project(s) relate to undiscovered accumulations. These
estimates have both an associated risk of discovery and a risk of development. Further exploration
appraisal and evaluation is required to determine the existence of a significant quantity of potentially
moveable hydrocarbons.”

Renergen | April 24, 2019                                                                          Page | 5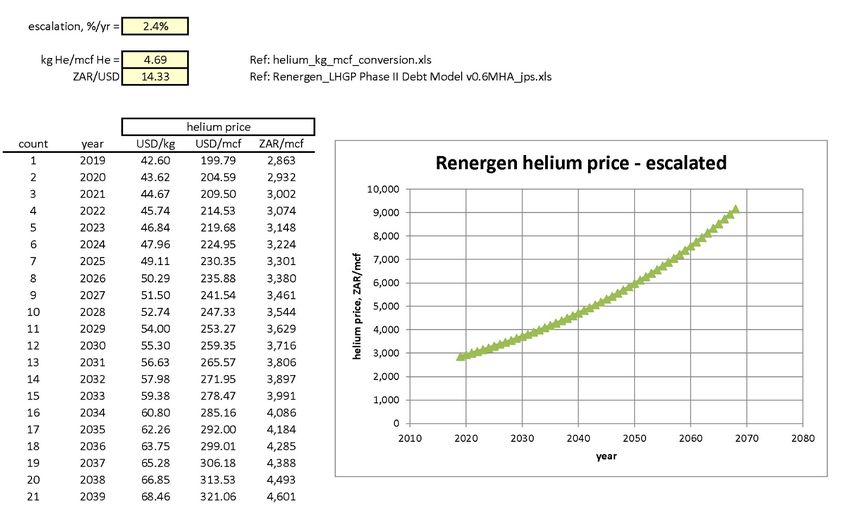
STATEMENT OF RISK
The accuracy of resource, reserve, and economic evaluations is always subject to uncertainty.
The magnitude of this uncertainty is generally proportional to the quantity and quality of data
available for analysis. As a prospect, project, or well matures and new information becomes
available revisions may be required which may either increase or decrease the previous
estimates. Sometimes these revisions may result not only in a significant change to the reserves
and value assigned to a property, but also may impact the total company reserve and economic
status. The resources, reserves and economic forecasts contained in this report were based
upon a technical analysis of the available data using accepted geoscience and engineering
principles. However, they must be accepted with the understanding that further information and
future reservoir performance subsequent to the date of the estimate may justify their revision. It
is MHA’s opinion that the estimated resources, reserves, economics, and other information as
specified in this report are reasonable, and have been prepared in accordance with generally
accepted geoscience and petroleum engineering and evaluation principles. Notwithstanding the
aforementioned opinion, MHA makes no warranties concerning the data and interpretations of
such data. In no event shall MHA be liable for any special or consequential damages arising from
Renergen’s use of MHA’s interpretation, reports, or services produced as a result of its work for
Renergen. Neither MHA, nor any of our employees have any interest in the subject properties
and neither the employment to do this work, nor the compensation, is contingent on our estimates
of the resources or economic evaluations for the properties in this report. This report was
prepared for the exclusive use of Renergen and will not be released by MHA to any other parties
without Renergen’s written permission (other than the stated purpose set out above). The data
and work papers used in this preparation of this report are available for examination by authorized
parties in our offices.
Thank you for this opportunity to be of service to Renergen. If you have any questions or wish to
discuss any aspect of the report further, please feel free to contact me.

Sincerely,

Jeffrey B. Aldrich

Partner
MHA Petroleum Consultants

John P. Seidle

Partner
MHA Petroleum Consultants

Renergen | April 24, 2019                                                                  Page | 6
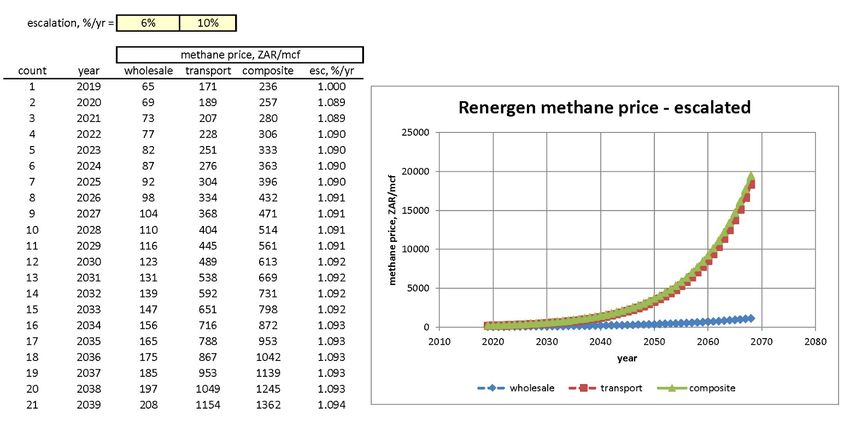
TABLE OF CONTENTS
Background................................................................................................................................ 9
Geology ....................................................................................................................................11
   Regional Geology ..................................................................................................................11
Existing Wells and Production History .......................................................................................15
   Historic Wells.........................................................................................................................15
   Evaluated Wells.....................................................................................................................15
Methodology .............................................................................................................................17
      Data Set .............................................................................................................................17
      Analysis .............................................................................................................................17
Volumetrics ...............................................................................................................................18
   Past Studies ..........................................................................................................................18
      2017 Assessment ..............................................................................................................19
      2019 Assessment ..............................................................................................................20
Economics ................................................................................................................................28
   Tetra4 Operating Conditions and Sales Agreements .............................................................28
Economic Parameters ...............................................................................................................31
Reserve Economics ..................................................................................................................34
Contingent Resource Economics ..............................................................................................35
Conclusions ..............................................................................................................................36
Qualifications ............................................................................................................................37
Bibliography ..............................................................................................................................38
Appendix 1: Methane and Helium Prices...................................................................................39
Appendix 2: Petroleum Resources Management System ..........................................................40
Appendix 3: Well Database .......................................................................................................71
Appendix 4: Tetra4 Pricing Forecast March 2019......................................................................72
      Methane Price Calculation .................................................................................................72
      Methane Escalated Price Calculation .................................................................................73
      Helium Escalated Price Calculation....................................................................................73
      Methane and Helium Prices ...............................................................................................74
Appendix 5: Abbreviations ........................................................................................................76

Renergen | April 24, 2019                                                                                                         Page | 7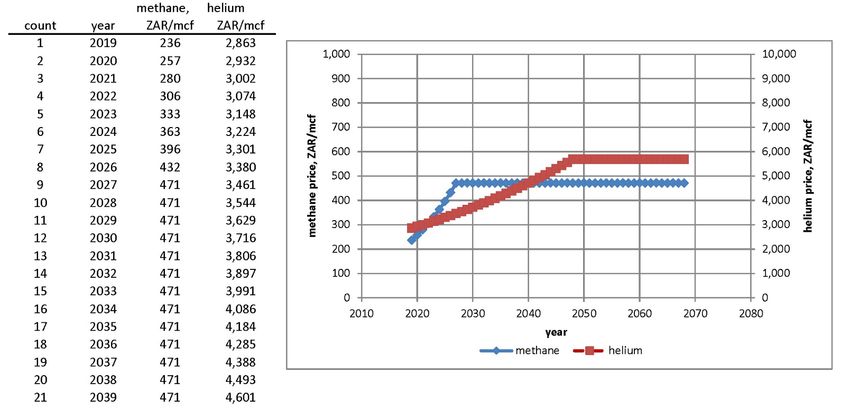
Appendix 6: SAMOG Form A…………………………………………………………….…………….81

TABLE OF FIGURES
Figure 1: Location Map .............................................................................................................. 9
Figure 2: Permit Map.................................................................................................................10
Figure 3: Regional Geologic Map of the surface geology. .........................................................12
Figure 4: Map of Known Rand Group Faults .............................................................................13
Figure 5: West to East Cross-Section within the area of the Virginia Gas Project......................14
Figure 6: Map of the Tetra4 well Control ...................................................................................16
Figure 7: Enlargement of the primary development area ...........................................................17
Figure 8: Idealized Spacing of New Field Development Wells ...................................................21
Figure 9: Typical Spacing of Field Development Wells Influenced by Faults .............................22
Figure 10: Map Proved, Probable and Possible well locations .................................................23
Figure 11: Map of Helium Concentration in % ...........................................................................27
Figure 12: Map Tetra4 Virginia Gas License and Current Plus Planned Wells ..........................30
Figure 13: HDR-1 decline curve ................................................................................................31
Figure 14: Methane and Helium Monthly Prices ........................................................................33

TABLE OF TABLES
Table 1: Summary of Methane and Helium Net Gas Reserves and Net Present Values at
         Selected Discount Rates ............................................................................................. 4
Table 2: Summary of Net Methane and Helium Contingent Resources ...................................... 5
Table 3: Summary of Gross Methane Prospective Resources ................................................... 5
Table 4: List of Existing Blowers (PDNP wells)..........................................................................18
Table 5: Technically Recoverable Methane Volume Estimates-Virginia Gas Field ....................24
Table 6: Technically Recoverable Contingent Methane Volume Estimates of the Virginia Gas
         Field ...........................................................................................................................24
Table 7: Technically Recoverable Prospective Methane Volume Estimates of the Virginia Gas
         Field ...........................................................................................................................25
Table 8: Technically Recoverable Helium Estimates of the Virginia Gas Project .......................28
Table 9: Technically Recoverable Helium Volume Estimates by Contingent Resource Category -
         Virginia Gas Field .......................................................................................................28
Table 10: Wellcount by Reserve and Contingent Resource Category .......................................33
Table 11: Gross and Net Methane and Helium Reserves ..........................................................34
Table 12: Virginia Gas Field – Methane and Helium Reserves..................................................35
Table 13: Net Methane and Helium Contingent Resources and Net Present Values .................36
Table 14: Virginia Gas Field - Gross and Net Methane and Helium Reserves and Contingent
          Resources .................................................................................................................36

Renergen | April 24, 2019                                                                                                       Page | 8
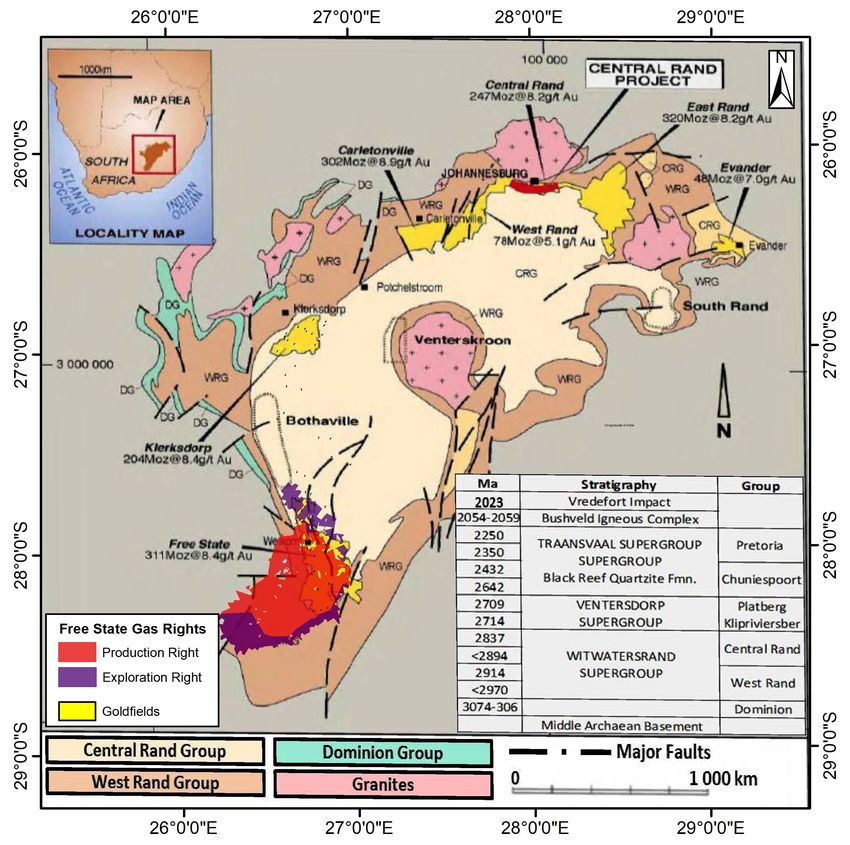
BACKGROUND
Renergen’s Tetra4’s South Africa Virginia gas project, which is located in the Free State, is
approximately 250 km southwest of Johannesburg. The exploration and production rights, which
combined are known as the Virginia Gas Project, covers a large area where gas emitting boreholes
have been identified from mineral exploration activities. Several of these boreholes are flowing gas
at high production rates and have been doing so for decades. Past studies have conducted a work
program which involved the cataloging and sampling of the gas emitting boreholes, a soil gas
geochemistry survey, and structural mapping. The gas emitting boreholes, or “blowers,” were drilled
by mining companies to explore for gold in Witwatersrand formations which underlie the coal-
bearing Karoo and Ventersdorp lavas. Some flowing wells were capped because of what was
regarded as dangerously high gas emission rates. Tetra4 now owns 100% working interest in
187,427.2189 hectares (Figure 1) that currently has 18 wells currently producing gas and 28 wells
that are known to have produced gas in the past but are now currently capped.

   Free State
   Gas Rights               Evander Gas
                               Rights

                                                                                      100 km

                                     Figure 1: Location Map

Renergen | April 24, 2019                                                                 Page | 9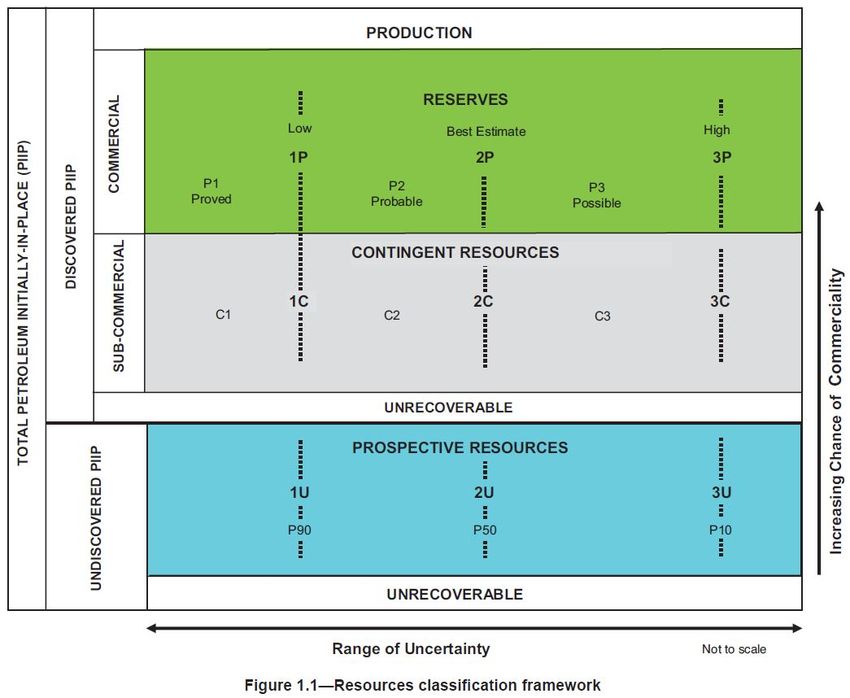
The Tetra4 Production License is subject to a 5% state tax plus an overriding royalty (ORRI) on
certain concurrent leases that are owned by GFI Mining South Africa (GFIMSA) of Goldfields. The
Goldfields ORRI is an additional 1% on top of the state tax on all wells and locations that are located
within the Goldfields mining leases. These two reductions in the revenue stream, the state tax, and
the GFIMSA ORRI, have been accounted for in the economic analysis.

                                     s

                                         Figure 2: Permit Map

Renergen | April 24, 2019                                                                  Page | 10
GEOLOGY REGIONAL GEOLOGY The Virginia Gas Field Project overlies Witwatersrand Precambrian age Supergroup of meta- sediments that host the Welkom Goldfield. These ‘basement’ lithologies have been tectonically flexed into a large north to south trending anticline that is in turn bisected by a large extensional graben (low area) and many large faults that extend deep into the earth’s crust. Uncomfortably overlying the Witwatersrand Supergroup is the Venterdorp Supergroup of primarily volcanic lithologies. Many of the larger faults do not extend beyond the upper Ventersdorp formations. After another large unconformity lies the Karoo Supergroup, a Permian aged sedimentary section composed of sandstones, coal seams and carbonaceous shales. There is often a basal glacial deposit on top of the unconformity that separates the Karoo from the Ventersdorp known as the Dwyka Tillite. The primary source of the Methane gas is primarily microbial in origin from deep within the Witwatersrand Supergroup with groundwater circulating through the large faults and coming in contact with bacteria living deep within the crust. Methane isotope studies demonstrate that very little, if any, of the methane can be attributed to the Karoo coal beds or the carbonaceous shales. Thus, the methane is a biogenic and a continuing renewable resource. Being a renewing resource conventional in-place, static, estimates of gas volumes are not applicable and the authors of this study have instead relied on pressure decline analysis. The helium, as with almost all helium around the world, is either mantle-derived, that is from deep within the earth or from decay of radioactive minerals within the crust, and as the helium moves up the large faults mixes with the microbial methane in the deep subsurface. The rate of recharge of the methane, and thus also the helium, gas is not known. There is anecdotal evidence of historic blowers within the Tetra4 license area producing methane gas for over forty years without any discernable pressure drop however there are no quantified studies to date. Renergen | April 24, 2019 Page | 11
Free State
                                       311Moz @ 4g/t

                    Figure 3: Regional Geologic Map of the surface geology.

          The Virginia Gas Project is annotated in the southwest corner of the map.

Renergen | April 24, 2019                                                        Page | 12
Free State Gas
Rights
N
C
b
a
Figure 4: Map of Known Rand Group Faults
The known gas wells are associated with the wells intersecting the faults that penetrate the
Witwatersrand Supergroup.
Renergen | April 24, 2019 Page | 13Stuirmanspan Fault De Bron Fault
a
MD5 HAK8
b Stuirmanspan Fault De Bron Fault
c Stuirmanspan Fault De Bron Fault
Figure 5: West to East Cross-Section within the area of the Virginia Gas Project
Demonstrating the tilted nature of the rock strata and the penetration of the faults into the
Witwatersrand Supergroup.
Renergen | April 24, 2019 Page | 14EXISTING WELLS AND PRODUCTION HISTORY HISTORIC WELLS There are nearly two thousand wellbores which have been drilled, either for water, mining assessment, or for disposal, across the Welkom District over the past several decades and many tens of these wells have naturally produced flammable gas and have been called “blowers.” Data from the South Africa Council for Geosciences lists at least 136 historic wells within the production area and notes that 68 of them produced gas in the past, 18 are currently producing gas (blowers), 29 have odors, and 28 are dormant. EVALUATED WELLS Twelve wells were evaluated for the original 2008 Molopo reserves evaluation study (Burning Flame, Burning Cross, Flame 1, ML-1, Retreat, Sand, SP-3, Squatter, DBE-1, Kotze EX-1, ST23, and Tewie). Molopo drilled three additional wells in 2009 (HADV1, HADV2, and HADR1). Tetra4 took over the project and drilled 4 wells in 2016 (MDR1, MDR4, MDR5 and 2057) and in 2017 reworked an older well that had resumed flowing gas (2190). For the 2019 update MHA has included a new well that Tetra4 drilled in 2018, the T4 WN 01, which was drilled to test a shallow conventional sandstone play, plus 12 historic wells or vents (AD1A, SH3, P7, W1, SP8, TR3, TR4, TR5, TR6, TR7, TR8, and AL4) that were described in the publication of Hugo, P.: “Helium in the Orange Free State Gold-Field” (1963) which documented these wells and vents as far back as 1957. Using the published data and on-site verifications, as possible, these wells were added to the Tetra4 database. The importance of this data is twofold, A) the new well opens an additional play for Tetra4 within the lease area and B) the data from the historic wells support both the longevity of the wells and the gas composition; including the high helium concentrations. Renergen | April 24, 2019 Page | 15
Figure 6: Map of the Tetra4 well Control. Yellow area is Goldfields Mining Area.

Renergen | April 24, 2019                                                          Page | 16
Figure 7: Enlargement of the primary development area

METHODOLOGY
Data Set
Tetra4 delivered to MHA driller’s logs, completion reports, LAS files, gas analysis reports, production
test data, and license data from the Virginia Gas Fields Project in the Free State in South Africa.

Analysis
MHA reviewed the well data, LAS files, gas analysis reports, production test data, and historical
geological data to ascertain the source of the gas, reservoir conditions, reservoir extents, Tetra4
development plans and market conditions.

Renergen | April 24, 2019                                                                  Page | 17
Table 4: List of Existing Blowers (PDNP wells)

                            Tetra4 Existing        CH4          He
                            Methane Producers      Producer     Producer
                            HDR 1                       X           X
                            BEI 02                      X           X
                            Burning Cross               X           X
                            EX 1                        X           X
                            Highpipe                    X           X
                            HZON 1                      X           X
                            MDR 5                       X           X
                            ML 1                        X           X
                            Retreat                     X           X
                            ST 23                       X           X
                            SPG 3 \ Lucky               X           X
                            Squatter                    X           X
                            Tewie-1400                  X           X
                            Burning Flame               X           X
                            DBE 1                       X           X
                            SP 3                        X           X
                            Flame 1                     X
                            Sand                        X
                            BN 56120A                   X           X
                            2190                        X           X

VOLUMETRICS

PAST STUDIES
Volumetric Assessments have been conducted by MHA Petroleum Consultants in 2008 and by
Venmyn-Deloitte in 2015 and 2016. The 2008 MHA study analyzed 12 existing blowers and
concluded that the best well annual decline rates ranged from 3 to 7% with an economic cutoff of
30,000 scf/day. Initial production rates ranged from a low of 150,000 scf/day to a high of 380,000
scf/day with a best case of 260,000 scf/day. The MHA study determined that the Estimated Ultimate
Recovery (EUR), on a per well basis of marketable gas, varied from a Low case of 0.9 BCF to a
High Case of 2.6 BCF with a Best Case of 1.7 BCF.

The 2016 Venmyn-Deloitte assessment was done after the HADV1, HADV2, HDR1, HPAL1,
HZON1, MDR1, MDR4, MDR5, and 2057 wells were drilled. In drilling these 9 wells, there were 7
wells with gas shows and 5 wells that had sustained gas production. The Venmyn-Deloitte report

Renergen | April 24, 2019                                                              Page | 18
concluded that the annual decline rates averaged from 2 to 6% but did not use an economic cut off to calculate the EURs. They ran their range of Initial Production rates from 140,000 scf/day to 300,000 scf/day and used 150,000 scf/day as the Best Case. The production runs were allowed to run out 49.5 years into the future, which gave a slightly optimistic EUR. The EURs that were presented in the report ranged from a Low case of 0.9 BCF to a High Case of 3.5 BCF. The 2008 MHA report assigned 54 locations to the P2 (Probable) Reserve Category, an additional 63 locations to the P3 (Possible) Reserve Category, and no locations to the Proved Category. There were 357 locations assigned to the Contingent Resources Category. The 2016 Venmyn-Deloitte report assigned 52 locations to P1 (Proved), 60 to the P2 (Probable), and 128 locations to P3 (Possible). Thus far, at best 17 wells that have tested gas, and a drilling program that has about a 60% commercial success rate Venmyn-Deloitte assigned 240 well locations to the Reserve Category and with 22% of the locations having a 90% confidence factor of delivering the base case EUR. There were no Contingent Resources assigned. In 2017 MHA conducted another assessment (below) for IDC reviewing the updated test information and new wells. This report, prepared for an update on the JSE Stock Exchange News Service, draws substantially from the IDC Report, with permission from IDC. It uses the IDC 2017 Reserve and Resource volumetric assessments but generates a different economic analysis based on the complete 1P-2P-3P volumes of gas rather than a limited first phase field development plan that was used for the 2017 IDC report. 2017 Assessment MHA reviewed the updated test data from the HADV1, HADV2, HDR1, HZON1, MDR1, MDR5, and 2057 wells plus addition flare and test data from selected historic blowers. This data confirmed but did not alter, MHA’s original assessment of a range of well performance and lacking sustained, long- term, well production data MHA did not change either the range of expected decline rates nor the range of expected EURs for the wells. MHA expected the current ranges captured the inherent uncertainties and as more data is made available through sustained production the range of uncertainties will be reduced. The continued drilling and testing, plus the advancement of gas sales agreements and Tetra4’s advancement of development and marketing plan allowed MHA, in 2017, to elevate many of the locations into the PROVED category. MHA assigned Proved, Developed, Non-Producing (PDNP) status, on a project basis subject to the submitted Tetra4 development plan and budget, to all wells that have tested significant rates of gas and assigned two offset Proved Undeveloped (PUD) locations to each well, except for well MDR5 which has no offset locations. Thus, MHA assigned 18 PDNP and 34 PUD locations for 52 Proved well locations. In addition, MHA assigned 4 Possible and 4 Probable well locations for seventeen PDNP locations; thus, there were 68 Possible and 68 Probable locations for a total of 188 total Reserve locations. All offset wells were expected to be drilled on a spacing of about 1well\ 0.91 km2 or 225 acres. It is important to note that wherever MHA has assigned an undrilled location, it is for the purposes of accounting for undrilled reserves and may not be the exact location that Tetra4, for operational or permitting reasons, chooses, to drill. All wells in the program and economics were planned as vertical wells; however Tetra4 had expressed Renergen | April 24, 2019 Page | 19
interest and had started planning for slant wells that might intersect more fault and fracture surfaces.
As this style of wells had not been executed as of the time of this report MHA did not include them
in the economics nor construct a type curve for these wells, however as Tetra4 demonstrates its
ability to execute these style of wells and these wells have improved economics it is possible that,
with measurable flow data, MHA will be able to forecast increased recoveries per well with slant or
horizontal style wells.

2019 Assessment
MHA has reviewed the updated production from the HDR1 well, limited single test data from other
wells that are not currently on production and the data from the 2018 Tetra4 T4 WN 01 well that
was drilled to test the shallow “White Sand” play towards the eastern edge of the license. MHA has
also reviewed the Tetra4 updated drilling schedule, OPEX and CAPEX costs and sales agreements
in order to update the MHA financial model.

The “White Sand” play Is a Permian Karoo age sandstone that was identified in a 44 borehole study
by Shango Solutions commissioned by Tetra4 as part of a broader study of the fractured basement
play. Gas flows from the Permian sandstone were identified in 3 wells (2057, 2089, and HAK4) and
a 3D model of the sandstone was developed. Tetra4 extended that model and drilled the T4 WN
01 well beyond the initial boundaries defined by Shango Solutions and encountered 73 meters of
gas bearing Karoo sandstone and siltstone with the well. This well did not test gas at commercial
rates however the potential for this play, as a conventional, low pressure, gas resource, to potentially
add to the future resource and future reserve base of Tetra4 has been established by four wells
penetrating the sandstone over a wide area, each with good gas content. As Tetra4 continues to
evaluate this play MHA will use the new data to assess the ability to add new volumes to Tetra4’s
reserve and resource base.

Additionally, Tetra4 has added data from 2 existing blowers to the database and MHA has reviewed
this data and confirmed that both wells, BN 56120A (AKA Dumidi) and 2190 (AKA Big Flame) are
Proved Developed Non-Producing (PDNP) wells, and each will have 2 offset, Proved Undeveloped
(PUD) locations, 4 Probable, and 4 Possible locations assigned to each well for a total of 22 new
reserve well locations. These new reserve locations and volumes are removed from the Contingent
Resource volumes of the 2018 Report.

Based on this discussion the Technically Recoverable Methane Volumes associated with the
reserve categories are referenced in Table 5. A potential risk is that the rate of recharge of the
methane, and thus also the helium, gas is not known. There is anecdotal evidence of historic
blowers within the Tetra4 license area producing methane gas for over forty years without any
discernable pressure drop however there are no quantified studies to date.

Renergen | April 24, 2019                                                                   Page | 20
Figure 8: Idealized Spacing of New Field Development Wells

 Idealized spacing of an existing Blower (Retreat) and a symmetrical spacing of two PUD
 wells (blue triangles), four Probable wells (red hexagons), and four Possible wells (small
                                       red diamonds).

Renergen | April 24, 2019                                                         Page | 21
Figure 9: Typical Spacing of Field Development Wells Influenced by Faults
A more typical development scenario where wells are spaced out along known fault and
fracture spacing around an existing blower, HZON1 with two PUD wells (blue triangles),
four Probable wells (red hexagons), and four Possible wells (small red diamonds).
Renergen | April 24, 2019 Page | 22Figure 10: Map Proved, Probable and Possible well locations
Map of the existing wells and the future wells with Proved locations (Blue Triangles with
purple centers), Probable locations (Red Hexagons with purple centers) and Possible
locations (small Red diamonds with purple centers). In the black outline is the area defined
as the “Core Area” for the Contingent Resources. All Prospective Resources are outside
of the “Core Area.”
Renergen | April 24, 2019 Page | 23Table 5: Technically Recoverable Methane Volume Estimates-Virginia Gas Field
Category Recoverable Volumes (Bcf) Totals (Bcf)
Developed Undeveloped
Proven (1P) 15.7 29.5 45.3
Probable (P2) 109.2 109.2
Possible (P3) 161.3 161.3
Total (P+P+P) 15.7 297.0 315.8
Possible reserves are those additional reserves that are less certain to be recovered than probable reserves.
There is a 10% probability that the quantities actually recovered will equal or exceed the sum of proved
plus probable plus possible reserves
MHA has defined a core area that has been delineated by drilling and testing within the production
license of 505.12 Km2. Within that area are 19 development locations of 11 wells each (209 well
locations) and a reserve development area of approximately 190 Km2 or 0.91km2/well. Possible
reserves are those additional reserves that are less certain to be recovered than probable reserves.
There is a 10% probability that the quantities actually recovered will equal or exceed the sum of
proved plus probable plus possible reserves. Removing the 190 Km2 that have been assigned to
the Reserve area from the total 505.12 Km2 in the core production area leaves 315.12 Km2 of area
in the Contingent Resource Category. With a well spacing of 0.91 Km2/well that equates to 346
contingent wells. MHA assigned volumes to these wells probabilistically using a range of EURs,
with the C1 category of 0.9 BCF/well, C2 category 1.7 BCF/well and C3 category 2.6 BCF/well.
Contingent Resources are considered discovered; however, there is no certainty that it will
be commercially viable to produce any portion of the resources.
Table 6: Technically Recoverable Contingent Methane Volume Estimates of the Virginia
Gas Field
Category EUR/Well Total BCF
Contingent (C1) 0.9 294.8
Contingent (C2) 1.7 529.7
Contingent (C3) 2.6 952.0
MHA has assigned all of the production area outside of the defined core area as Prospective
Resource area. This area has historic gas blowers on the license, there are existing deep gold and
other metal mines and there are, in the South African Geologic Survey and literature, mapped faults
that extend deep into the sub-surface. There is reasonable expectation that there will be the same
type of gas occurrences within the rest of the production area however neither the historic operators
nor the current operators of the license have delineated the resource to an extent that it can be
considered a Contingent Resource. MHA has taken the same range of EURs/well as in the
Contingent Resource area but has, until there is sufficient information to warrant updating the
Renergen | April 24, 2019 Page | 24evaluation, doubled the distance between the wells from the well spacing used in the Contingent
Resource evaluation area to 1.82 Km2/well. There is no certainty that any portion of the
resources will be discovered. If discovered, there is no certainty that it will be commercially
viable to produce any portion of the resources.
The entire production license is 1,874.2 Km2 and once the 505.12 Km2 core production area is
removed their remains 1,369.08 Km2 of Prospective Resource area. Using a 1.82 Km2/well density
that will equate to an unrisked, a potential 752 wells. MHA has run a probabilistic distribution of
recoverable volumes using the range of EURs calculated for the recoverable methane in the
development area. No helium is assessed as there is insufficient information at this time.
Table 7: Technically Recoverable Prospective Methane Volume Estimates of the Virginia
Gas Field
Category EUR/Well Total BCF
Prospective Resource Low Estimate 0.9 640.6
Prospective Resource Best Estimate 1.7 1,278.4
Prospective Resource High Estimate 2.6 2,068.9
PROSPECTIVE RESOURCES: The estimated quantities of petroleum that may potentially be recovered by
the application of a future development project(s) relate to undiscovered accumulations. These estimates
have both an associated risk of discovery and a risk of development. Further exploration appraisal and
evaluation is required to determine the existence of a significant quantity of potentially moveable
hydrocarbons.”
TECHNICALLY RECOVERABLE HELIUM RESERVES
MHA has used the He concentration data supplied by Tetra4 to map the spatial distribution of He
enrichment in the produced gases. Seven of the tested wells tested Helium (He) concentrations at
least 2% by volume or greater, and some of wells tested over 10%; including the 2057 well. The
2016 Venmyn-Deloitte report made the assumption that all wells would produce an average of 2%
He and all wells would be scrubbed for He and the He sold. MHA has used the data available and
mapped out the He concentrations by well and found that there appears to be a significant
enrichment trend on the west side of the De Bron fault with all wells to the east of the fault showing
no testable He concentrations, at least until you cross the Virginia fault and move further east. Only
the AD1 well, outside of the production license and well to the east of the Virginia fault, shows
enrichment of He gas on the eastern side of the production area. It is very important to note that
there is A) a sparsity of well sampling over the structural high, B) most of the wells that did have
gas compositional sampling did not sample for helium, and C) there is anecdotal evidence that even
those wells that attempted to sample for helium used improper methodologies. It is, therefore, a
distinct possibility that there is sufficient helium concentration over the entire lease for gathering and
commercial sales and once sufficient data is gathered the maps are subject to revision.
This area of low to zero concentrations coincides with a structural high of the Base of the Karoo. All
other known readings of He gas east of the De Bron fault until the Virginia fault is crossed, appear,
Renergen | April 24, 2019 Page | 25at this time until more data is available, to have low to zero enrichment of He. Thus, MHA has assigned He reserves only to a mapped area in the center of the production license but has increased the average He concentration in those wells to 3-4%. Gas percentages of up to 4% are found in this zone and an average He concentration of 3.05% over 202.4 Km2 has been mapped. Within the mapped He concentration area MHA has 7 known blowers or wells that all have tested greater than 2% He concentrations. Within the concentration area, MHA has mapped an additional 14 Proved well locations, 26 Probable well locations, and 27 Possible well locations. The estimated volumes of technically recoverable helium are shown in Tables 8 and 9. Renergen | April 24, 2019 Page | 26
Figure 11: Map of Helium Concentration in %

 Wells with measured helium concentrations have green annotations. The Yellow polygon
                       is the area of the Goldfields Mining Lease.

Renergen | April 24, 2019                                                   Page | 27
Table 8: Technically Recoverable Helium Estimates of the Virginia Gas Project
# of Wells EUR (BCF) He% He/Well Reserves
(BCF)
PDP 1 1.2 0.0305 0.0366 0.0366
Proved Dev
14 0.9 0.0305 0.02745 0.3843
NP
PUD 28 0.9 0.0305 0.02745 0.7686
Prob 56 1.7 0.0305 0.05185 2.9036
Poss 56 2.6 0.0305 0.0793 4.4408
Total (P+P+P) 155 8.5339
Table 9: Technically Recoverable Helium Volume Estimates by Contingent Resource
Category - Virginia Gas Field
Low Case Best Case High Case
(C1) (C2) (C3)
Number of Wells
(Bcf) (Bcf) (Bcf)
346 10.1 19.1 29.2
ECONOMICS
TETRA4 OPERATING CONDITIONS AND SALES
AGREEMENTS
Tetra4 operates under a Production License from the Petroleum Authority of South Africa and must
pay a 5% royalty based on wellhead price to the South African Revenue Service. An additional
royalty of one percent of wellhead price is owed to the GFI Mining South Africa (GFIMSA) or
Goldfields on all new wells located on their existing licenses.
Tetra4 plans to sell 30% of its LNG production into the local wholesale LNG market and 70% into
the local transport market.
Tetra4 has provided to MHA a signed Gas Sales Agreement (GSA) with Unitrans Passenger Limited
(Megabus) for the purchase of natural gas. The gas will be sold in liquefied state by the liter, and
the purchase price is indexed to a local pricing point for 0.005% sulphur diesel at the Megabus
purchase price minus a 30% discount.
Renergen | April 24, 2019 Page | 28Renergen has disclosed to its shareholders and MHA that several original engine manufacturers (OEMs) have agreed to begin manufacturing LNG capable heavy trucks for the South African market, although these agreements are not with Renergen nor Tetra4 directly. This has the potential to accelerate the market for liquid fuel gas in South Africa that Tetra4 wishes to supply as Tetra4 has been supplying to Megabus. It is anticipated that as these agreements are completed Tetra4 can potentially move forward its field development plan, although MHA has not factored these potential contracts into the economic analysis for reserve estimation. Tetra4 has also provided MHA a signed Gas Sales Agreement with Linde Global Helium (Linde) for the purchase of Helium gas at the price point of approximately $200/mcf escalating according to US CPI index. Renergen has entered into a commitment letter with OPIC, the United States’ government development finance institution, for OPIC to provide capital assistance for the development of the helium resource, indicating the United States’ government’s level of interest in the Virginia Gas Project as part of the global helium supply system. The Tetra4 field development plans call for the construction of a gas gathering system, setting compression, the installation of the above-mentioned gas processing facilities and as production increases, an expansion of the entire system. MHA has reviewed Tetra4’s detailed plans for abandonment and rehabilitation of the wells and all infrastructures that have been submitted to, and accepted by, the Petroleum Authority of South Africa (PASA). These plans meet, and in places exceed, governmental regulations for abandonment, rehabilitation, and monitoring. Renergen | April 24, 2019 Page | 29
Figure 12: Map Tetra4 Virginia Gas License and Current Plus Planned Wells

Renergen | April 24, 2019                                                      Page | 30
ECONOMIC PARAMETERS
Proved Developed Producing Well

Sufficient production data are now available to classify the HDR-1 well as Proved Developed
Producing (PDP) reserves. Decline curve analysis of this well (Figure 12) yields a shallow annual
decline of 4.73%/yr.

                               Figure 13: HDR-1 decline curve

Type well rates and recovery are on a gross gas volume. Produced gas volumes were multiplied
by 0.9 to account for 10% impurities in the produced gas stream and were subject to a 5% shrink.
Helium production was forecasted from methane production volumes and the assumed 3% helium
in the wellhead gas stream. The estimates of reserves and future net revenue for individual
properties may not reflect the same confidence level as estimates of reserves and future net
revenue for all properties, due to the effects of aggregation.

Renergen | April 24, 2019                                                             Page | 31
Capital Costs Well drilling and completion CAPEX was 1.5 mZAR per well. The recent drilling campaign of 9 wells resulted in 5 producers and 4 dry holes. This dry hole risk of roughly 40% was addressed by decreasing the type well gas production rate by a factor of 0.6. Connection CAPEX was 1.0 mZAR per well. Pipeline capital of 170 mZAR was allocated into two payments of 68 mZAR (scheduled for May 19 and Dec 19) and one payment of 34 mZAR (scheduled for May 20). Capital for the initial methane and helium liquefaction plants was 121.48 mZAR and 52.48 mZAR, respectively. Development of the Virginia Field will require additional liquefaction plants for each 6 mmcfd increment in gross gas production. CAPEX for these additional methane and helium liquefaction plants was 180.0 mZAR and 100.0 mZAR, respectively. Based on the three type wells discussed above, new plants will be required for every 40 1P wells drilled (6 mmcfd/150 mcfd per well), every 24 2P wells, and every 16 3P wells. All capital costs were escalated at 2 %/yr. Operating expenses Fixed lease operating expenses (LOE’s), assigned at the plant level rather than individual wells, were 1,500 mZAR per month. The variable OPEX was 13.9 ZAR/mcf, reflecting truck transport of the methane and helium. All operating expenses were escalated at 2%yr until the price doubled then the LOE was held constant for the life of the project. Prices The methane price was a blended price reflecting the 30%/70% split between the wholesale and transport sectors discussed above. The wholesale LNG price of 217 ZAR/mcf was escalated at the South African CPI of 6%/year and the transport diesel equivalent LNG price of 245 ZAR/mcf was escalated based on historical diesel prices, 10%/yr. The resulting blended price was 236 ZAR/mcf and escalated at 9%/yr. The blended price was held constant once the initial price had doubled. The initial helium price of 2863 ZAR/mcf (200 USD/mcf) was held constant for the first two months then was escalated at the average US CPI of 2.4%/yr. forecast. Monthly methane and helium prices are plotted in Figure 14 and listed in Appendix 1. Renergen | April 24, 2019 Page | 32
1 000                                                                    10 000

                                  900                                                                     9 000

                                  800                                                                     8 000
        methane price, ZAR/mcf

                                  700                                                                     7 000

                                                                                                                   helium price, ZAR/mcf
                                  600                                                                     6 000

                                  500                                                                     5 000

                                  400                                                                     4 000

                                  300                                                                     3 000

                                  200                                                                     2 000

                                  100                                                                     1 000

                                    0                                                                     0
                                     2010    2020    2030    2040          2050      2060      2070   2080
                                                                    year
                                                             methane              helium

                                            Figure 14: Methane and Helium Monthly Prices

MHA assumed a methane BTU factor of 1.01 Gj/mcf (0.960 mmbtu/mcf). Shrink, which accounts
for gas used by the plant, measurement imbalances, and surface losses, as well as helium
extraction, was assumed to be a constant 5 % throughout the life of the field. All wells are burdened
with a 5% overriding royalty interest (ORRI) on the wellhead gas price plus those wells in the
Goldfields area are subject to an additional 1% ORRI. The well counts associated with field
development of Reserves and Contingent Resources are given in Table 10 below.

                                  Table 10: Wellcount by Reserve and Contingent Resource Category

                                                     Total                  Proved +                    Proved +
       Reserves                             PDNP    Proved   Probable       Probable       Possible    Probable +
                                                     (1P)                     (2P)                    Possible (3P)
       Number of
                                             19      58        76             134            76           210
       wells

       Contingent                                    Low                      Best
                                                                                                       High Case
       Resources                                     Case                     Case
       Number of
       Methane                                       346                      346                         346
       wells
       Number of
                                                     346                      346                         346
       He wells

Renergen | April 24, 2019                                                                                            Page | 33
RESERVE ECONOMICS
Based on the economic parameters discussed above, reserves and economics were calculated for
the Virginia Gas Field. Gross and net methane and helium reserves based on a 10% discount rate
are collected in Table 11.
Table 11: Gross and Net Methane and Helium Reserves
1P
Reserve Cat Gross CH4 Gross Helium Net CH4 Net Helium
(MMCF) (MMCF) (MMCF) (MMCF)
TOTAL PDNP 14,765.3 346.0 13,288.8 327.7
TOTAL PUD 29,526.1 691.9 26,573.5 655.3
TOTAL 1P PRV 45,285.1 1,069.5 40,759.0 1,013.1
2P
Reserve Cat Gross CH4 Gross Helium Net CH4 Net Helium
(MMCF) (MMCF) (MMCF) (MMCF)
TOTAL PDNP 14,765.3 346.0 13,288.8 327.7
TOTAL PUD 29,526.1 691.9 26,573.5 655.3
TOTAL PROVED 45,285.1 1,069.5 40,759.0 1,013.1
TOTAL PROBABLE 109,146.6 2,528.4 98,231.8 2,394.7
TOTAL 2P PRV+PRB 154,431.7 3,597.9 138,990.9 3,407.8
3P
Reserve Cat Gross CH4 Gross Helium Net CH4 Net Helium
(MMCF) (MMCF) (MMCF) (MMCF)
TOTAL PDNP 14,765.3 346.0 13,288.8 327.7
TOTAL PUD 29,526.1 691.9 26,573.5 655.3
TOTAL PROVED 45,285.1 1,069.5 40,759.0 1,013.1
TOTAL PROBABLE 109,146.6 2,528.4 98,231.8 2,394.7
TOTAL POSSIBLE 161,318.0 3,640.7 145,186.0 3,448.2
TOTAL 3P
315,749.7 7,238.6 284,176.8 6,856.1
PRV+PRB+POS
Renergen | April 24, 2019 Page | 34At the request of Tetra4, net present values associated with the reserves volumes were calculated
for various discount rates. The results are shown in Table 12.
Table 12: Virginia Gas Field – Methane and Helium Reserves
Net Present Values for Selected Discount Factors, mZAR
Proved +
Total Proved +
Discount Probable +
PDNP Proved Probable Probable Possible
Factor Possible
(1P) (2P)
(3P)
Undiscounted 6,462 17,069 50,367 64,477 75,065 135,196
5% 3,471 7,995 20,988 27,754 30,430 56,387
8% 2,580 5,599 14,369 19,059 20,481 38,224
10% 2,172 4,541 11,620 15,375 16,376 30,624
15% 1,502 2,878 7,516 9,788 10,301 19,242
20% 1,113 1,194 5,318 6,758 7,092 13,162
30% 695 978 3,104 3,699 3,929 7,127
CONTINGENT RESOURCE ECONOMICS
According to the PRMS guidance economics are not required, nor normally run, on Contingent
Resources as by definition contingent resources have not met the threshold of “commerciality” due
to one or more contingencies. Per Renergen’s request, MHA has run Contingent Resource
economics for the Virginia Gas Project utilizing costs and prices discussed above. The resulting
gas volumes and associated un-risked net present values are in Table 13 below. Contingencies to
be resolved include quantification of in-place methane volumes and recharge rates of this biogenic
gas play and confidence that the proposed development program will not deplete the contingent
resource gas volumes.
Renergen | April 24, 2019 Page | 35Table 13: Net Methane and Helium Contingent Resources and Net Present Values
Virginia Gas Field – Specified Prices and Costs
Low (C1) Best (C2) High (C3)
Methane (BCF) 237 435 648
Helium 7.9 14.4 20.8
Net Present Value (MZAR)
Undiscounted 126,597 234,899 349,070
5% 48,886 89,010 131,607
8% 31,470 56,968 84,118
10% 24,344 43,970 64,899
15% 14,014 25,269 37,300
20% 8,802 15,897 23,489
30% 4,059 7,392 10,958
CONCLUSIONS
Based on analysis of technical and economic data provided by Tetra4, MHA has estimated methane
and helium Reserves and Resources for the Virginia Gas Field according to SPE PRMS guidance
and SAMOG code. Estimated Reserves and Contingent Resource gross and net methane and
helium volumes are presented in Table 14. Net present values of the Reserves at requested
discount rates are given in Table 12 above.
Table 14: Virginia Gas Field - Gross and Net Methane and Helium Reserves and Contingent
Resources
Gross
Gross CH4 Helium Net CH4 Net Helium
Reserve Cat (MMCF) (MMCF) (MMCF) (MMCF)
RESERVES
TOTAL 1P 45,285.0 1069.5 40759.0 1013.0
TOTAL 2P 154,431.7 3597.9 138,990.8 3407.8
TOTAL 3P 315749.7 7238.6 284,176.8 6856.0
CONTINGENT RESOURCES
TOTAL C1 262,978.3 8362.7 237,337.9 7944.5
TOTAL C2 483,058.3 15168.0 435,960.1 14409.6
TOTAL C3 718,612.4 21989.5 648,547.7 20890.0
Renergen | April 24, 2019 Page | 36QUALIFICATIONS Jeffrey B. Aldrich is a Partner in MHA Petroleum Consultants, Inc. (MHA) and is a Certified Petroleum Geologist, #6254, by the American Association of Petroleum Geologists (AAPG) and a Licensed Professional Geoscientist, #394; He is an active member of the AAPG and the Society of Petroleum Engineers (SPE). He has over thirty years as a practicing petroleum geologist/geophysicist and over twenty years of experience in oil and gas reserve evaluations. He holds a Bachelor’s of Science degree in Geology from Vanderbilt University and a Master’s of Science degree in Geology from Texas A&M University. He is an instructor in the PetroSkills Alliance and is the Course Director for “Prospect and Play Analysis”, “Evaluating and Developing Shale Reservoirs”, “Unconventional Resource and Reserve Estimation”, and “Coalbed Methane Reservoirs”. John Seidle is a Partner and Senior Reservoir Engineer with MHA Petroleum Consultants LLC in Denver, Colorado. He has more than thirty-five years of experience in unconventional gas and oil reservoir engineering in domestic and international plays. His current duties include unconventional reservoir engineering, reserve studies and economic evaluations, unconventional well performance analysis, and serving as an expert witness for litigation and regulatory hearings. Dr. Seidle is an instructor for industry classes, primarily unconventional reservoirs. Privileged to work with others on over 29 technical papers, he is the author of “Fundamentals of Coalbed Methane Reservoir Engineering”. John is editor and chapter author of SPEE Monograph 4, “Estimating Ultimate Recovery of Developed Wells in Low-Permeability Reservoirs”. He received a PhD in Mechanical Engineering from the University of Colorado, is a member of SPE, AAPG, and SPEE, and is a Registered Professional Engineer in Colorado, Oklahoma, and Wyoming. Unconventional reservoir experience includes USA, Canada, Australia, China, India, South Africa, New Zealand, Colombia, Mexico, France, UK, Turkey, Poland, Mongolia, Ukraine. Renergen | April 24, 2019 Page | 37
BIBLIOGRAPHY
Hugo, P. (1963). Helium in the Orange Free State Gold-Field. Pretoria: The Government Printer.

Lollar, B. S., Lacrampe-Couloume, G., Slater, G., Ward, J., Moser, D., Gihring, T., . . . Onstott, T.
        (2006). Unravelling abiogenic and biogenic sources of methane in the Earth’s deep
        subsurface. Chemical Geology, 328-339.

Lollar, B. S., Westgate, T., Ward, J., Slater, G., & Lacrampe-Couloume, G. (2002). Abiogenic
        formation of alkenes in the Earth's crust as a minor source for global hydrocarbon
        reservoirs. Nature, 522-524.

McCarthy, T. (2006). The Witwatersrand Supergroup. Geology of South Africa, 155-186.

SPE/AAPG/WPC/SPEE/SEG. (2007). Petroleum Resources Management System. Society of
     Petroleum Engineers.

The South African Oil and Gas (SAMOG) Committee. (2015). The South African Code for the
      Reporting of Oil and Gas Resources. Marshalltown: The South African Oil and Gas
      (SAMOG) Committee.

van der Westhuizen, W., & de Bruiyn, H. (2006). The Ventersdorp Subgroup. Geology of South
       Africa, 187-208.

Ward, J., Slater, G., Moser, D., Lin, L.-H., Lacrampe-Couloume, G., Bonin, A., . . . Lollar, B.
       (2004). Microbial hydrocarbon gases in the Witwatersrand Basin, South Africa:
       Implications for the deep biosphere. Geochimica et Cosmochimica Acta, 3239-3250.

Renergen | April 24, 2019                                                                  Page | 38
APPENDIX 1: METHANE AND HELIUM PRICES
As discussed above, the methane price was a blended price reflecting the 30%/70% split
between the wholesale and transport sectors discussed above. The wholesale LNG price
of 217 ZAR/mcf was escalated at the South African CPI of 6%/year, and the transport LNG
price of 171 ZAR/mcf was escalated based on historical diesel prices, 10%/yr. The resulting
blended price was 236 ZAR/mcf and escalated at 9%/yr. The blended price was held
constant once the initial price had doubled.
The initial helium price of 2863 ZAR/mcf (200 USD/mcf) was held constant for the first two
months then was escalated at the average US CPI of 2.4%/yr. forecast.
Annual methane and helium prices are listed in Table A.1 below.
methane, helium methane, helium
year ZAR/mcf ZAR/mcf year ZAR/mcf ZAR/mcf
2019 236 2,863 2044 471 5,180
2020 257 2,932 2045 471 5,304
2021 280 3,002 2046 471 5,432
2022 306 3,074 2047 471 5,562
2023 333 3,148 2048 471 5,695
2024 363 3,224 2049 471 5,695
2025 396 3,301 2050 471 5,695
2026 432 3,380 2051 471 5,695
2027 471 3,461 2052 471 5,695
2028 471 3,544 2053 471 5,695
2029 471 3,629 2054 471 5,695
2030 471 3,716 2055 471 5,695
2031 471 3,806 2056 471 5,695
2032 471 3,897 2057 471 5,695
2033 471 3,991 2058 471 5,695
2034 471 4,086 2059 471 5,695
2035 471 4,184 2060 471 5,695
2036 471 4,285 2061 471 5,695
2037 471 4,388 2062 471 5,695
2038 471 4,493 2063 471 5,695
2039 471 4,601 2064 471 5,695
2040 471 4,711 2065 471 5,695
2041 471 4,824 2066 471 5,695
2042 471 4,940 2067 471 5,695
2043 471 5,059 2068 471 5,695
Renergen | April 24, 2019 Page | 39You can also read