2021-2022 Winter Reliability Assessment - November 2021 - NERC
←
→
Page content transcription
If your browser does not render page correctly, please read the page content below
2021–2022 Winter Reliability Assessment
November 2021
2021–2022 Winter Reliability Assessment

Table of Contents
Preface .................................................................................................................................. 2   Regional Assessments Dashboards ..................................................................................... 20

About this Assessment .......................................................................................................... 3                  MISO ............................................................................................................................. 21

Key Findings .......................................................................................................................... 4           MRO-Manitoba Hydro .................................................................................................. 22

Recommendations ................................................................................................................ 5                  MRO-SaskPower ........................................................................................................... 23

Risk Highlights for Winter 2021–2022 .................................................................................. 7                           NPCC-Maritimes ........................................................................................................... 24

   Seasonal Risk Assessments of Area Resource and Demand Scenarios ............................. 7                                                  NPCC-New England....................................................................................................... 25

   Seasonal Risk Assessments for Other Areas ...................................................................11                                  NPCC-New York ............................................................................................................ 26

NERC Level 2 Alert: Cold Weather Preparations for Extreme Weather Events ..................14                                                       NPCC-Ontario ............................................................................................................... 27

   Coal Stockpiles ................................................................................................................16               NPCC-Québec ............................................................................................................... 28

   Dual-Fuel Generation ......................................................................................................17                    PJM ............................................................................................................................... 29

Probabilistic Studies of Winter Reliability Risks ..................................................................18                              SERC-East ...................................................................................................................... 30

   NPCC Winter Multi-Area Probabilistic Reliability Assessment........................................18                                            SERC-Central ................................................................................................................. 31

   Texas RE-ERCOT Probabilistic Risk Assessment ..............................................................18                                    SERC-Southeast ............................................................................................................ 32

   MRO-SaskPower Probabilistic Capacity Adequacy Assessment .....................................19                                                 SERC-Florida Peninsula ................................................................................................. 33
                                                                                                                                                    SPP ................................................................................................................................ 34
                                                                                                                                                    Texas RE-ERCOT ............................................................................................................ 35
                                                                                                                                                    WECC-NWPP-AB ........................................................................................................... 36
                                                                                                                                                    WECC-NWPP-BC ........................................................................................................... 37
                                                                                                                                                    WECC-CA/MX ............................................................................................................... 38
                                                                                                                                                    WECC-NWPP ................................................................................................................. 39
                                                                                                                                                    WECC-SRSG................................................................................................................... 40
                                                                                                                                               Data Concepts and Assumptions ........................................................................................ 41
                                                                                                                                               Resource Adequacy............................................................................................................. 43
                                                                                                                                               Changes from Year-to-Year ................................................................................................. 44
                                                                                                                                               Demand and Resource Tables............................................................................................. 45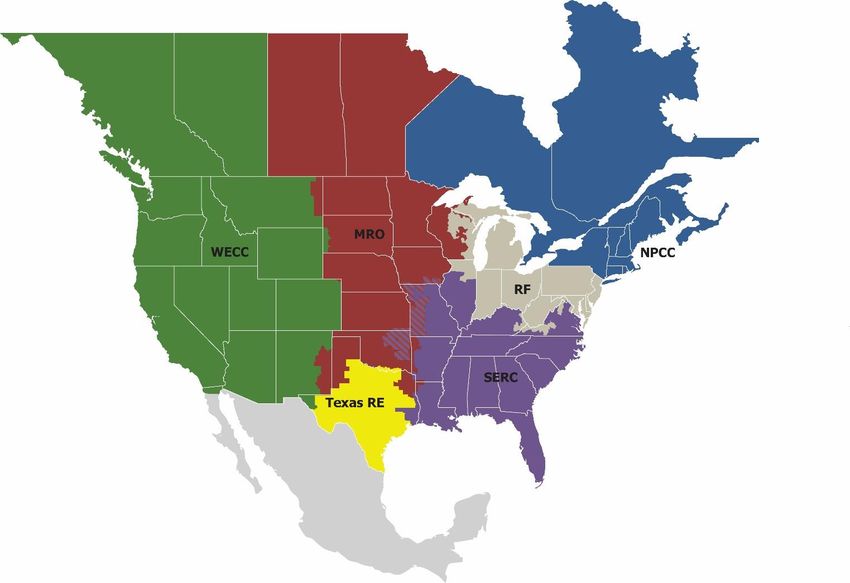
2021–2022 Winter Reliability Assessment

Preface
The vision for the Electric Reliability Organization Enterprise, which is comprised of the North American Electric Reliability Corporation (NERC) and the six Regional Entities (RE), is a highly reliable and secure North
American bulk power system (BPS). Our mission is to assure the effective and efficient reduction of risks to the reliability and security of the grid.

                                                                                          Reliability | Resilience | Security
                                                                        Because nearly 400 million citizens in North America are counting on us

The North American BPS is made up of six RE boundaries as shown in the map below. The multicolored area denotes overlap as some load-serving entities participate in one RE while associated Transmission
Owners/Operators participate in another. Refer to the Data Concepts and Assumptions section for more information. A map and list of the assessment areas can be found in the Regional Assessments Dashboards
section.

                                                                                                                                                       MRO         Midwest Reliability Organization
                                                                                                                                                       NPCC        Northeast Power Coordinating Council
                                                                                                                                                       RF          ReliabilityFirst
                                                                                                                                                       SERC        SERC Reliability Corporation
                                                                                                                                                       Texas RE    Texas Reliability Entity
                                                                                                                                                       WECC        WECC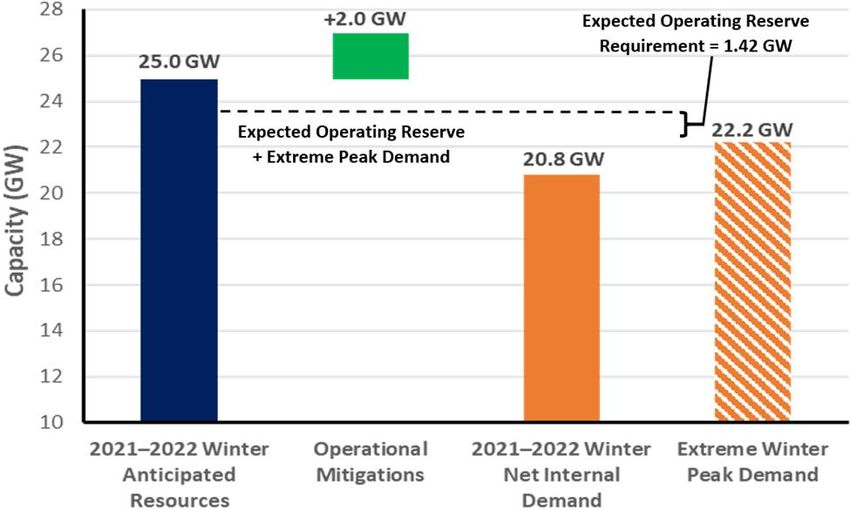
2021–2022 Winter Reliability Assessment                                           3

About this Assessment
NERC’s 2021-2022 Winter Reliability Assessment (WRA) identifies, assesses, and reports on areas of concern regarding the reliability of the North American BPS for the upcoming winter season. In addition, the
WRA presents peak electricity demand and supply changes and highlights any unique regional challenges or expected conditions that might impact the BPS. The reliability assessment process is a coordinated
reliability evaluation between the Reliability Assessment Subcommittee (RAS), the REs, and NERC staff using demand and resource projections obtained from the assessment areas. This report reflects NERC’s
independent assessment and is intended to inform industry leaders, planners, operators, and regulatory bodies so that they are better prepared to take necessary actions to ensure BPS reliability. This report also
provides an opportunity for the industry to discuss plans and preparations to ensure reliability for the upcoming winter period. The below infographic provides a basic overview.
2021–2022 Winter Reliability Assessment 4
Key Findings
NERC’s annual WRA covers the upcoming three-month (December–February) 2021–2022 winter
period. This assessment provides an evaluation of generation resource and transmission system
adequacy necessary to meet projected winter peak demands and operating reserves. This assessment
identifies potential reliability issues of interest and regional topics of concern. The following findings
represent NERC’s independent evaluation of electricity generation and transmission capacity and
potential operational concerns that may need to be addressed for the upcoming winter:
Extreme weather events, including extended durations of colder than normal weather, pose
a risk to the uninterrupted delivery of power to electricity consumers: Winter weather that
exceeds projected conditions can expose power system generation and fuel delivery
infrastructure vulnerabilities and challenge electricity system operators’ ability to maintain
reliability of the BPS. Although Anticipated Reserve Margins meet or surpass the Reference
Margin Level in all areas as shown in the Resource Adequacy section, harsh conditions
characterized by extreme or prolonged cold temperatures over a large area create unique
challenges in maintaining grid reliability in many parts of the North American BPS. Such
conditions occurred most recently in North America during the February 2021 North
American cold weather event.1 Increased demand caused by frigid temperatures and higher
than anticipated generator forced outages and derates in susceptible areas could create Figure 1: Winter Reliability Risk Area Summary
conditions that lead system operators to take emergency operating actions, up to and Natural gas supply disruptions in infrastructure-limited areas have the potential to affect
including firm load shedding, as a result of energy emergencies. NERC’s operational risk winter reliability: Disruptions to pipeline natural gas supplies and natural gas production
assessment, which is presented in detail in the Risk Highlights for Winter 2021–2022 section, sites, as observed in Texas RE-ERCOT in February 2021, can have the potential to affect power
identifies BPS resource deficiencies in parts of North America (Figure 1) that could occur system reliability in winter. Although New England and the U.S. Southwest have sufficient
during extreme winter weather. Peak demand or generator outages that exceed forecasts— planning reserves, fuel supplies to generators in those areas can be vulnerable during cold
at levels that have been experienced in previous winter events—can be expected to cause weather conditions. In NPCC-New England, the capacity of natural gas transportation
energy emergencies in MISO, SPP, and Texas RE-ERCOT. infrastructure can be constrained when cold temperatures cause peak demand for both
electricity generation and consumer space heating needs. Potential constraints on the fuel
delivery systems and limited inventory of liquid fuels may exacerbate the risks for fuel based
generator outages and reductions. Southern California and the U.S. Southwest have limited
natural gas storage and lack redundancy in supply infrastructure. As a result, electricity
generators face the risk of fuel supply curtailment or disruption from extreme winter weather
events. 2, 3 A ruptured interstate natural gas pipeline in August has caused an outage that
reduces the amount of natural gas flowing into California. Natural gas storage levels in the
1 3
See the FERC and NERC staff Inquiry preliminary findings and recommendations: February 2021 Cold Weather Grid Western Interconnection Gas–Electric Interface Study:
Operations: Preliminary Findings and Recommendations - PPT Version | Federal Energy Regulatory Commission (ferc.gov) https://www.wecc.org/Reliability/Western%20Interconnection%20Gas%20Electric%20Interface%20Study%20Public%20Re
2 ISO-NE Winter 2017/2018 Recap: Historic cold snap reinforces findings in Operational Fuel-Security Analysis: port.pdf
https://isonewswire.com/2018/04/25/winter-2017-2018-recap-historic-cold-snap-reinforces-findings-in-operational-fuel-
security-analysis/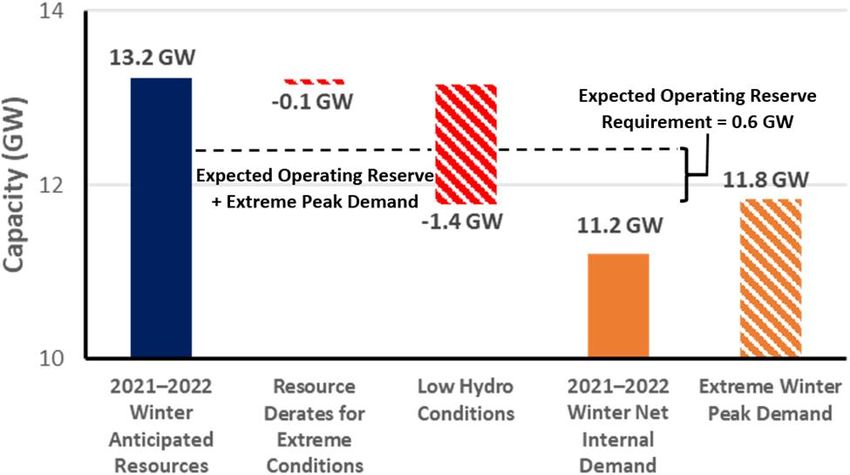
2021–2022 Winter Reliability Assessment 5
area will decline during periods of high demand while the outage persists. Electricity reliability Recommendations
would not be affected in average temperatures and conditions, however prolonged periods To reduce the risks of energy shortfalls on the BPS this winter, NERC recommends the following:
of cold temperatures could result in curtailment of natural gas fuel to generators.4
Grid operators, GOs, and Generator Operators (GOPs) should review NERC Level 2 alert—
Continuing drought in the west can cause low hydro conditions for the upcoming winter Cold Weather Preparations for Extreme Weather Events—and take recommended
and reduce the supply of electricity for transfer throughout the area: Although resources steps prior to winter.
are expected to be sufficient for peak demand, higher demand from more extreme
temperatures in the northwest could cause a shortfall. Low hydro conditions can reduce Grid operators should prepare their operating plans to manage potential supply shortfalls
transfers needed to mitigate a wide area cold weather event. and take proactive steps for generator readiness, fuel availability, and sustained
operations in extreme conditions. BAs should poll their generating units periodically
Generator Owners are facing challenges in obtaining fuels as many supply chains are and in advance of approaching severe weather to understand their readiness level for
stressed: No specific BPS reliability impacts are currently foreseen; however, owners and normal and extreme conditions, giving consideration for unit weatherization as well
operators of fossil-fired generators will need to monitor their coal and fuel oil stores and as fuel supply risk.
natural gas contracts as late-stage acquisitions are less assured this winter. Regional natural
gas storage levels are below average as a result of natural gas infrastructure maintenance and BA and RC should conduct drills on alert protocols to ensure that they are prepared to
high natural gas usage throughout the warm summer months. In most assessment areas, signal need for conservative operations, restrictive maintenance periods, etc. BA and
natural gas reliance as a generator fuel has increased in recent years. NPCC-New England GOPs should verify protocols and operator training for communication and dispatch.
competes for liquefied natural gas supply on the world market—some of which powers Distribution providers and load-serving entities should review non-firm customer
electric generation in the area—and unprecedented high liquefied natural gas demand is inventories and rolling black out procedures to ensure that no critical infrastructure
anticipated for the upcoming 2021–2022 winter months. These potential constraints could loads (e.g., natural gas, telecommunications) would be affected. Rehearse protocols
challenge many owners of fossil-fired plants over the winter and underscore the need for that prepare customers for impacts of severe weather.
operators at the Balancing Authorities (BAs) and Reliability Coordinators (RCs) to include
generator fuel surveying in their operating plans.
Responses to NERC’s Level 2 Alert—Cold Weather Preparations for Extreme Weather
Events—indicate that operating plans for winter are in place, but generator resource
availability could again suffer as a result of equipment failure or lack of fuel under severe
winter conditions: In August, the ERO issued a Level 2 NERC Alert to RCs, BAs, Transmission
Operators (TOPs), and Generator Owners (GOs). The alert includes five recommendations as
well as a series of questions to help evaluate the Bulk Electric System’s winter readiness.
Responses indicate that grid operators have put operating plans in place to reduce seasonal
risks and maintain system reliability. However, GOs and grid operator’s responses to
questions about winterization plans and fuel coordination indicate that some plant
vulnerabilities can be anticipated for the upcoming winter. The responses indicate the
importance for grid operators to be prepared to implement their operating plans to manage
potential supply shortfalls in extreme weather.
4See California Public Utilities Commission Winter 2021-22 Southern California Reliability Assessment:
https://www.cpuc.ca.gov/-/media/cpuc-website/divisions/energy-division/documents/natural-gas/aliso-
canyon/winter2021-22-reliabilityassessment.pdf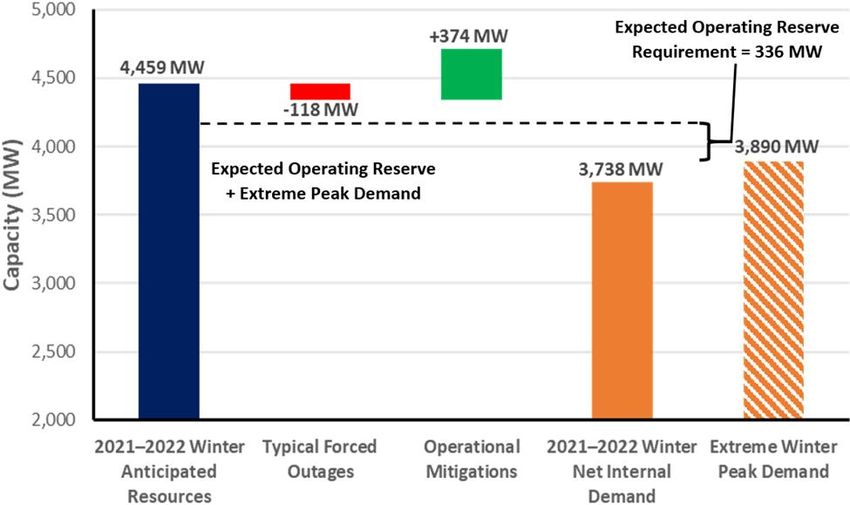
2021–2022 Winter Reliability Assessment                                          6

    February 2021 Cold Weather Event: Winter Storm Uri
    From February 13–17, 2021, the Central United States suffered an intense and prolonged cold wave that affected many areas across the Texas RE-ERCOT, MISO, and SPP assessment areas. Increasing demand
    was unable to be met as generation and transmission experienced widespread outages. FERC, NERC and the REs launched the February 2021 Cold Weather Grid Operations joint inquiry regarding the BPS
    events as a result of winter storm Uri. The inquiry identified the following root causes:
        Generation freezing
        Limited natural gas fuel supply
        Natural gas and electricity interdependency
        ERCOT firm load shed affected natural gas facilities
        Manual and automatic load shed coordination
    Generators without winterization experienced mechanical failures from a variety of causes that include frozen instrumentation and loss of ancillary support systems, such as airflow, cooling, and internal fuel
    delivery. Wind generators’ failures were attributable to iced wind turbine blades. Freezing and power outage issues at both gathering and processing facilities for natural gas caused limited natural gas supply
    for generators. Firm load shed affected power supply to various natural gas production and processing facilities that in turn led to further forced outages for natural gas generators. ERCOT ordered firm load
    shed for nearly three consecutive days that reached a peak of 20,000 MW ordered off-line at its worst point. During this time, ERCOT experienced a peak of 34,000 MW of generation outages for over two
    consecutive days. SPP ordered approximately five hours of firm load shed reaching 2,700 MW at its peak, and MISO experienced over two hours of firm load shed with 700 MW ordered off-line at its worst
    point. The ERO has taken the following actions to address concerns for extreme weather risks for future winters:
        Conducted the joint FERC-NERC Inquiry
        Issued NERC Level 2 alert: Cold Weather Preparations for Extreme Weather Events
        Developed cold weather Reliability Standards that have been adopted by the NERC Board of Trustees and filed with applicable regulatory authorities. In the United States, the new cold weather
           requirements will become effective in 2023.
        Prepared this 2021–2022 Winter Reliability Assessment
    Recommendations from the inquiry include Reliability Standards, generator winterization, natural gas infrastructure winterization, and establishing a natural gas-electric reliability forum. An in-depth evaluation
    of the February 2021 cold weather event on BPS operations is included in the joint FERC-NERC inquiry.5

5   FERC, NERC Staff Review 2021 Winter Freeze, Recommend Standards Improvements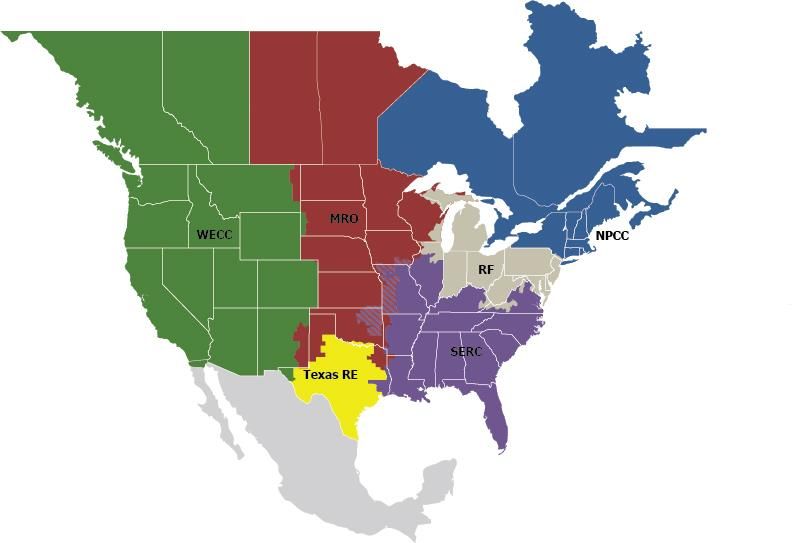
2021–2022 Winter Reliability Assessment                                           7
Risk Highlights for Winter 2021–2022
Winter weather conditions that exceed projected conditions and expose power system generation and fuel delivery infrastructure vulnerabilities can challenge electricity system operators’ ability to maintain
reliability of the BPS. Specific risks for the upcoming winter are analyzed in this section of the WRA.

Seasonal Risk Assessments of Area Resource and Demand Scenarios
Areas can face energy shortfalls despite having Planning Reserve Margins that exceed Reference Margin Levels. Operating resources may be insufficient during periods of peak demand for reasons that could
include generator scheduled maintenance, forced outages due to normal and more extreme weather conditions and loads, or low-likelihood conditions that affect generation resource performance or unit
availability, including constrained fuel supplies. The Regional Assessment Dashboards section in this report includes a seasonal risk scenario for each area that illustrates variables in resources and load and the
potential effects that operating actions can have to mitigate shortfalls in operating reserves. Figure 2 shows an example seasonal risk assessment for the Independent System Operator-New England (ISO-NE)
area that was developed with data from NPCC and ISO-NE. The left blue column shows anticipated resources (from the Demand and Resource Tables), and the two orange columns at the right show the two
demand scenarios of the normal peak net internal demand from the resource adequacy data table and the extreme winter peak demand—both determined by the assessment area. The middle red or green bars
show adjustments that are applied cumulatively to the anticipated resources. A description of resource and demand variables for Figure 2 is found in Table 1.

                                                           Figure 2: ISO-NE Area Seasonal Risk Assessment at Extreme Peak Demand

The seasonal risk assessment for ISO-NE shows that resources are available to meet extreme conditions. Based on the assumptions in Table 1, resources are available to meet expected operating reserve
requirements for the normal and extreme demand and outage scenarios analyzed. By examining various maintenance and forced outage scenarios and seasonal derated resource conditions, the seasonal risk
assessment analysis provides insights into operational challenges that can occur as a result of prolonged and extreme cold temperatures.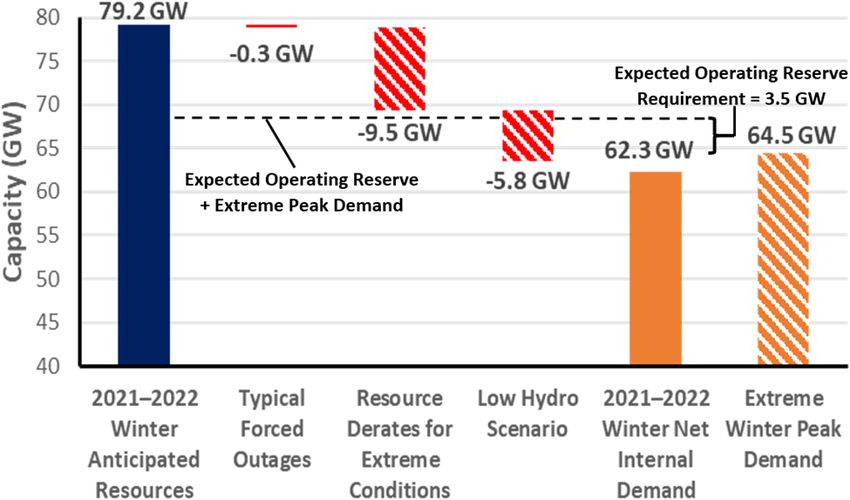
2021–2022 Winter Reliability Assessment                                 8

                                                 Table 1: Resource and Demand Variables in the ISO-NE Seasonal Risk Assessment
                                                                                                     Resource Scenarios
                                             Typical maintenance outages refer to all planned outages for the period, including any known long-term outages, generation outages, reductions due to
                 Typical Maintenance                                                                                                                                                                         -0.3
                                             transmission work, and external outages that would affect ISO-NE imports. The value is a snapshot of these considerations that is produced monthly and
                 Planned Outages                                                                                                                                                                             GW
                                             forecast out two years.
                                             Typical forced outages refer to an estimate of generation resources that will experience forced outage during peak load conditions. ISO-NE calculated this      -2.8
                 Typical Forced Outages
                                             capacity value from historical forced outages in previous winters.                                                                                              GW
                 Resource Derates for        A low-likelihood, high forced outage scenario is used to analyze the effect of cold weather-driven generation outages. The assumed forced outage for this
                                                                                                                                                                                                             -5.7
                 Extreme Conditions (Low-    scenario is based on the sum of the unplanned outages beyond typical forced outages that are expected to be caused by extreme cold weather physically
                                                                                                                                                                                                             GW
                 likelihood)                 impacting generator availability (e.g., frozen sensing lines or equipment failure).
                                             ISO-NE depends on a large fleet of natural-gas-fired generation that may be at risk due to high firm demand, resulting in the unavailability of natural gas
                 Extreme Natural Gas Fuel
                                             during colder temperatures. ISO-NE calculates the amount of generator natural gas at risk due to lack of natural gas during cold weather based on dry-bulb      -0.5
                 Risk Scenario (Low-
                                             average temperature. This assumes no generator natural gas at risk for temperatures at or above 30°F and a reduction curve for temperatures below 30°F.         GW
                 likelihood)
                                             The electric generating capacity depicted as at-risk in Figure 2 is the maximum.
                                             An estimated combination of load relief is achieved through operating procedure actions (e.g., requesting voluntary load curtailment of market participants,
                                             the purchase of available emergency capacity and energy from market participants or neighboring RC or BA areas, request for generators and demand               +1.9
                 Operational Mitigations
                                             response resources not subject to market obligations to voluntarily provide energy for reliability, requesting voluntary load curtailment by large industrial   GW
                                             and commercial customers, and radio and television appeals for voluntary load curtailment).
                                                                                                      Demand Scenarios
                                             This is the forecast 50/50 net winter peak load that integrates state historical demand, economic and weather data, and the impacts of utility-sponsored
                 2021–2022 Winter Net
                                             conservation and peak-load management programs. Energy efficiency is included in this demand forecast and assumes that behind-the-meter solar
                 Internal Demand
                                             generation will be off-line or unable to generate for the peak winter hours.
                                             Demand Scenarios beyond (90/10) are tested to determine the level of risk and actions required to maintain the integrity of the interconnected BPS, which
                 Extreme Winter Peak Load
                                             includes emergency actions up to and including load shedding.

The seasonal risk assessment does not account for all of the unique energy assurance risks associated with the area. Long-duration cold spells and disruptions to primary and back-up fuel supply chains are not
explicitly considered in the New England seasonal risk scenario and can cause unique risks to the area’s operations. Conditions such as these occurred in the 2017–2018 winter and led to a rapid decline in fuel
oil inventories used by electricity generators. Gripped by a cold weather stretch for an extended duration between December 25 and January 8, all major cities in New England had average temperatures below
normal for at least 13 consecutive days, of which 10 days averaged more than 10°F below normal. Overall, there was significantly higher than normal use of oil, and coal use also increased over its normal use.
Natural gas and oil fuel price inversion led to oil being in economic merit and base loaded. As natural gas became uneconomic, the entire season’s oil supply rapidly depleted. The amount of electricity generated
from natural gas declined significantly at the end of December as temperatures plunged, and most available pipeline capacity was used to serve firm local natural gas distribution company demand for heating
customers. Oil-fired generation increased sharply during the same period, surpassing natural-gas-fired generation on December 28. With extended days of burning oil, several resources either had concerns about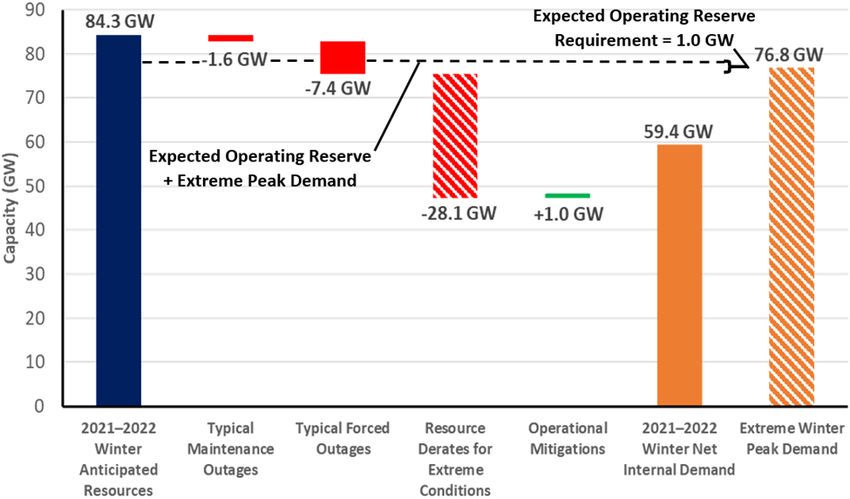
2021–2022 Winter Reliability Assessment                       9
hitting federal and/or state emissions limitations or were impacted by emissions limitations. This primarily includes resources in Massachusetts, Connecticut, and Rhode Island. As oil inventories depleted,
replenishment could not keep up with demand until January 9 when cold temperatures eased. Figure 3 shows the impact the cold weather had on fuel oil inventories during the event.6

                                                                       Figure 3: Fuel Oil Inventories in ISO-NE during 2017–2018 Winter5
                                                                    This chart is an approximation of usable oil, discounting unit outages, reductions, or emissions.

6   https://www.iso-ne.com/static-assets/documents/2018/01/20180112_cold_weather_ops_npc.pdf
2021–2022 Winter Reliability Assessment 10
7
Since the winter of 2017–2018, ISO-NE has implemented the 21-Day Energy Forecast and Report that is published to provide market participants with early indications of potential fuel scarcity conditions and
help inform fuel procurement decisions. ISO-NE surveys fossil-fueled generators on a weekly basis in winter to monitor and confirm their current and expected fuel availability. If conditions require more frequent
updates, these surveys may be sent daily. ISO-NE also requests that all natural-gas-fired generators confirm adequate natural gas supply and transportation nominations to meet their day-ahead obligations
during these energy assessments.
Actual Generation Outages and Derates
Seasonal risk assessments are informed by historical data on generation outages and derates. NERC’s Generating Availability Data System (GADS) is one source of information that is used to obtain historical
information of the impact to conventional thermal and hydro generation during winter periods.8 Table 2 and Table 3 show the peak generation outage and derated capacity and proportion to overall fuel-type
nameplate capacity reported to GADS for affected assessment areas during periods of extreme winter weather that occurred in January 2018 and February 2021. Wind and solar generation also experience
outages and derates; however, this data is not collected in the GADS conventional database used for the tables. Wind and solar generation is derated in the WRA to account for ambient light and expected
weather conditions around the time of peak demand (i.e., peak daily demand in winter occurs in early morning hours or other times of darkness for most areas).
Table 2: February 2021 Peak Generation Outage and Derate 9
Coal fired Nuclear Natural Gas Fired
Area MW Percent MW Percent MW Percent
MISO 7,202 13% 2,129 10% 9,323 16%
SERC-Central 564 3% - - 1,185 9%
SERC-Southeast 914 5% - - 3,383 9%
SPP 6,219 17% - - 13,589 42%
Texas RE-ERCOT 3,680 27% 1,181 23% 22,566 38%
WECC-NWPP-US & RMRG 1,968 10% - - 1,285 6%
Table 3: January 2018 Peak Generation Outage and Derate10
Coal fired Nuclear Natural Gas Fired
Area MW Percent MW Percent MW Percent
MISO 7,327 14% 1,570 8% 7,547 13%
NPCC-New York 177 11% - - 6,130 37%
PJM 12,186 23% - - 2,500 5%
SERC-East 507 3% 932 8% 292 2%
SERC-Florida Peninsula 695 8% - - 356 1%
SERC-South East 4,137 21% - - 4,610 12%
SPP 1,434 4% - - 10,664 33%
Texas RE-ERCOT 1,092 8% - - 10,696 18%
7 ISO-NE’s 21-Day Energy Forecast and Report: https://www.iso-ne.com/isoexpress/web/reports/operations/-/tree/21-Day-Energy-Assessment-Forecast-and-Report-Results
8 See NERC Generating Availability Data System: https://www.nerc.com/pa/RAPA/gads/Pages/GeneratingAvailabilityDataSystem-(GADS).aspx
9 These are the maximum derates and outages reported in GADS in the affected areas during the Texas and Southcentral United States cold weather event that took place February 8–20, 2021.
10 These are the maximum derates and outages reported in GADS in the affected areas during the January 2018 Southcentral Cold Event from January 15–19, 2018. Details can be found in the event report:
https://www.nerc.com/pa/rrm/ea/Documents/South_Central_Cold_Weather_Event_FERC-NERC-Report_20190718.pdf2021–2022 Winter Reliability Assessment 11
Seasonal Risk Assessments for Other Areas
Extreme generation outages and peak loads similar to those experienced in February 2021 are reliability risks in MISO, SPP, and Texas RE-ERCOT areas for the upcoming winter. Seasonal risk scenarios detailing
these areas are shown in Figure 4. Under studied conditions for these areas, grid operators would need to employ operating mitigations or energy emergency alerts (EEAs) to obtain resources necessary to meet
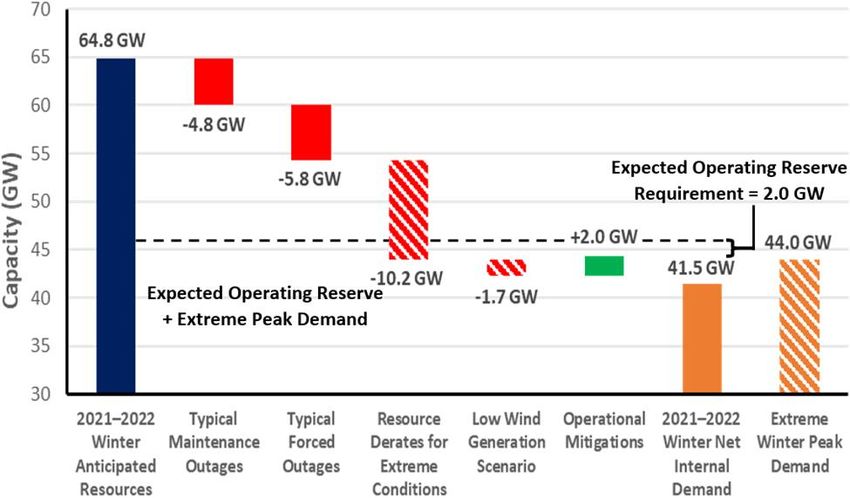
extreme peak demands. Table 4 describes the various EEA levels and the circumstances for each.
Table 4: Energy Emergency Alert Levels
EEA Level Description Circumstances
The BA is experiencing conditions where all available generation resources are committed to meet firm load, firm transactions,
EEA 1 All available generation resources in use and reserve commitments and is concerned about sustaining its required contingency reserves.
Non-firm wholesale energy sales (other than those that are recallable to meet reserve requirements) have been curtailed.
The BA is no longer able to provide its expected energy requirements and is an energy deficient BA.
EEA 2 Load management procedures in effect An energy deficient BA has implemented its operating plan(s) to mitigate emergencies.
An energy deficient BA is still able to maintain minimum contingency reserve requirements.
EEA 3 Firm Load interruption is imminent or in progress The energy deficient BA is unable to meet minimum contingency reserve requirements.
MISO SPP Texas RE-ERCOT
Figure 4: MISO, SPP, Texas RE-ERCOT Seasonal Risk Scenarios2021–2022 Winter Reliability Assessment 12 Note: The left blue column shows anticipated resources (from the Demand and Resource Tables), and the two orange columns at the right show the two demand scenarios of the normal peak net internal demand from the resource adequacy data table and the extreme winter peak demand—both determined by the assessment area. The middle red or green bars show adjustments that are applied cumulatively to the anticipated resources. MISO Expected resources meet operating reserve requirements under the normal peak-demand scenario. Above-normal winter peak load and outage conditions could result in the need to employ operating mitigations (i.e., demand response, transfers, and short-term load interruption). EEAs may be needed under extreme peak demand and outage scenarios studied. In MISO’s seasonal risk scenario, typical maintenance outages and forced outages are derived from the averages over the past five years. The resource derates in extreme conditions are the maximum outages that occurred in the last five years. The two demands shown for MISO in Figure 4 are the net internal demand (50/50) and the extreme winter peak demand (90/10) that are derived from demand forecasts with 30 years of historical data. More information about the seasonal risk scenario data description can be found in Table 1. SPP Expected resources meet operating reserve requirements under the normal peak-demand scenario. Above-normal winter peak load and outage conditions could result in the need to employ operating mitigations (i.e., demand response, transfers, and short-term load interruption). EEAs may be needed under extreme peak demand and outage scenarios studied. During winter storm Uri, operators received 3.9 GW of imports to help reduce the amount of firm load shed required to balance supply and demand. Texas RE-ERCOT Expected resources meet operating reserve requirements under the normal peak-demand scenario. Above-normal winter peak load and outage conditions could result in the need to employ operating mitigations (i.e., demand response, transfers, and short-term load interruption). EEAs may be needed under the extreme peak demand and outage scenarios studied. In the seasonal risk scenario, typical maintenance outages and forced outages are based on historical averages for December through February from the previous three winter seasons, except for February 15–28, 2021. The resource derates for extreme conditions red bar in Figure 4 includes actual outage rates from winter storm Uri. The two demands shown for Texas RE-ERCOT in Figure 4 are the net internal demand (50/50) and the extreme winter peak demand (winter storm Uri projected peak). More information about the seasonal risk scenario data description can be found in Table 1. Other Areas Seasonal risk scenarios for each assessment area are presented in the Regional Assessments Dashboards section. The on-peak reserve margins and seasonal risk scenario chart in each dashboard provide potential winter peak demand and resource condition information. The reserve margins on the right side of the dashboard pages provide a comparison to the previous year’s assessment. The seasonal risk scenario charts present deterministic scenarios for further analysis of different demand and resource levels with adjustments for normal and extreme conditions. The assessment areas determined the adjustments to capacity and peak demand based on methods or assumptions that are summarized below the seasonal risk scenario charts; see the Data Concepts and Assumptions for more information about this chart. The seasonal risk scenario charts can be expressed in terms of reserve margins. In Table 5, each assessment area’s Anticipated Reserve Margins are shown alongside the reserve margins for a typical generation outage scenario (where applicable) and the extreme demand and resource conditions in their seasonal risk scenario. The typical outages reserve margin is comprised of anticipated resources, less the capacity that is likely to be in maintenance or forced outage at peak demand. If the typical maintenance or forced outage margin is the same as the anticipated reserve margin, it is because an assessment area has already factored typical outages into the anticipated resources. The extreme conditions margin includes all components of the scenario and represents the most severe operating conditions of an area’s scenario. Note that any reserve margin below zero indicates that the resources fall below demand in the scenario.
2021–2022 Winter Reliability Assessment   13

             Table 5: Seasonal Risk Scenario Anticipated Reserve Margins
                                                                    Anticipated Reserve Margin
                                             Anticipated Reserve
                             Anticipated                            with Demand, Outages, and
     Assessment Area                         Margin with Typical
                           Reserve Margin                               Derates for Extreme
                                                   Outages
                                                                            Conditions
MISO                                 48.5%                  20.5%                         -1.2%
MRO-Manitoba                         17.2%                  14.2%                          4.2%
MRO-SaskPower                        19.3%                  16.1%                         11.6%
NPCC-Maritimes                       26.5%                  19.9%                         -2.1%
NPCC-New England                     71.1%                  55.3%                         16.8%
NPCC-New York                        78.6%                  58.4%                         33.5%
NPCC-Ontario                         20.0%                  20.0%                         21.3%
NPCC-Québec                          12.4%                   9.8%                          0.6%
PJM                                  42.0%                  29.1%                         11.3%
SERC-Central                         32.5%                  24.4%                          9.3%
SERC-East                            25.9%                  20.6%                          4.3%
SERC-Florida Peninsula               35.4%                  29.7%                         23.2%
SERC-Southeast                       38.7%                  31.6%                         21.1%
SPP                                  56.4%                  30.9%                          0.8%
Texas RE-ERCOT                       41.9%                  26.8%                        -37.1%
WECC-NWPP-AB                         34.7%                  28.6%                          8.3%
WECC-NWPP-BC                         17.9%                  17.8%                         -0.6%
WECC-CA/MX                           40.3%                  33.3%                         12.3%
WECC-NWPP-US & RMRG                  27.1%                  26.6%                         -1.5%
WECC-SRSG                           103.3%                  93.3%                         56.5%
2021–2022 Winter Reliability Assessment 14
NERC Level 2 Alert: Cold Weather Preparations for Extreme Weather Events
Pursuant to Section 810 of its Rules of Procedure,11 NERC issued the Level 2 industry recommendation—Cold Weather Preparations for Extreme Weather Events—on August 18, 2021. NERC Level 2 industry
recommendations, also known as Level 2 alerts, provide specific recommended actions that registered entities should consider in response to a particular issue. They are not, however, the same as a Reliability
Standard, which contains mandatory obligations and carry penalties for failure to adhere to requirements. The Level 2 alert also contains reporting obligations for entities.
NERC’s cold weather Level 2 alert was directed at RC, BA, TOP, and GO functional groups and recommended the following five actions: 12
RCs, BAs, and TOPs should create or add to seasonal operating plans for the upcoming winter season at least two months before their winter season with special emphasis on meeting extreme cold
weather energy requirements (while also considering resource limitations, such as extreme cold temperatures for a prolonged period of time along with the effects that icing and snow impacts may have
on equipment, etc.) Energy aspects of this plan should be informed and updated as per seasonal planning operating plans. RCs, BAs, and TOPs should communicate these plans to GOs within their
operating area. Winter seasonal operating plans should include specific considerations listed in the Level 2 alert.
RCs, BAs, and TOPs should continue, in real-time, especially during periods of extreme cold weather, activities that promote a high-level of situational awareness related to regional energy.
GOs should review RCs, BAs, and TOPs seasonal operating plans to ensure they contain the current generator availability, fuel supplies, and other related assumptions. Actions should be taken as
appropriate based on weather forecasts, resulting capacity, and energy analyses to facilitate readiness while allowing adjustments to be made so there is time for GOs to make the necessary arrangements
to maximize the availability of the resources, including, but not limited to, the replenishment of fuel, supplies, labor, and equipment. GOs should maintain communications with fuel suppliers and be
prepared to manage resources with fuel switching.
GOs with wind and solar resources should communicate with RCs, BAs, and TOPs regarding units with cold weather packages, such as de-icing capability, to better assess generating unit availability.
GOs should communicate forecast and actual unit derates to their RCs, BAs, and TOPs during extreme cold weather events and conditions considering the following factors: unavailability due to weather,
fuel constraints (natural gas restrictions), derates for alternate fuels, and potential concerns with increased outages or delayed starts based on unit ambient ratings and historical performance. These
communications should be part of the seasonal, outage coordination, day-ahead, and real-time energy assessments.
RCs, BAs, and TOPs should incorporate the generation unit derate information into their generation capacity, energy analyses, and operating plans. Factors to consider include unavailability due to
weather, fuel constraints (natural gas restrictions and refueling limitations), derates for alternate fuels, potential concerns with increased outages or delayed starts based on unit ambient ratings (including
accounting for the effect of precipitation and accelerated cooling effect of wind, etc.), and historical performance.
For manual and automatic load shedding, the following should be completed:
RCs, BAs, and TOPs manual and automatic load shedding plans should review critical interdependent subsector electrical loads (as defined by each entity) to avoid being included as part
of automatic (i.e., under-frequency) or manual load shedding. This review should be factored into seasonal preparation plans.
RCs, BAs, and TOPs should confirm and test manual load shedding processes and capability periodically. These processes and capabilities should be updated with the most recent load
forecasts. If these load shedding processes are called upon during real-time operations, they should be monitored during execution as well as recovery.
RCs, BAs, and TOPs should track demand response capability and verify that critical interdependent subsector loads are excluded. Operating plans should also take into consideration any
limitations on the duration and magnitude of demand response capabilities.
11 Section 810 of the Rules of Procedure (“Information Exchange and Issuance of NERC Advisories, Recommendations and Essential Actions”) outlines the requirements for industry’s response to recommendations.
12 The alert is available here: https://www.nerc.com/pa/rrm/bpsa/Alerts%20DL/NERC%20Alert%20R-2021-08-18-01%20Extreme%20Cold%20Weather%20Events.pdf2021–2022 Winter Reliability Assessment 15
GOs should conduct dual fuel assessments to ensure resources can switch to the alternate fuel and
monitor how much alternate fuel is on site. GOs should also assess generating unit weatherization
plans; the implementation of freeze protection measures and factors that could impact availability,
including minimum operating temperature; and the application of heat tracing equipment and wind
breaks. GOs should inspect and maintain their weatherization measures ahead of the upcoming winter
season before the onset of and during extreme cold weather conditions.
6,526 MW
In addition to the previous listed five recommendations, the Level 2 alert contained several questions for
registered entities. Responses indicate that operating plans for winter are in place, but generator resource < 50 MW
availability could again suffer as a result of equipment failure or lack of fuel under severe winter conditions. All 4,746 MW
RCs responded that their organizations developed operating plans that are closer to real-time (2–3 days ahead)
and that these plans address the operating conditions, such as cancellation of outages, generator starting, 6,877 MW
operating forecasts, and ramping requirements. TOPs also reported a very positive outlook: 80% of TOPs
responded that they have or will conduct a seasonal assessment, including weatherization, equipment, and
transfer capability. However, BAs and GOs were mixed in their responses with many entities indicating they did
not plan to coordinate with fuel providers, conduct fuel surveys, or reinforce weatherization capabilities. 2,595 MW
3,056 MW
Entities provided an assessment of their generation capacity that will be unavailable due to extreme cold
weather conditions. The assessed unavailable capacity of the 197 GOs that indicated they have no plans or
partial plans to perform weatherization surveys is 23,850 MW (see Figure 5 for a regional summary). The MW
values displayed in Figure 5 represent assessed generating capacity without weatherization in each RE that is
at risk in extreme weather. Details of the BA and GO responses are located in Appendix A: NERC Level 2 Alert
Questions and Responses. The responses indicate the importance for grid operators to be prepared to
implement their operating plans to manage potential supply shortfalls in extreme weather. Figure 5: Assessed Unavailable Capacity due to Insufficient
Weatherization Plans2021–2022 Winter Reliability Assessment 16
Coal Stockpiles
Coal delivery problems by rail can impact the operation of coal-fired electricity generation; likewise, the economics of electricity and energy markets can affect coal supplies. Coal supplies in North America are
being affected by the current global energy shortage. Coal stockpiles at individual utilities have trended quickly downward in the last few months as seen in Figure 6, after a build-up since last winter.13 At the end
of August, the “average days of burn” (shown as a dotted red line in Figure 7) at U.S. power plants was around 85 days based on stockpiles and consumption patterns. This level is not concerning, however a
colder than normal winter and high natural gas prices could lead to higher coal consumption and stockpile depletion. Grid operators and assessment areas are monitoring coal resource availability. For example,
PJM has initiated the Generation Resource Weekly Fuel Inventory and Supply Data Request that applies to all coal and oil resources. The on-site stockpiles provide fuel and energy assurance that contributes to
plant availability and system resilience during extreme weather.
Figure 6: Coal Stocks by Type, January 2009—August 2021
Figure 7: Days of Burn by Non-lignite Coal, January 2010—August 2021
13 EIA Electric Power Sector Coal Stocks: https://www.eia.gov/electricity/monthly/update/coal-stocks.php2021–2022 Winter Reliability Assessment 17
Dual-Fuel Generation
During peak cold temperatures, natural gas supplies may be limited by an increased demand from both electricity generation and consumer space heating needs. However, natural gas generators equipped with
dual-fuel capability and supplies of back-up fuel can mitigate the risks associated with limited natural gas supplies during these periods of high demand. Figure 8 shows the total reported natural gas generating
capacity with the portion of dual fuel capability by assessment area. GOs must make preparations for their units to run on back up fuels well in advance. Not only must sufficient fuel be procured, stored, and
maintained for use, but generating and auxiliary equipment must be prepared for fuel transition. The capacities shown in Figure 8 reflect the installed dual fuel capability in each area but may not accurately
reflect readiness to operate. Grid operators should also factor in the potential for constrained supply chains to affect fuel and other logistical needs in their operational planning for use of generation with back-
up fuels.
Figure 8: Dual Fuel Generation by Assessment Area2021–2022 Winter Reliability Assessment 18
Probabilistic Studies of Winter Reliability Risks
Planners are incorporating sophisticated analysis to identify energy shortfall risks as the generation mix and demand profile becomes increasingly complex. Variable energy resources like wind, solar, and some
types of hydro can introduce new periods besides the peak demand hour where there is risk of electricity supplies being insufficient for demand. Likewise, generation outages and fuel limitations alter expected
performance of thermal generators. Probabilistic resource adequacy studies can be designed to account for generation and demand characteristics at hourly resolutions and identify the likelihood and severity
of energy shortfall. For the upcoming winter, probabilistic studies were performed by planners in several areas.
NPCC Winter Multi-Area Probabilistic Reliability Assessment
A comprehensive probabilistic study of winter resource adequacy is performed annually by planners in the NPCC RE. While final results for the 2021–2022 winter will be published by NPCC in December as part
of the NPCC Winter Reliability Assessment, preliminary results indicate there is a low risk of energy shortfall this winter.
Modeling includes a base case of 50/50 peak demand and resource conditions and one or more scenario cases that involve severe demand and low-resource conditions. The NPCC Winter Reliability Assessment
also takes into account transfer capabilities with neighboring assessment areas and operating procedures that grid operators use to manage capacity or energy shortfalls. In preliminary results for the 2021–2022
winter season, no unserved energy or load loss hours were identified and all system energy needs were met in the base case and nearly all extreme scenarios (i.e., no expected unserved energy). The scenario
with the highest loads and lowest resource availability found energy risk in NPCC-Maritimes, which is also the area with lowest winter Planning Reserve Margins. The final results of NPCC study will be published
in December.14
Texas RE-ERCOT Probabilistic Risk Assessment
Planners performed a probabilistic resource adequacy assessment for the winter season and determined there is low risk of energy shortfall. However, risk is closely tied to the likelihood of an exceptional winter
event, such as winter storm Uri.
The model for this assessment has the following main attributes:
For a winter peak load day, Monte Carlo simulations determine a forecasted level of operating reserve.
The hourly range simulated is 7:00 a.m.–9:00 p.m. local time to capture typical morning and evening demand peaks and associated wind and solar ramps.
For each hour, the model calculates the probability that simulated operating reserves are at or below various risk thresholds for EEA declarations, including firm load shed.
Based on a given probability of occurrence of an exceptional winter storm event (at least as severe as February’s winter storm Uri), the impacts to load, thermal outages/derates, and wind/solar
capacity contributions are simulated with probability distributions.
Based on model results for a 0.5% probability of an exceptional winter storm event, the probability of EEA events for the highest-risk hour (8:00 a.m. local time) is approximately 0.7%. This probability varied little
across the other hours. Increasing the likelihood of an exceptional winter storm event to 1% caused the risk of EEA events to rise to slightly above 1%.
14 NPCC seasonal assessment reports are published: https://www.npcc.org/library/reports/seasonal-assessment2021–2022 Winter Reliability Assessment 19 MRO-SaskPower Probabilistic Capacity Adequacy Assessment SaskPower performed a probability-based capacity adequacy assessment for the winter of 2021–2022 that includes the following: generation forced outages of 300 MW or greater, extreme peak loads, and available transfer capability from neighboring areas. Based on the capacity adequacy assessment results, they may have to rely on demand response programs (implemented within 12 minutes to 2 hours) and potential load interruptions in November, December, and February months for the winter of 2021–2022 under extreme peak loads. Based on results from generation forced outage models, the probability for exceeding 300 MW of generation forced outages is around 9%. Additional probabilistic studies can be found in other NERC reliability assessment reports. All assessment areas perform probabilistic studies of future years for NERC’s biennial probabilistic assessments. Results of the 2020 Probabilistic Assessment were published in the 2020 LTRA.15 Additionally, all areas performed tailored analysis of more extreme conditions. These can be found in the Probabilistic Assessment Regional Risk Scenarios Report.16 15 https://www.nerc.com/pa/RAPA/ra/Reliability%20Assessments%20DL/NERC_LTRA_2020.pdf 16 https://www.nerc.com/comm/RSTC/PAWG/2020%20ProbA%20Regional%20Risk%20Scenarios%20Report_final_approved.pdf
2021–2022 Winter Reliability Assessment                                         20
Regional Assessments Dashboards
The following assessment area dashboards and summaries were developed based on data and narrative information collected by NERC from the six REs on an assessment area basis. The operational risk analysis
shown in the Regional Assessments Dashboards provides a deterministic scenario for understanding how various factors affecting resources and demand can combine to impact overall resource adequacy. For
each assessment area, the left blue column shows anticipated resources (from the Demand and Resource Tables), and the two orange columns at the right show the two demand scenarios of the normal peak
net internal demand from the Demand and Resource Tables and the extreme winter peak demand determined by the assessment area. The middle red or green bars show adjustments that are applied
cumulatively to the anticipated resources. Adjustments may include reductions for typical generation outages (maintenance and forced not already accounted for in anticipated resources) and additions that
represent the quantified capacity from operational tools, if any—that are available during scarcity conditions but have not been accounted for in the WRAreserve margins. Resources throughout the scenario are
compared against expected operating reserve requirements that are based on peak load and normal weather. The cumulative effects from extreme events are also factored in through additional resource derates
or low-output scenarios.
2021–2022 Winter Reliability Assessment                                             21

                                                                                                                                                                                       On-Peak Reserve Margins
                                                 Highlights                                                                                                                                        MISO

                                                    MISO continues to survey and coordinate with its members on winter preparedness and fuel sufficiency. In
                                                       addition, MISO is filing changes to the resource adequacy construct to implement a seasonal resource
                                                       adequacy construct and seasonal unit accreditation to better affirm adequate supply in all seasons,
                                                       acknowledging that resource adequacy risk is not limited to the summer system peak season.

MISO                                                Though risk has been identified for this upcoming winter season in a high generation outage and high winter
                                                       load scenario, MISO operators anticipate that system reliability can be maintained by the use of
The Midcontinent Independent System
                                                       measures that include load modifying resources, energy-only interconnection service resources not
Operator, Inc. (MISO) is a not-for-profit,
member-based organization that administers             included in their capacity resources, internal transfers, and non-firm transfers into the system when
wholesale electricity markets that provide             necessary and available. MISO continues to coordinate with neighboring RCs and BAs to improve
customers with valued service; reliable, cost-         situational awareness and vet any needs for firm or non-firm transfers to address extreme system
effective    systems    and      operations;           conditions.
dependable and transparent prices; open
access to markets; and planning for long-
term efficiency.                                                                                                                                                                       2020–2021            2021–2022
                                                 Risk Scenario Summary
MISO manages energy, reliability, and
                                                 Expected resources meet operating reserve requirements under normal peak-demand scenarios. Above-normal winter
operating reserve markets that consist of 36
local BA and 394 market participants, serving
                                                 peak load and outage conditions could result in the need to employ operating mitigations (i.e., demand response and
approximately 42 million customers.              transfers) and EEAs, including load shed, may be needed under extreme peak demand and outage scenarios studied.
Although parts of MISO fall in three REs, MRO
is responsible for coordinating data and
information submitted for NERC’s reliability
                                                                              Risk-Period Scenario
assessments.                                                                                                                         Scenario Description (See Data Concepts and Assumptions)
                                                                                                                                        Risk Period: Highest risk for unserved energy at peak demand hour
            On-Peak Fuel Mix
                                                                                                                                        Demand Scenarios: Net internal demand (50/50) and (90/10) demand forecast using 30
                                                                                                                                           years of historical data
                                                                                                                                        Maintenance Outages: Rolling five-year winter average of maintenance and planned
                                                                                                                                           outages
                                                                                                                                        Forced Outages: Five-year average of all outages that were not planned
                                                                                                                                        Extreme Derates: Maximum of last five years of outages
                                                                                                                                        Operational Mitigations: A total of 2.4 GW capacity resources available during extreme
                                                                                                                                           operating conditions
2021–2022 Winter Reliability Assessment 22
On-Peak Reserve Margins
Highlights MRO-Manitoba Hydro
The Manitoba Hydro assessment area has no COVID-19 related reliability issues for the upcoming season. As of
the beginning of September 2021, the COVID-19 Pandemic situation in Manitoba appears stable with the
implementation of provincial health orders. While the COVID-19 Pandemic is expected to be present over the
winter assessment period, as a result of corporate due diligence, impacts on BPS reliability are not anticipated.
MRO-Manitoba Hydro Although water supply conditions are below average in the southern portion of the watershed supplying
Manitoba Hydro hydroelectric generation, reservoir storage levels are adequate to withstand the reoccurrence
Manitoba Hydro is a provincial crown
corporation that provides electricity to about
of the worst drought in its 109-year hydraulic record
580,000 customers throughout Manitoba and Three Keeyask units are operational and by the end of the year, two additional units are expected to be in
natural gas service to about 282,000 customers service (93 MW per unit).
in various communities throughout Southern
Manitoba. The Province of Manitoba has a
population of about 1.3 million in an area of
250,946 square miles. 2020–2021 2021–2022
Manitoba Hydro is winter-peaking. No change Risk Scenario Summary
in the footprint area is expected during the Expected resources meet operating reserve requirements under the assessed scenarios.
assessment period. Manitoba Hydro is its own
Planning Coordinator and Balancing Authority.
Manitoba Hydro is a coordinating member of
MRO-Manitoba Hydro
MISO. MISO is the Reliability Coordinator for
Risk-Period Scenario
Manitoba Hydro. Scenario Description (See Data Concepts and Assumptions)
On-Peak Fuel Mix Risk Period: Highest risk for unserved energy at peak demand hour
Demand Scenarios: Net internal demand (50/50) and minimum probability of
exceedance forecast load
Outages: Accounts for average forced outages, including 69 MW of reduced
generation capacity due to drought conditions
Operational Mitigations: Recall 100 MW of planned generator maintenanceYou can also read