A database of submarine landslides offshore West and Southwest Iberia - Nature
←
→
Page content transcription
If your browser does not render page correctly, please read the page content below
www.nature.com/scientificdata

               OPEN           A database of submarine landslides
Data Descriptor               offshore West and Southwest Iberia
                                                     1✉
                              Davide Gamboa              , Rachid Omira1,2 & Pedro Terrinha1,2

                              Submarine landslides are major geohazards occurring on distinct seabed domains ranging from shallow
                              coastal areas to the deeper points of the ocean. The nature and relief of the seabed are key factors
                              influencing the location and size of submarine landslides. Efforts have recently been made to compile
                              databases of submarine landslide distribution and morphometry, a crucial task to assess submarine
                              geohazards. The MAGICLAND (Marine Geo-hazards Induced by underwater Landslides in the SW Iberian
                              Margin) database here presented contributed to that assessment offshore Portugal. Based on EMODnet
                              bathymetric DEMs and GIS analysis, the morphometric properties of 1552 submarine landslides were
                              analysed and wealth of 40 parameters was obtained. This dataset is now made available for the free
                              use and benefit of the international marine community. Further contributions or analysis based on, and
                              complementing the MAGICLAND database will be welcome.

                              Background & Summary
                              Submarine mass movements are common occurrences on marine domains, from the shallow coasts to the deepest
                              areas of the oceans1. The resulting landslides can be characterised by a variety of deposit features and morphol-
                              ogies, influenced by the mechanic properties of the original strata, the dynamics of the flow processes, regional
                              geology and seismicity. Although singular massive deposits attract the attention for detailed studied, the regions
                              where they occur can record geological evidence of hundreds or thousands of smaller-scale landslides, often
                              poorly covered by available data and of limited focus of analysis.
                                  Submarine landslides are a primary geohazard in marine environments. Tsunamis generated from landslides
                              on the flank of subaerial topography flowing into the sea2, or from large collapses on fully submerged mor-
                              phologic features3 are a major concern. Moreover, geotechnical installations and infrastructures resting on the
                              seafloor such as submarine communication cables, pipelines or any purpose-build platform are sensible to mass
                              movements4. Submarine landslides impact in marine biological communities, either by acting as habitat hotspots
                              on their scars and remobilised elements or by disturbing and modifying seafloor ecology during emplacement5.
                              Recognising submarine landslide extents has further political implication as these are used to set international
                              ZEE boundaries under the definition of the UN Convention on Law of the Sea6. It is thus crucial to understand
                              the distribution patterns and morphometric trends of submarine landslides according to the regional setting in
                              which they occur, and aim to unravel insights on their causes and deposits1,7.
                                  Efforts have been made to compile databases of submarine landslides to better understand their distribu-
                              tion and characteristics in marine settings around the world1,7. Regional compilations are available from the
                              US Atlantic margin8,9, the Mediterranean Sea10, the Spanish margins11 or Australia12. Global data compilations
                              have also allowed the comparison of landslides in distinct geological settings7,13,14. However, extensive submarine
                              landslide characterisation is still lacking in many continental margins, and adequate characterisation depends on
                              the quality of available data. Such is the case of the West and Southwest Iberian Margin, on the Northeast Atlantic
                              Margin. This is an area of relevant geological risk, with frequent seismic activity resultant from the NW-ward
                              collision of the African and European tectonic plates15,16. This has led to the occurrence of several high magnitude
                              earthquakes (Mw > 7), of which the 1755 Lisbon Earthquake and tsunami is one of the major documented natural
                              disasters17. Furthermore, the chains of large seamounts that occur in the area create major bathymetric features
                              rising up to five kilometres above from the abyssal plain depths16, and are associated to intermediate to high
                              seismicity, which is known to be a landslide trigger. Instability susceptibility studies conducted on the study area
                              indicate that large extents of the continental slope and seamounts are prone to failure18,19. Yet, few submarine
                              landslide studies exist, and these focused on specific case studies3,20–22.

                              1
                                Instituto Português do Mar e de Atmosfera – IPMA, I.P.; Rua C do Aeroporto, 1749-077, Lisbon, Portugal. 2Instituto
                              D. Luiz – IDL, Faculdade de Ciências da Universidade de Lisboa, Campo Grande, Edifício C8, Piso 3, 1749-016, Lisbon,
                              Portugal. ✉e-mail: davide.gamboa@ipma.pt

  Scientific Data |   (2021) 8:185 | https://doi.org/10.1038/s41597-021-00969-w                                                                 1
www.nature.com/scientificdata/ www.nature.com/scientificdata
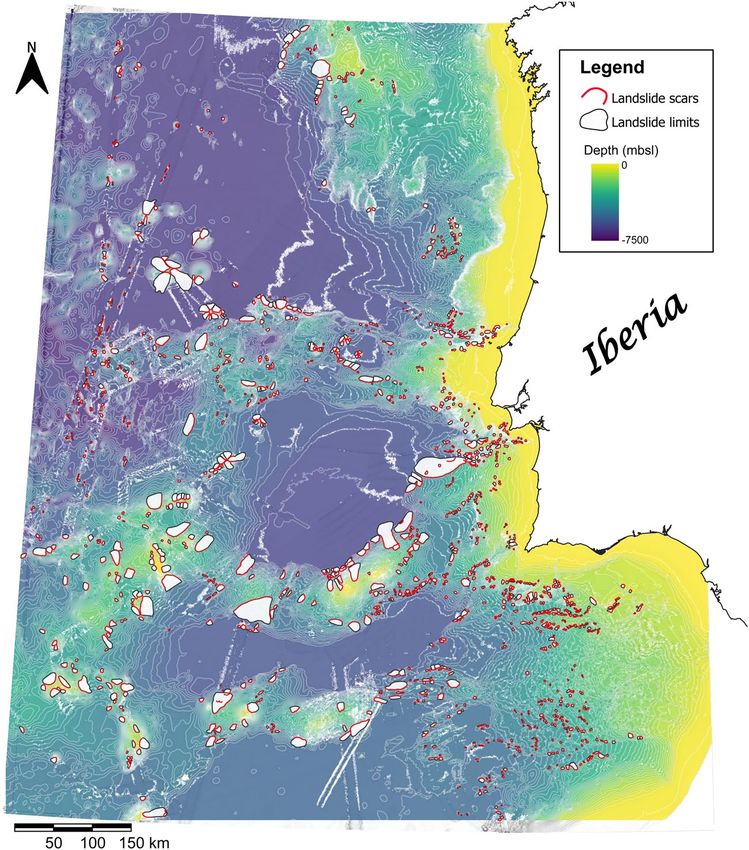
Fig. 1 Map of the study area offshore West and Southwest Iberia shown as a blend of the bathymetry and slope
gradient rasters. The red lines trace the limit of morphological scars identified on the EMODnet 2018 DEM.
The grey polygons adjacent to the scars depict the landslide area, but only major ones are discernible at the scale
presented. Contour lines were calculated from the DEM using a spacing of 100 m.
Fig. 2 Workflow diagram of the submarine landslide mapping and analysis procedure used to compile the
MAGICLAND database.
Scientific Data | (2021) 8:185 | https://doi.org/10.1038/s41597-021-00969-w 2www.nature.com/scientificdata/ www.nature.com/scientificdata
Parameter Unit Description
Scar_ID — Unique identifier of the landslide feature
Confidence — Confidence of the landslide mapping quality - classified as 1, 2 or 3.
MultiScar — Y = mapped scar item includes coalesced scar; N = only a single scar is mapped
X — X position of the landslide data point in decimal degrees
Y — Y position of the landslide data point in decimal degrees
Reference value of depth below the seafloor of the landslide. All depth information records are
D m
presented as negative values.
Lt km Total lenght mapped on the raster using a 2D map perspective
Lt-r km “Realistic” total lenght derived from the projection of Lt on the 3D surface
Lt/Lt-r % Ratio, in percentage, between the Lt-r and Lt parameters
Lt-rAvSlp deg Average slope grandient of Lt-r along the landslide remobilisation direction
Wm km Width mapped on the raster using a 2D map perspective
Wm-r km “Realistic” width value derived from the projection of Wm on the 3D surface
Lt/Wm — Length-Width ratio
Lt-r/Wm-r — Length-Width ratio calculated using the realistic measurement
Pt km Perimeter of the full landslide-delimiting (evacuation and deposit, if present) polygon
At km2 Area of the landslide calculated within the polygon
At-r km2 Realistic surface area of the landslide derived from the 3D DEM
Ls km Lenght of the landslide scar (alternatively, scar perimeter)
Ls-r km Scar lenght measured along the 3D surface
Sins — Sinuosity of the line delimiting the landslide scar
AvgDs m Avegerage depth of the landslide scar
Dmin m Minimum depth recorded, either at the lower limit of the scarp or toe of the deposit (if present)
Dmax m Maximum depth recorded, typically at the upslope limit of the scar.
Height of the landslide, calculated as the difference between minimum depth at the downslope
Ht m
limit of the deposit or scar (Dmin), and maximum upslope limit of the scar (Dmax)
Ht/Lt — Height-Lenght ratio
Lt/Ht — Lenght-Height ratio
V km3 Calculated volume evacuated by the landslide (equivalent to cut volume)
Ld km Lenght of the deposit segment
Ld-r km Realistic lenght of the deposit
Ld-rAvgSlp deg Average slope of the deposit
AvgDd m Average depth of the deposit
Hd m Height of the deposit
Ad km2 Area of the deposit
Ad-r km2 Realistic area of the deposit
Pd km Deposit perimeter
Le km Lenght of the evacuation section
Le-r km Realistic lenght of the evacuation section
Le-tAvgSlp deg Average slope of the evacuation section
AvgDe m Average depth of the evacuation section
He m Height of the evacuation section
Ae-r km2 Realistic area of the evacuation section
Table 1. List of the morphometric parameters used in the MAGICLAND database.
It is thus crucial and timely to provide a broader perspective of the distribution and morphometric trends of sub-
marine landslides offshore Iberia. This work presents the MAGICLAND (Marine Geo-hazards Induced by under-
water Landslides in the SW Iberian Margin) database, which covers the geographical area from 33° 45′ N to 43° N
and from 6° 22′ W to 16° 15′ W, and compiles geomorphological data of 1552 submarine landslides based on the
interpretation of DEM bathymetric grids provided by EMODnet23 (Fig. 1). Our results are crucial to understand the
broad distribution of geohazards in the area, and aim to contribute to global efforts to compile landslide information
in different geological and oceanic settings. This dataset is openly available through the Open Science Framework
data repository24 for the use and benefit of the international marine and geohazard community. Further contribu-
tions or analyses based on, and complementing the MAGICLAND database will be welcome.
Methods
This section describes the methodology workflow used for data acquisition and preparation. This was set in three
main stages, namely the Digital Elevation Model (DEM) data loading, the manual digitizing of landslide features,
and volume calculation procedures. The main steps for each stage are summarised in Fig. 2.
Scientific Data | (2021) 8:185 | https://doi.org/10.1038/s41597-021-00969-w 3www.nature.com/scientificdata/ www.nature.com/scientificdata
Fig. 3 Schematic diagram of analysed landslide parameters. (a) Profile view along the landslide run-out,
including the subdivision between the evacuation and deposit sections. Horizontal length lines at the top
represent measurements based on a map perspective, while the dashed red lines represent realistic length
measurements projected to the DEM 3D relief. The Height value represents the vertical different between the
minimum depth at the scar upslope limit and maximum depth at the termination. (b) Perspective diagram
representing the areal morphometric parameters analysed.
DEM loading and referencing. The mapping of scars and landslide features was based on the 2018 version
of the EMODnet DTM (or DEM) for European seas covering the West and Southwest Iberian margins23 (Fig. 1),
respectively referred to as WIM and SWIM. The EMODnet datasets result from the compilation of numerous
bathymetric surveys made available by providers of 24 European countries, and include satellite derived bathym-
etry information derived from Landsat 8 imagery. Despite a general harmonization of the EMODnet data the
density (and resolution) of its coverage is variable, a consequence of the data collection procedures and sur-
vey resources19. For this work, we used the XYZ data version of the EMODnet 2018 F3 DTM tile23 with a gen-
eral 1/16 × 1/16 arc minutes grid, which at the latitude of Iberia corresponds to a resolution of approximately
115.6 m × 115.6 m. The XYZ data were loaded in the GIS software to produce DEM bathymetry and slope map
rasters. Both rasters were reprojected from the WGS84 projection (EPSG:4326), used as default by EMODnet,
to the WGS 84 UTM29N coordinate system (EPSG: 32629). All digitizing operations and morphometric meas-
urements are based on the latter, with this also being the default projection system for the data provided in the
repository24.
Landslide morphometric mapping. Mapping of the landslide morphological features observed on the
DEMs was made using 2D and 3D visualisation perspectives on GIS software to delimit the scars and limits.
Landslide morphometric mapping followed, as possible, established criteria1 for direct measurement features
(Table 1 and Fig. 3), complemented by additional morphological and calculated parameters. Each landslides
feature was identified with a unique reference ID (Scar_ID) to which all morphometric parameters recorded as
point, line or polygon shapefiles were associated. Specifically, point features identify the location of each slide
using an XYD reference; line features were used to trace the scar limit, and landslide length and width; and
polygon features to delimit the landslide perimeter and the deposit section (when present or identifiable). The
initial spatial association of these shapefiles used an automated proximity detection between the different fea-
tures. The final merged shapefile was examined for consistency and for the correct match between the different
elements, i.e., to make sure that all lines and polygons were associated to the same reference point and Scar_ID.
This is a crucial quality check step as the automated process is prone to associate erroneous neighbour points in
closely-spaced or overlapping features. The inaccurate records on line and polygon shapefiles derived from the
automated merge were manually edited, and the corrected shapefiles were re-associated using the Scar_ID param-
eter. After the manual interpretation of the features on the DEM, automated processes were used to calculate
additional parameters to populate the database. The parameter list and description are provided in Tables 1 and 2.
In the instances where it was possible to identify the landslide deposit, this was delineated according to the mor-
phological character displayed on the bathymetry and slope DEMs (Fig. 3). A second set of additional parameters
was digitized for the deposit length, width, perimeter and area. The equivalent parameters were determined for
the landslide evacuation section by subtracting the value of the deposit parameters from the total measurements.
Volume calculation. For volume calculation, a new DEM raster was calculated to represent the pre-landslide
morphology (Fig. 2). To produce this reconstructed surface, a copy of the bathymetry raster was created. Next, the
raster was clipped using the landslide limit polygon to remove all morphological data derived from each event.
The data gaps were filled using a multilevel b-spline interpolation, further resampled to a 50 m × 50 m grid. The
low-frequency raster component derived from this calculation was used as the model for pre-landslide morphol-
ogy. All other interpolation product rasters were discarded as they do not produce accurate data for this objective.
The landslide evacuation volume calculations used the original bathymetry and the reconstructed morphol-
ogy DEMs as base and top limiting surfaces, respectively. This operation used the QGis Volume Calculation Tool
plugin, which allows the assignment of individualised polygons to delimit areas of operation. This feature greatly
optimised the volume calculation task, especially taking into account the sample size. By constraining calcula-
tions within each individual landslide limit, the volume calculated for each feature was immediately added to the
corresponding Scar_ID in the attribute table. For this work, we kept the values representative of the volume evac-
uated (cut) by the landslide. The landslide deposit (fill) volume calculated from the two used DEMs was discarded
as it cannot be reliably estimated without subsurface data to identify the correct base of the deposit.
Scientific Data | (2021) 8:185 | https://doi.org/10.1038/s41597-021-00969-w 4www.nature.com/scientificdata/ www.nature.com/scientificdata
Item/Parameter Metadata
Data downloaded from EMODnet data portal (https://www.emodnet-bathymetry.eu/data-products)
Bathymetry raster
Used the XYZ data version of the F3 panel, which was the base for a tight griding to create the work raster.
Slope raster Calculated in QGIS using the “Slope” tool in the Raster terrain analysis options.
Derived from a copy of the bathymetry raster.
Data clipped using the landslide-delimiting polygon (see file MagicLand-areas.shp) to delete all morphometric data
Reconstructed within its limits.
bathymetry raster Surface reconstructed using a multilevel b-spline interpolation, resampled to a 50 m × 50 m grid.
Pre-landslide morphology analysed using the low-frequency raster component resultant from the interpolation
process.
References for each landslide reference point. X and Y indicate numeric coordinates based on the UTM 29 N grid. D
XYD
is depth in metres. Location of the reference point is obtained as a centroid point derived from the landslide scar line.
Interpreted-based attribute with value 1, 2 or 3.
1- High confidence: landslide with clear scarps, limits and features (e.g., deposit blocks)
Confidence 2- Medium confidence: event boundaries partially smoothed or less clear, possibility of scar partially associated with
turbiditic flows.
3- Low confidence: poor limit definition due to smoothing, poor resolution or small size.
All length measurements are derived from bathymetric data, being as close to the maximum run-out path as possible.
Digitization of the length object always followed a downslope direction, i.e., start on the upslope intersection with
the scar limit and terminate at the deepest point identifiable. If bends are present on the flow path, the length was
digitised as a polyline.
Length (total, deposit,
Digitization was done on planview maps, and L* was obtained from the horizontal line using the direct measurement
evacuation segment,
tool from the GIS software.
scar)
Realistic length measurements (L*-r) were obtained using an automated tool that projected the digitized line on the 3D
DEM bathymetry surface. Sampling of values was taken along the full path of the line projected on the 3D surface.
All length measurements of the evacuation segment were obtained by subtracting the deposit length from the total
length.
Width measurement followed, as possible, the recognition of the widest point of the landslide. In wide features
following bent morphologies, the with was digitised as a polyline.
Digitization was done on planview maps, and Wm was obtained from the horizontal line using the direct
Width measurement tool from the GIS software.
Realistic width measurements (Wm-r) were obtained using an automated tool that projected the digitized line on
the 3D DEM bathymetry surface. Sampling of values was taken along the full path of the line projected on the 3D
surface.
Total area measurements were made using a polygon to fully enclose all features associated with one landslide
event. The deposit area was digitized where it was observable. The area of the evacuation segment was obtained by
Area (total, deposit, subtracting the deposit area from the total area.
evacuation segment) Realistic area measurements (A*-r) were obtained using an automated tool that calculated three-dimensional surface
area of the area feature. This area is measured following all of the slopes of the terrain within the delimited polygon,
as opposed to a planimetric area.
Volume was calculated using the QGIS Volume Calculation Tool plugin.
The polygon input layer selected was MagicLand-areas.shp. Using this, the calculations were applied to every
element mapped and the volume values automatically associated to it in the attribute table.
The DEM height layer used was the reconstructed bathymetry raster (MagicLand-ReconstCover.tif)
Volume The base level DEM used was the bathymetry raster (MagicLand-BathymetryXYZ.tif).
An Accurate Approximation Volume Calculation was selected, and the cut/fill counting method used. A sampling
step of 50 was used for both X and Y.
For the purposes of the database, the cut volume (equivalent to the volume removed from the evacuation area) was
kept. The fill volume (roughly equivalent to the deposit) was discarded as calculating the deposit volume from two
DEMs does not provide a minimally reliable value. Only through the use of subsurface data this can be achieved.
Table 2. Metadata summary table for specific data items and parameters.
Data preparation and visualisation. The final data was compiled in a spreadsheet (MagicLand-Data.
xlsx) using the Scar_ID as the data merging attribute. Sequential gaps in the numeric order of this attribute on
the data provided are due to the manual removal of faulty entries which either had erroneous parameters or were
outside of the target area. These erroneous data would ultimately skew any statistical analysis based on the dataset.
Preliminary data for eight representative morphometric parameters are presented in Fig. 4. Logarithmic Y scales
were used, and are recommended, for a better visualisation of parameters with very large ranges of values.
Data Records
The MAGICLAND dataset24, available through the Open Science Framework (https://doi.org/10.17605/OSF.IO/
S96RW), includes a set of files with the shapefiles with the submarine landslide data (points, lines and polygons),
relevant maps in GeoTIFF format, and data records in Microsoft Excel spreadsheets. The shapefiles relative to
the landslide location points, scars and areas are included in the respective zip files. The GeoTIFF files corre-
spond to the base bathymetry DEM (MagicLand-BathymetryXYZ.tiff), slope map (MagicLand-slopemap.tiff),
reconstructed pre-landslide DEM (BathymReconstruct-Resample50x50_LowPassFilter.tiff) and the cover surface
clipped to the landslide area (MagicLand-ReconstCover.tiff). Table 1 describing the morphometric parameters
Scientific Data | (2021) 8:185 | https://doi.org/10.1038/s41597-021-00969-w 5www.nature.com/scientificdata/ www.nature.com/scientificdata
Fig. 4 Boxplots summarizing the observations from eight selected landslide parameters. Logarithmic scales were
used to represent the y-axis of length, width, area and volume for a clearer assessment of the distribution ranges.
analysed and Table 2 with metadata descriptions are also included as in the dataset (MagicLand-Parameters.pdf
and MagicLand-Metadata.pdf). The main data spreadsheet (MagicLand-Data.xlsx) includes the 1552 data entries
and parameters. A subset corresponding to the morphometric properties of the deposit and evacuation regions is
provided on a separate data file (MagicLand-DepositEvacData.xlsx).
Technical Validation
The dataset presented exhibits sources of uncertainty inherent to distinct steps of the data compilation. These can
be attributed to the base dataset used, to the manual interpretation of landslide scars, perimeter, length and width,
and to the measurement accuracy.
Scientific Data | (2021) 8:185 | https://doi.org/10.1038/s41597-021-00969-w 6www.nature.com/scientificdata/ www.nature.com/scientificdata
Fig. 5 Scatter plot representing the impact of slope gradient on the Lt and Lt-r measurement. The Lt/Lt-r ratio
indicates how much the planimetric and 3D-projected length measurements differ, with values closer to 100%
indicating a minimum or no difference. As shown, the lower the slope gradient, the lower the Lt diverges from
the real topographic value Lt-r. The fringes adjacent to the plot axis represent the frequency of registered values.
DEM resolution. The measurements derived from the DEM have an inherent data uncertainty derived from
its resolution. Exact details for the spatial area covered in this analysis are not possible to be provided as the
EMODnet data derives from the compilation of multiple surveys. This may increase inaccuracies and artifacts,
a common issue with bathymetric data25. As the dataset used has a harmonised resolution of 115.6 m × 115.6 m,
features smaller than the specified distances were not identifiable. The lower resolution areas of DEMs can also
compromise the calculated slope values26 as no detailed morphologies are represented. On our dataset this issue
has implications for the mapping and measurement of landslide parameters, particularly towards the western
and southwestern limits. Here, the poorer data resolution is perceptible from the smoothed, less detailed contour
lines (Fig. 1). Consequently, a lower number of landslides were mapped toward the western limits of the DEM.
Interpreter bias and data limitations. The manual interpretation of the morphometric features consists
of digitising lines and polygons close to the perceived morphological limits of the landslide on the DEM. This
process is prone to variation between different individuals and can be influenced by factors such as map resolu-
tion and visualisation scale. While major parameters such as length or height tend to lead to low variability, others
such as width or the delimitation of the evacuation and deposition areas are prone to higher interpreter varia-
bility1. This is prone to happen during replication of our work for parameters defined as single-value landslide
features, such as width, that effectively change along its length. Nevertheless, the high number of samples likely
attenuates the interpreter-derived variability and minimises deviations from the major statistical trends (Fig. 4).
The delimitation of the landslide deposit, when identifiable, is likely underestimated as the DEM only expresses
seafloor morphologies. Consequently, when the landslide deposit is partially or fully buried, the deposit and full
landslide real length may be higher than the values recorded.
Volume calculation. The accurate volume calculation of the 1552 landslides presented the biggest challenge
as we tried to use a uniform method that is applicable to all landslides at once. Interpolated top surfaces across the
landslide scar area is a method successfully used to reconstruct top pre-landslide morphologies in previous studies9,
and this was suitable to use in our database objectives. While on longitudinal sections the reconstructed surface has
adequate matches with the landslide limits on the bathymetry DEM, transverse sections clipped to the landslide limits
may intersect the sidewall at points below its apex. Thus, absolute volume calculation can be underestimated. The
reconstruction may also present limitations for smaller landslides in low slope gradient areas. However, this compro-
mise is required to allow the swift volume computation for all elements identified. Furthermore, it should not signif-
icantly affect comparative analysis of relative landslide volume magnitude between distinct examples or locations.
Measurement usage in 3D. The standard procedure to digitise lines and polygons on GIS is based on
2D map projections, with subsequent spatial measurements being primarily derived from planimetric perspec-
tives. This procedure was the base to obtain the landslide total length (Lt), width (Wm) or area (At) parameters.
However, the effect of slope gradient on distance and area calculations is relevant and it is crucial to estimate it
to obtain, for instance, the realistic submarine landslide runout length. To mitigate this issue, the lines and poly-
gons of landslide features mapped using the planimetric perspective were projected and recalculated over the 3D
DEM. Thus, an additional set of length, width and area parameters was obtained for the full landslide and for its
deposit and evacuation subsections. The parameters derived from the projection on the 3D surface are identified
as **-r (see Table 1 for the full listing) where the r stands for “realistic”, or at least close to it given the inherent data
resolution and uncertainties.
Figure 5 illustrates the aforementioned effect of slope gradient on the length measurement of morphological
features using the Lt/Lt-r ratio and the average gradient along the landslide runout vector. Very low slope angles
will have minimal impact on the length measurements, but for angles of 15 degrees Lt can be 20% shorter than
the Lt-r measurement. Towards the steeper slope values of our sample, of circa 30 degrees, this effect can lead to Lt
measurements 35% shorter than the Lt-r. The same principle is valid for width, perimeter and area measurements.
Scientific Data | (2021) 8:185 | https://doi.org/10.1038/s41597-021-00969-w 7www.nature.com/scientificdata/ www.nature.com/scientificdata
Usage Notes
All researchers interested in submarine geomorphology, landslides and GIS are free to use the datasets provided
at will, with appropriate acknowledgement of the source. The data provided in the repository allows an immedi-
ate reproducibility of the results and opens possibilities for further statistical analysis and integration with other
databases – being that for individual research items or integration at wider scale. The majority of the work was
produced using QGIS v3.14, but all items are importable to any GIS software of choice. Despite the high number
of features mapped, there are many more occurrences of landslide and mass-movement features passive of being
mapped. Further versions of the MAGICLAND database will make efforts to integrate subsurface information
and higher detail metrics when higher resolution bathymetric data is available. Researchers are welcome to con-
tribute to the development of this dataset as deemed fit, either by improving knowledge of the mapped features
or adding new ones.
Code availability
No customized code was produced to prepare or analyse the dataset.
Received: 22 February 2021; Accepted: 14 June 2021;
Published: xx xx xxxx
References
1. Clare, M. et al. A consistent global approach for the morphometric characterization of subaqueous landslides. In Subaqueous Mass
Movements and Their Consequences: Assessing Geohazards, Environmental Implications and Economic Significance of Subaqueous
Landslides (eds. Lintern, D. G. et al.) 455–477 (Geological Society, London, Special Publications 477, 2019).
2. Ward, S. N. & Day, S. Cumbre Vieja volcano—potential collapse and tsunami at La Palma, Canary Islands. Geophys. Res. Lett. 28,
3397–3400 (2001).
3. Omira, R. et al. Deep-water seamounts, a potential source of tsunami generated by landslides? The Hirondelle Seamount, NE
Atlantic. Mar. Geol. 379, 267–280 (2016).
4. Shipp, C., Nott, J. A. & Newlin, J. A. Physical characteristics and impact of mass transport complexes on deepwater jetted conductors
and suction anchor piles. Offshore Technology Conference, Houston, Texas (2004).
5. De Mol, B., Huvenne, V. & Canals, M. Cold-water coral banks and submarine landslides: a review. Int. J. Earth Sci. 98, 885–899
(2009).
6. Mosher, D. C., Shimeld, J. W., Hutchinson, D. R. & Jackson, H. R. Canadian UNCLOS extended continental shelf program seismic
data holdings (2006–2011). Geol. Surv. Can. Open File 7938, (2016).
7. Moscardelli, L. & Wood, L. Morphometry of mass-transport deposits as a predictive tool. Geol. Soc. Am. Bull. 128, 47–80 (2016).
8. Twichell, D. C., Chaytor, J. D., ten Brink, U. S. & Buczkowski, B. Morphology of late Quaternary submarine landslides along the
USAtlantic continental margin. Mar. Geol. 264, 4–15 (2009).
9. Chaytor, J. D., ten Brink, U. S., Solow, A. R. & Andrews, B. D. Size distribution of submarine landslides along the USAtlantic margin.
Mar. Geol. 264, 16–27 (2009).
10. Urgeles, R. & Camerlenghi, A. Submarine landslides of the Mediterranean Sea: Trigger mechanisms, dynamics, and frequency‐
magnitude distribution. J. Geophys. Res. Earth Surf. 118, 2600–2618 (2013).
11. León, R. et al. Geological and tectonic controls on morphometrics of submarine landslides of the Spanish margins. In Subaqueous
Mass Movements and their Consequences: Advances in Process Understanding, Monitoring and Hazard AssessmentsGeological Society,
London, Special Publications (eds. Georgiopoulou, A. et al.) 495–513 (Geological Society, London, Special Publications 500, 2020).
12. Clarke, S. L., Hubble, T. C., Miao, G., Airey, D. W. & Ward, S. N. Eastern Australia’s submarine landslides: implications for tsunami
hazard between Jervis Bay and Fraser Island. Landslides 16, 2059–2085 (2019).
13. Ten Brink, U. S., Andrews, B. D. & Miller, N. C. Seismicity and sedimentation rate effects on submarine slope stability. Geology 44,
563–566 (2016).
14. Blahůt, J. et al. A comprehensive global database of giant landslides on volcanic islands. Landslides 16, 2045–2052 (2019).
15. Terrinha, P. et al. Tsunamigenic-seismogenic structures, neotectonics, sedimentary processes and slope instability on the southwest
Portuguese Margin. Mar. Geol. 195, 55–73 (2003).
16. Zitellini, N. et al. The quest for the Africa–Eurasia plate boundary west of the Strait of Gibraltar. Earth Planet. Sci. Lett. 280, 13–50
(2009).
17. Zitellini, N. et al. Source of 1755 Lisbon earthquake and tsunami investigated. Eos Trans. Am. Geophys. Union 82, 285–291 (2001).
18. Collico, S. et al. Probabilistic mapping of earthquake-induced submarine landslide susceptibility in the South-West Iberian margin.
Mar. Geol. 429, 106296 (2020).
19. Innocenti, C., Battaglini, L., D’Angelo, S. & Fiorentino, A. Submarine landslides: mapping the susceptibility in European seas. Q. J.
Eng. Geol. Hydrogeol. 54 (2021).
20. Terrinha, P. et al. The Tagus River delta landslide, off Lisbon, Portugal. Implications for Marine geo-hazards. Mar. Geol. 416, 105983
(2019).
21. Gamboa, D. et al. Destructive episodes and morphological rejuvenation during the lifecycles of tectonically active seamounts:
Insights from the Gorringe Bank in the NE Atlantic. Earth Planet. Sci. Lett. 559, 116772 (2021).
22. Teixeira, M. et al. Interaction of alongslope and downslope processes in the Alentejo Margin (SW Iberia)–Implications on slope
stability. Mar. Geol. 410, 88–108 (2019).
23. EMODnet Bathymetry Consortium. EMODnet Digital Bathymetry (DTM 2018), EMODnet Bathymetry Consortium. (2018).
24. Gamboa, D. & Omira, R. The MAGICLAND submarine landslide database – offshore WSW Iberia. Open Science Framework https://
doi.org/10.17605/OSF.IO/S96RW (2021).
25. Kint, L. et al. Uncertainty assessment applied to marine subsurface datasets. Q. J. Eng. Geol. Hydrogeol. 54 (2021).
26. Wilson, M. F. J., O’Connell, B., Brown, C., Guinan, J. C. & Grehan, A. J. Multiscale Terrain Analysis of Multibeam Bathymetry Data
for Habitat Mapping on the Continental Slope. Mar. Geod. 30, 3–35 (2007).
Acknowledgements
This work is supported by the project MAGICLAND – Marine Geo-hazards InduCed by underwater LANDslides
in the SW Iberian Margin (Ref: PTDC/CTA-GEO/30381/2017), funded by the Fundação para a Ciência e
Tecnologia (FCT), Portugal. The authors wish also to acknowledge the financial support of FCT through project
UIDB/50019/2020 – IDL.
Scientific Data | (2021) 8:185 | https://doi.org/10.1038/s41597-021-00969-w 8www.nature.com/scientificdata/ www.nature.com/scientificdata
Author contributions
Davide Gamboa – Developing and conceptualisation of the database; data preparation and loading; data
acquisition and mapping; data processing; data visualisation; manuscript concept preparation; manuscript
writing and organisation; manuscript editing. Rachid Omira – Developing and conceptualisation of the database;
data review; manuscript revision and editing; funding acquisition. Pedro Terrinha – Manuscript revision and
editing; data support; provision of software and IT equipment.
Competing interests
The authors declare no competing interests.
Additional information
Correspondence and requests for materials should be addressed to D.G.
Reprints and permissions information is available at www.nature.com/reprints.
Publisher’s note Springer Nature remains neutral with regard to jurisdictional claims in published maps and
institutional affiliations.
Open Access This article is licensed under a Creative Commons Attribution 4.0 International
License, which permits use, sharing, adaptation, distribution and reproduction in any medium or
format, as long as you give appropriate credit to the original author(s) and the source, provide a link to the Cre-
ative Commons license, and indicate if changes were made. The images or other third party material in this
article are included in the article’s Creative Commons license, unless indicated otherwise in a credit line to the
material. If material is not included in the article’s Creative Commons license and your intended use is not per-
mitted by statutory regulation or exceeds the permitted use, you will need to obtain permission directly from the
copyright holder. To view a copy of this license, visit http://creativecommons.org/licenses/by/4.0/.
The Creative Commons Public Domain Dedication waiver http://creativecommons.org/publicdomain/zero/1.0/
applies to the metadata files associated with this article.
© The Author(s) 2021
Scientific Data | (2021) 8:185 | https://doi.org/10.1038/s41597-021-00969-w 9You can also read