A Geolocation Analytics-Driven Ontology for Short-Term Leases: Inferring Current Sharing Economy Trends - MDPI
←
→
Page content transcription
If your browser does not render page correctly, please read the page content below
algorithms
Article
A Geolocation Analytics-Driven Ontology for
Short-Term Leases: Inferring Current Sharing
Economy Trends
Georgios Alexandridis 1, * , Yorghos Voutos 2 , Phivos Mylonas 2               and George Caridakis 1
 1   Intelligent Interaction Research Group, Cultural Technology Department, University of the Aegean,
     81100 Lesbos, Greece; gcari@aegean.gr
 2   Humanistic and Social Informatics Lab, Department of Informatics, Ionian University, 49100 Kerkira, Greece;
     george.voutos@gmail.com (Y.V.); fmylonas@ionio.gr (P.M.)
 *   Correspondence: gealexandri@aegean.gr

 Received: 14 January 2020; Accepted: 27 February 2020; Published: 4 March 2020

 Abstract: Short-term property rentals are perhaps one of the most common traits of present day
 shared economy. Moreover, they are acknowledged as a major driving force behind changes in urban
 landscapes, ranging from established metropolises to developing townships, as well as a facilitator of
 geographical mobility. A geolocation ontology is a high level inference tool, typically represented
 as a labeled graph, for discovering latent patterns from a plethora of unstructured and multimodal
 data. In this work, a two-step methodological framework is proposed, where the results of various
 geolocation analyses, important in their own respect, such as ghost hotel discovery, form intermediate
 building blocks towards an enriched knowledge graph. The outlined methodology is validated upon
 data crawled from the Airbnb website and more specifically, on keywords extracted from comments
 made by users of the said platform. A rather solid case-study, based on the aforementioned type of
 data regarding Athens, Greece, is addressed in detail, studying the different degrees of expansion &
 prevalence of the phenomenon among the city’s various neighborhoods.

 Keywords: sharing economy; short-term rentals; Airbnb; Athens; Greece; geolocation ontology;
 ghost hotel discovery; rapid automatic keyword extraction

1. Introduction
     In the past decade, the sharing economy paradigm demonstrated a shift in how people gain access
to and circulate goods. Even though sharing may be viewed as a basic economic behavior in human
societies that has been existing for centuries [1], this innovative economic form has been recognized
as a divergence from conventional models, because it concentrates not on ownership, but on access
to assets and resources [2]. The emergence of the sharing economy has been the result of an array of
developments in technology that have the availability of physical and non-physical products easier
and simpler through a variety of Information Technology (IT) sources available online [3]. In this
sense, open-source software, file-sharing programs, online forms of collaboration, and peer-to-peer
(P2P) networks are all aspects of this new phenomenon. In 2011, TIME Magazine nominated sharing
economy as one of “10 ideas that will change the world” [4].
     Over the years, the aforementioned trend has been extended to such diverse products and
services as rides, accommodation, tool sharing, relationship advice and even legal expertise. In the
short-term rental (STR) market, Airbnb [5] plays a prominent role; starting in 2007, it has demonstrated
outstanding growth, with a large number of available rooms in more than 190 countries, greatly
affecting the hospitality industry [6]. Unlike conventional lodgings, Airbnb does not own or manage

Algorithms 2020, 13, 59; doi:10.3390/a13030059                                www.mdpi.com/journal/algorithms
Algorithms 2020, 13, 59                                                                               2 of 17

property and allows users to rent any livable space (from a sofa to a mansion) through an online
platform that matches individuals looking for accommodation to home owners willing to share a room
or a house.
     Compared to regular hotel bookings, Airbnb listings pose as a competitive alternative for potential
tenants, due to the generally smaller investment required by home owners. At the same time, STRs
promise greater earnings to this latter category of people, especially in comparison to offering their
property for long-term rental (LTR) [7]. As a consequence, STR platforms in general and Airbnb in
particular have greatly affected LTR and accommodation prices worldwide in recent years [8,9].
     Apart from the influence of Airbnb on the available housing stock for rent and lease, the STR
platform affects the surrounding urban landscape as well. This is quite evident in the comment section
of the website, where users judge their accommodation and overall experience after their stay is over.
This free-form text reviews offer valuable insight on various aspects of their visits, that are not just
limited on the lodging itself [10]; indeed, visitors also evaluate the available transportation and various
points of interest (POIs) such as shops, restaurants, bars and historical landmarks, both in the direct
vicinity of their temporary residence and afar in the city.
     The systematization and categorization of this kind of knowledge is obviously of interest, apart
from those offering their properties on the platform, to other businesses operating in the hospitality
industry, to local tenants and of course, policymakers. Additionally, insight could be drawn about
access patterns within the city and relationships inbetween its various neighborhoods that are not
directly visible. In this direction, this work attempts at constructing a geolocation ontology whose
purpose is to be used as a high-level inference for the discovery of latent patterns in a plethora of
unstructured and multimodal data. The overall process is two-step; the results of geolocation analysis
such as Airbnb listings’ expansion, ghost hotel prevalence and keyword extraction from comments,
form intermediate building blocks towards a more complete knowledge graph. The proposed approach
is subsequently applied on STR data collected from Airbnb on the City of Athens, Greece, that has
undergone enormous changes, especially in the previous years of economic recession [11].
     The remaining part of this work is structured as follows; Section 2 briefly reviews the relevant
scientific literature and then, in Section 3, a focused case study of the proposed methodology is
presented. Section 4 provides a detailed overview of the available data and in Section 5 key aspects of
the performed geolocation analysis are reasoned upon, with a preliminary version of the proposed
ontology being also provided. Finally, the work concludes in Section 6.

2. Related Work
      The relevant literature on sharing economy is extensive and rapidly expanding; this observation
also applies on research for the specifics of STRs and Airbnb in particular, as an investment strategy and
the mechanisms regulating prices [12]. One of the most influential works on the matter is presented
in [13], providing insight on how these types of markets come about and function. In the same work,
the authors analyze the anomalies associated with the emergence of sharing economy and the ways
interactions between providers and consumers are conducted; namely, the conditions influencing
the trust between the different sides and those factors boosting or reducing the reputation of the
providers. Additionally, some aspects regarding policy and regulation of the sharing economy, such as
the dichotomy between formal businesses and P2P platform users, are also reviewed.
      In contrast to other strands in the relevant research and the voluminous literature on sharing
economy as a whole, and despite the increasing attention, the expansion of STRs remains a relatively
under-researched topic. It was introduced in 2011 [14], followed by numerous printed and online media
articles written since then. Nowadays, the relevant literature follows the trends of the phenomenon;
the main issues covered include Airbnb (and other platforms) as an investment strategy and the factors
increasing the satisfaction of its users, its spatial characteristics and level of expansion, policy choices
and implications, its impact on the tourism industry, and its relation to rent hikes and increasing
Algorithms 2020, 13, 59 3 of 17
property values. An active part of this body of research revolves around the notion of touristification,
meaning how cities expand tourism-related activities through gentrification [15].
Additionally, a wide geographical framework has been covered, with Mediterranean tourism
powerhouses such as Barcelona or Lisbon having a prominent position in the existing literature.
However, the main bulk of research has been carried out for the US market, with New York and
Los Angeles sticking out [16] and recently, in cities and peripheries in South-East Asia (Singapore
is an example) and South America. In Europe, apart from Barcelona, STR listings exhibit significant
concentrations in Paris, London, and Rome. Athens, even though it is not among the European cities
with the highest number of Airbnb entries, it exhibits one of the highest rates of Airbnb listings per a
thousand inhabitants, meaning that it receives heavy pressure from the related activity [17].
Keyword Extraction
The construction of the geolocation ontology discussed in Section 1 is primarily based upon
the extraction of keywords from the short, textual reviews left by guests of each lodging on the
Airbnb website. Despite their significance for analysis, indexing, and retrieval, those reviews do not
have assigned keywords. A great number of document processing approaches rely on the manual
assignment of keywords by professional curators, who may use a fixed taxonomy or the authors’
judgment to provide a representative list. Therefore, the relevant research has been predominately
focused on methods that automatically extract keywords from documents, as an aid either to suggest
keywords for a professional indexer or to generate summary features for documents.
Early approaches to automatic keyword extraction evaluate corpus-oriented statistics of individual
words [18,19]. In later research, similar metrics are used to select discriminating words as keywords
for individual documents [20]. Corpus-oriented methods typically operate only on single words; this
further limits the measurement of statistically discriminating words because they are often used in
multiple and different contexts.
To avoid these drawbacks, many keyword extraction methods operate on individual documents;
that is, they extract keywords from a document, regardless of the current state of the corpus.
Document-oriented methods therefore provide context-independent document features, enabling
additional analysis that characterize changes within a text stream over time [21,22]. In principle,
the task of extracting keywords based on short-length text is challenging, as it is semantically sparse.
For example, an algorithm that uses word co-occurrence in a single document is presented in [23],
while in [24], keyword extraction is achieved using lexical chains that are composed of head nouns,
which on their part, are derived from the representations of key phrases in the document.
Graph-based approaches have also been extensively used for this task (i.e., the Twitter Keyword
Graph [25]). TextRank, on the other hand, takes into account the lexical meaning of the text unit, as
well [26,27]. In [28], TextRank is extended in an unsupervised extractive summarization scheme
that can examine whether there is any potential overlap between the extractive summarization
and argument mining, while in [29], a system that applies a series of syntactic filters to identify
part-of-speech tags is described, that is used to evaluate selected words as possible keywords.
The negative effect of short text in the semantic sparseness of the obtained representations may
be addressed using clustering techniques. In this setting, short excerpts are spliced into “pseudo”-long
texts and subsequently topic-extraction techniques are used in order to identify keywords [30], like
latent Dirichlet allocation [31] and latent semantic analysis [32]. A similar objective is achieved
through the combination of document-oriented methods with machine learning techniques [33], like
bi-directional long short-term memory networks [34], recurrent neural networks and neural language
models [35].
In an effort to achieve the best possible trade-off between performance, speed and efficiency, the
rapid automatic keyword extraction (RAKE) [36] algorithm has been selected for the analysis that
follows. RAKE is an unsupervised, domain and language independent method for keyword extractionAlgorithms 2020, 13, 59 4 of 17
from individual documents. More details on the algorithm and its hyper-parameters are provided in
Section 5.1.
3. Case Study
The property lease model introduced by Airbnb has not only become commonplace, but it has
also been imitated by individuals and organizations involved in the real-estate market. The Greek STR
market in particular, experiences an increased mobility of international capital, as it draws the attention
of foreign investors and the establishment of numerous Real Estate Investment Companies [37].
The ongoing economic crisis and the burst of the housing bubble in 2007–08 [11], from which the Greek
real estate market has not fully recovered, is one of the main reasons behind this increased mobility,
as property values remain at low levels compared to other EU countries [38]. Equally important,
is the factor of the Golden Visa program in Greece, which allows investors from outside the EU to
acquire EU residency and citizenship and be able to invest inside the Schengen Zone. The program
has been particularly lucrative for Russian, Chinese, Israeli, Turkish and Arab investors; besides the
residency and citizenship privileges that come with the visa, investors seek for an income in hard
currency, as is the euro. At the same time, Greece as a whole and Athens as an urban destination receive
every year soaring numbers of visitors which, after 2013, are constantly increasing. For the real estate
market of Athens, investing in the areas in close vicinity to the Acropolis is advised, due to its status
as a prominent cultural attraction and the dynamism of STRs [39]. Additionally, a currently under
construction expanding subway network valorizes a line of areas across Athens, opening up new STR
markets; a very interesting example is that of the neighborhood of Exarcheia, which, attracts a curious
blend of alternative visitors, and at the same time is among the next stations of the newly-planned
metro line, exhibiting exceptional dynamics in its housing market.
According to a survey by the Greek Tourism Confederation [40], an estimated 170.542 STRs had
been available in Greece, on Airbnb and HomeAway [41] platforms, in between June 2018 to May 2019,
producing a total revenue of €1.15 billion. It is worth noting that 50% of STR properties are already in
the hands of large corporations, which withhold from 10% to 30% of their turnover, depending on the
services they offer. The aforementioned facts indicate that it is an expandable market, operating in
very high volumes. At the same time, according to the 2019 aggregate data released by the Spitogatos
real estate website [42], rental prices have seen very large increases in the majority of Greek cities, with
the largest changes being observed in Piraeus (25.2%) and the central and western suburbs of Athens
(20%). Nevertheless, recent surveys conducted by AirDNA [43] indicate that STRs are showing signs
of fatigue, with homeowners who have their properties listed to relevant platforms witnessing falls in
occupancy and revenue. According to a recent journalistic investigation [44], average occupancy in
Athens in May 2019 reached 65.9%, compared to 67.7% in same month of the previous year; a 2.66%
decrease. At the same time, active listings jumped by 26% year-on-year (from 8156 to 10,281), forcing
owners to drop their average daily rate by 7% (from €74 to €69).
More formally, accommodation performance in the hospitality industry is measured by the
revenue per available room (RevPAR) metric [45], which is the product of a hotel’s average daily room
rate times its occupancy rate. RevPAR is a useful tool for analyzing trends and fluctuations in room
tenancy in any given hotel unit. In a broader sense, RevPAR potentially suggests some interesting
implications both for ordinary hotels and STRs alike. For example, a decline in RevPAR has been
witnessed between April 2018 & 2019 in Athens, when it fell from 50% to 45.5%, an indication that
access to accommodation is becoming increasingly difficult.
4. Dataset
In order to study the current trends in STRs in Athens, Greece, an analytic methodology has been
developed, based on data provided by Inside Airbnb [46], an independent initiative studying the
expansion and effect of the eponymous sharing economy platform on various cities and areas around
the world (Airbnb does not disclose data about its operation, yet). The said initiative crawls publiclyAlgorithms 2020, 13, 59 5 of 17
available information about an area’s listings on the platform’s website on a regular basis and provides
rich data dumps that thoroughly describe every available entry. For the City of Athens, Greece in
particular, Inside Airbnb has been providing data dumps since July 2015 on an irregular basis and after
July 2018 on a regular (monthly) basis. In total, 21 distinct data dumps have been made available at
the time of writing, with the latest being on released on November 2019.
Each data dump consists of a number of tabular files that provide various degrees of detail
pertaining to three key aspects that characterize every listing:
1. its characteristics (e.g., description, location, etc)
2. its availability for rent throughout the year
3. the reviews it has received so far.
The methodology of this work is mainly based on data regarding the characteristics of the listings
and the reviews they have received and for this reason the relevant information is going to be analyzed
in more detail in the following subsections.
4.1. Characteristics
The data dumps contain two tabular files with respect to the characteristics of each listing; one
that contains 16 basic features and another that contains 106 very detailed additional features. For the
purpose of the current analysis, the basic features have been considered to be sufficient. They can be
grouped into the following categories:
• Host details (name, id, number of properties managed)
• Listing details (listing id, description, exact location, neighborhood, property type)
• Basic availability details (availability throughout the year, minimum nights per stay)
• Price per night (in USD)
• Aggregated review details
Table 1 below summarizes the evolution of three key features of the examined dataset for the City
of Athens, Greece; (i) the total number of listings (ii) the mean price per night (iii) the mean number of
available days per year.
Even though there is a scarcity of data in the earlier years, it is obvious that platform listings have
witnessed an exponential growth from around 2000 to almost 10,000 (a 5-fold increase) in the three-year
period between 2015 and 2018, followed by a small but steady linear growth since. Further analysis on
the type of property listed on the platform (Table 2) reveals that, since the beginning, the overwhelming
majority of them (more than 80%) are entire homes or apartments, while recently, an increase in listings
described as Hotel Rooms is also visible. The above observation, in conjunction with the large average
listing availability on the platform (5th column of Table 1) lead to the conclusion that properties on
the Airbnb platform are another, concealed & unregulated form of touristic accommodation, thereby
rendering the “sharing economy” claims extremely weak for the case of the City of Athens, Greece.
Lastly, the mean accommodation price seems to be stabilized around $60–$65 per night or $1800–$2000
per month, which is at least 3 times higher that the average monthly LTR price and also a justification
for the reason home owners prefer to list their properties on STR platforms than renting them to
regular tenants.
4.2. Reviews
Inside Airbnb dumps also contain the reviews of each listing made by its guests, since the
property’s first appearance on the platform. Consequently, the available reviews may date earlier
than the first data dump (17th July 2015) and in reality, they span almost a decade (from July 2010 to
November 2019). As reviews accumulate inbetween data dumps, the latest one (19th November 2019,
as of writing) incorporates all the relevant information and consequently it was the one that has been
examined. Every review is comprised of a number of features that include the review id, the listing id,Algorithms 2020, 13, 59 6 of 17
the reviewer’s id and name, the date it has been submitted and lastly, the review content in free-text.
Table 3 summarizes the available reviews of the latest data dump; as it is evident, their vast majority is
written in the English language (more than three quarters), therefore the analysis that follows will only
focus on those reviews.
Table 1. Characteristics of Inside Airbnb data dumps of Athens, Greece.
Total Number Mean Price Average Number of
No. Date
of Listings per Night Available Days per Year
1 17th July 2015 2116 $58.47 311.44
2 9th May 2017 5127 $54.83 248.63
3 14th April 2018 7962 $59.65 230.93
4 16th May 2018 7828 $61.74 226.71
5 16th July 2018 8968 $61.02 231.52
6 15th August 2018 9360 $61.36 235.02
7 13th September 2018 9294 $62.24 237.71
8 11th October 2018 9163 $66.16 239.32
9 15th November 2018 9122 $66.56 245.49
10 12th December 2018 8647 $65.82 248.18
11 16th January 2019 8891 $64.84 246.02
12 8th February 2019 9100 $65.50 241.43
13 11th March 2019 9361 $64.89 236.11
14 13th April 2019 9661 $64.36 229.41
15 15th May 2019 10,079 $64.60 225.59
16 10th June 2019 10,414 $65.16 226.38
17 13th July 2019 11,047 $65.33 228.45
18 13th August 2019 11,340 $65.39 228.89
19 20th September 2019 11,338 $66.05 233.05
20 17th October 2019 11,213 $66.21 236.45
21 19th November 2019 11,263 $65.96 240.35
Average Value $63.63 239.38
Standard Deviation $3.09 18.03
Table 2. Listing types.
17th July 2015 19th November 2019
Data Dump
Listings Percentage Listings Percentage
Entire home/apartment 1729 81.71% 9874 87.67%
Private room 464 16.35% 1040 9.23%
Hotel room 0 0.00% 291 2.58%
Shared room 41 1.94% 58 0.51%
Total 2116 100.00% 11,263 100.00%
Table 3. Number of reviews per language of Athens’ Airbnb listings on 19th November 2019.
Language Number of Reviews Percentage
English 311,347 77.39%
French 26,847 6.67%
Greek 22,716 5.65%
Spanish 11,765 2.92%
German 7548 1.88%
Italian 4814 1.20%
Russian 2912 0.72%
Other Languages 14,361 3.57%
Total 402,310 100.00%Algorithms 2020, 13, 59 7 of 17
5. Methodology
The Airbnb listing data presented in the previous Section are aggregated for the City of Athens.
However, as it is going to be evident in the forthcoming analysis, the expansion and prevalence of the
phenomenon is extremely localized in nature, in the sense that certain parts, or neighborhoods,
of the city exhibit high concentrations of relevant STR activity, while others remain relatively
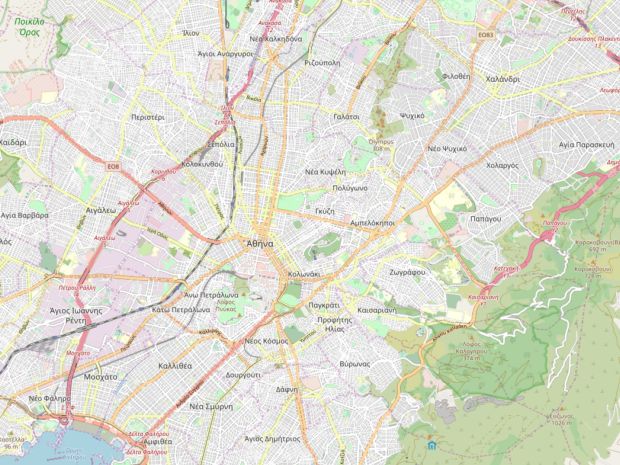
“underexploited”. This is characteristically presented in Figure 1, which depicts the density of Airbnb
listings for the neighborhoods of Athens over the examined time period (2015 through 2019).Algorithms 2020, 13, 59 8 of 17
Density (no. of listings per km2) per neighborhood
4.38 - 10.63 10.63 - 27.01 27.01 - 47.00 47.00 - 157.71
(a) 17th July 2015
Density (no. of listings per km2) per neighborhood
0.00 - 26.04 41.49 - 79.82 128.07 - 167.32 258.16 - 382.18
26.04 - 41.49 79.82 - 128.07 167.32 - 258.16 382.18 - 1279.24
(b) 19th November 2019
Figure 1. Change of density of Airbnb listings in Athens neighborhoods between 2015 and 2019
(color online).
More specifically, Figure 1a showcases the density of activity in the first data dump of 17th July
2015 in the form of a heat map. Even though the central neighborhoods accumulate most listings, the
overall distribution appears to be homogenous, as not big differences are witnessed between the center
and the periphery. A totally different picture is presented in Figure 1b (the density heat map of the last
data dump of 19th November 2019); in this case, the concentration of Airbnb listings in the centralAlgorithms 2020, 13, 59 9 of 17
neighborhoods is two orders of magnitude bigger than the periphery. Additionally, STR activity seems
to be “moving” to certain northern, southern and south-eastern neighborhoods.
In essence, the aim of this work is not only to showcase the active neighborhoods, but to also
try to interpret the phenomenon and capture its dynamics in a systematic & consistent way. In this
direction, the analysis that follows quantifies the evolution of STRs by examining various aspects of
the available data and mapping them into the geolocation-driven ontology.
5.1. Keyword Extraction
User reviews constitute one of the most straightforward ways of studying STR prevalence. Even
though taste and preference have an indisputably personal character when evaluating a lodging, they
may also convey more general information, that falls well beyond the scope of a specific stay. This is
vividly pictured in Figure 2, where an actual review from the dataset is displayed.
Fantastic accommodation very well located to visit Athens for a few days or Legend
longer. Shops, restaurants, public transport all 50 meters away. Also the Landmarks/Attractions
President Hotel. Transportation
Accommodation
Apartment is spacious, quiet, in the 4th floor with 2 lifts, and very bright
Shops
and clean. Well decorated throughout with modern bathrooms and kitchen. Host
Internet was very good.
Highly recommend this place for the above reasons plus the host, Manos, is a
very professional, helpful and kind person, always available in his ground
floor office next to the building, to assist us during our 5 day stay.
Thank you very much Manos!
Also from the kids :)
Figure 2. Example review from the dataset (color online).
A detailed analysis of the content of this specific review leads to some interesting observations;
for the most part, the user in question is evaluating the property (yellow marking) and the interaction
with the host (blue marking). Nevertheless, certain remarks about the neighborhood are also present;
the availability of shops, restaurants (orange marking) and public transportation (green marking)
nearby, as well as a landmark, the President Hotel (purple marking).
In general, review content may be grouped in any of the five categories appearing in the legend
of Figure 2; that is;
1. Landmarks or Attractions
2. Transportation
3. Shops
4. Accommodation
5. Host
Even though the last two categories naturally vary between accommodations and hosts, the
first three characterize the neighborhoods and constitute an indication of why certain areas are more
popular than others. Therefore, the application of a keyword extraction methodology on review data
is going to quantify user preference with respect to the aforementioned categories of interest.
Keyword extraction has been discussed in Section 2, where it has been reasoned that the keyword
extraction methodology of choice in this work is RAKE [36], a domain independent algorithm, which
counts term appearance and co-occurrence frequencies excluding special words, such as conjunctions
and prepositions. Initially, all reviews pertaining to properties within a specific Athens’ neighborhood
are concatenated into a single document. Then the document is split into a list of words and the
stopwords (most common words & prepositions like “and”, “the” etc) are removed, getting a list
known as content words.Algorithms 2020, 13, 59 10 of 17
In the following step, a square symmetric matrix of content word co-occurrences W is created;
whose wij element designates the number of times word i co-occurs with word j in a phrase, with
the maximum considered phrase length l p being a hyper-parameter of the approach. Once W has
been computed, then the score si of content word i equals the ratio of its degree di , i.e., the sum of
the number of co-occurrences i has with any other content word in the text (Equation (1)), over its
frequency f i in text (Equation (2))
di = ∑ wij (1)
j
di
si = (2)
fi
Content words may be viewed as phrases of length 1. The score of longer phrases (up to length l p )
spotted in the the list of content words ensues from the summation of the scores of the individual words
they are comprised of. Finally, in order to filter out rare words and phrases, a minimum frequency
f min is defined for any non-stopword to be included in the list of content words (and of any phrase of
length less than l p to be considered), which constitutes the second hyper-parameter of the approach.
After a thorough experimentation procedure, the optimal values of the hyper-parameters have
been determined to be l p = 3 and f min = 10. Table 4 below summarizes the 20 most frequently
extracted keywords for the neighborhood of Emporiko Trigono-Plaka, which is the most popular
among the City of Athens neighborhoods, as it concentrates the biggest number of listings and the
most user reviews.
Table 4. Most popular keywords extracted via RAKE from reviews of Emporiko Trigono-Plaka
Airbnb listings.
Keyword Score Keyword Score
harry belafonte suite 6.92 major tourist attractions 6.27
million dollar view 6.82 main historical sites 6.26
pristine urban suites 6.74 major metro stations 6.23
solo female traveler 6.69 major historic sites 6.23
main tourist spots 6.60 air bnb experience 6.22
air conditioning works 6.54 major historical sites 6.21
nearest metro station 6.52 main metro station 6.21
air conditioning worked 6.50 short walking distance 6.20
main tourist areas 6.48 great water pressure 6.19
great air conditioning 6.48 good water pressure 6.16
good air conditioning 6.45 king size bed 6.15
bring ear plugs 6.39 x95 bus stop 6.12
national archaeological museum 6.38 main shopping district 6.10
main tourist sites 6.35 ac works great 6.10
main pedestrian street 6.33 ac worked great 6.05
main tourist attractions 6.32 busy pedestrian street 6.03
major tourist sites 6.30 akropoli metro station 5.99
main tourist area 6.28 hot water heater 5.99
main shopping strip 6.27 air conditioning unit 5.98
national archeological museum 6.27
A closer examination of the extracted keywords for the Plaka neighborhood reveal similar patterns,
as those discussed when analyzing Figure 2. Among the most popular keywords, there exist those that
are related to nearby attractions or landmarks (e.g., the National Archeological Museum of Athens),
to public transportation (e.g., “x95 bus stop” and “major metro stations”) and to the availability of
shops (e.g., “main shopping strip”). Of course, the most popular keywords need not be the same for all
neighborhoods; in fact, the observed similarities and dissimilarities inbetween different neighborhoods
are going to be among the key elements of the created ontology for the STR in the City of Athens.Algorithms 2020, 13, 59 11 of 17
5.2. Ghost Hotels
The main focus when studying STR impact on the housing markets is around entire home or
apartments listings which, as it has already been discussed in Section 4.1 (Table 2), account for the
overwhelming majority of the available properties in the City of Athens. The reason is that the
aforementioned listings can no longer be available to house long-term tenants, thereby intensifying the
housing crisis that has been witnessed in Athens in recent years. Private or shared rooms, on the other
hand, are generally not regarded as a contributing factor to the said phenomenon, as they are viewed
as properties that don’t affect the housing availability for regular tenants.
Nevertheless, a detailed inspection on private or shared rooms reveals that above assumption is
not always valid. Table 5 groups these categories of rooms on a per host basis, for the first and last data
dumps of the dataset (Section 4). For example, on 17th July 2015, 387 private or shared rooms were
available on Airbnb for the City of Athens, 228 of which were listed by hosts having exactly one listing
on the platform and the rest by hosts having more listings. This last grouping of listings are generally
being referred to as “ghost hotels” because a single host pretends to possess multiple small properties
while, in fact, s/he owns a larger one, split into individual rooms, much like an ordinary hotel.
Table 5. Number of shared/private/hotel rooms listings per host.
17th July 2015 19th November 2019
Number of Listings per Host
Listings Percentage Listings Percentage
One listing 228 58.91% 430 30.96%
More listings 159 41.09% 959 69.04%
Total 387 100.00% 1389 100.00%
In reality, these cases constitute an unregulated form of hotel operation and have been repeatedly
labeled as unfair competition by both registered hotel owners and tourism-related authorities [47].
Monitoring the existence and expansion of ghost hotels is of great importance as it illustrates the
dynamics of STRs and the development of tourism within the city. Indeed, Table 5 also portrays a
more than a three-fold increase in relevant entries between the first and last data dumps, while ghost
hotel listings have witnessed a 6-fold increase from 97 to 789 or from 40% to 70%.
Figure 3 illustrates ghost-hotel expansion in the City of Athens between 2015 & 2019 (first &
last data dumps). It is very similar to Figure 1, in the sense that most ghost exist in the central
neighborhoods and not in the periphery. However, ghost hotel prevalence does not follow the same
patterns as entire homes and apartments, since it does not seem to move to southern, northern &
south-eastern areas. An exception to this rule is the rather sharp density increase around the areas of
the Central Railway Station of Athens (Stathmos Larissis) and in the Kypseli neighborhood.Algorithms 2020, 13, 59 12 of 17
Ghost hotel density (no. of listings per km2) per neighborhood
0.56 - 1.21 1.21 - 3.21 3.21 - 6.10 6.10 - 15.13
(a) 17th July 2015
Ghost hotel density (no. of listings per km2) per neighborhood
0.83 - 1.30 4.06 - 6.19 8.16 - 11.41 22.59 - 56.33
1.30 - 4.06 6.19 - 8.16 11.41 - 22.59 56.33 - 114.28
(b) 19th November 2019
Figure 3. Change of ghost hotel density of Airbnb listings in Athens neighborhoods between 2015 and
2019 (color online).Algorithms 2020, 13, 59 13 of 17
5.3. Ontology Creation
Following the previous analysis and case study description, the effect of user reviews is considered
to be optimally captured within a given spatial resolution; namely, the diversification based on the
municipal boundaries of the City of Athens, Greece. These variations are affiliated with special classes
related to visitor comments, therefore the identified variables are dependent on their distinctive spatial
identifier (i.e., polygon vertices and area-names). The variables are classified into particular fields
on inductive thought, taking into consideration user opinion and the specific characteristics of each
accommodation. The proposed knowledge model may be expressed in a formal manner with the use
of basic elements towards semantic interpretation, such as concepts, relations between concepts and
topics, that result in the ontology structure depicted in Figure 4.
Landmark
Transportation Amenity
Neighborhood
Shop Price
Figure 4. A fragment of the proposed ontology depicting a particular area of interest.
In particular, each reviewing comment is considered to be part of a qualitative assessment category
(i.e., “Landmark”, “Transportation”, “Shop”) in addition to specific quantitative ones (i.e., ”Price”
and ”Amenity”) that are captured after each lease. Furthermore, each location consists of sub-classes
(including the aforementioned classes), which are subsequently connected according to their respective
statistical importance, among all areas of interest. In order to define, extract, and use the underlying
knowledge of a set of concepts, we rely on the semantics of their relations, as the latter are expressed
by the so-called “is-related” relation. In other words, the existence of an edge in the graph quantifies
the relation, whereas the absence of an edge illustrates a non-existing relationship between any
two concepts.
Since relations among real-life concepts are often uncertain (or a matter of degree), the approach
followed herein may be extended to include a formal methodology and mathematical notation based
on fuzzy relational algebra [48]. Still, as depicted in Figure 5, the proposed model is quite flexible
and can be adjusted to the required research framework, i.e., one or more of its sub-classes may be
altered accordingly. Therefore, in the presented approach, classifying natural language text through
automated statistical and non-statistical procedures is split on the type of service provided by the
owners of the listed properties.Algorithms 2020, 13, 59 14 of 17
Figure 5. Schematic representation of the proposed ontology.
6. Discussion and Future Work
This work constitutes a first attempt at studying the effect of STRs, an important aspect of the
sharing economy phenomenon, in a methodological and concise manner. As a concrete use case,
Airbnb listings from the various neighborhoods of the City of Athens, Greece have been examined.
More specifically, the contribution of this work is twofold; firstly, a geolocation analysis of STRs is
performed, based on a wide array of attributes, such as density, number of properties managed per
host and property type. Their purpose is to uncover trends in the STR market. Secondly, exploiting
the outcomes of the aforementioned analysis, an ontology is derived, describing certain high-level
knowledge aspects that, in principle, are difficult to quantify, like the cultural value and entertainment
potential for the given neighborhoods. Based on this ontology, latent similarities between non-adjacent
neighborhoods are discovered, while the extracted keywords from visitor comments verify and
evaluate the proposed approach.
Among the most interesting patterns extracted from the geolocation analysis are the similarities
between non-adjacent neighborhoods that share certain trends, like the proximity to public
transportation networks (in particular, the metro lines) and the existence of a variety of shops in
the direct vicinity of the listings. Additionally, the presence of ghost hotels in the urban complex of
Athens suggests that there is a high demand for affordable accommodation that is not yet fully met.
Finally, this work lays the groundwork for further research in the field of STRs. Possible future
directions include the detailed study of visitor sentiment, as extracted from the available reviews,
preferences with respect to city infrastructure and amenities for people with disabilities. Moreover, the
role of shared properties in creating ad hoc visitor groups, with common interests and wishing to have
similar experiences, is also worth further exploring.Algorithms 2020, 13, 59 15 of 17
Author Contributions: Conceptualization, G.A.; Methodology, G.A. and Y.V.; Formal analysis, Y.V. and G.C.;
Resources, G.C.; Data curation, G.A.; Writing–original draft, G.A.; Writing—review and editing, G.A., Y.V. and
P.M.; Visualization, G.A.; Supervision, P.M.; Project administration, G.C. All authors have read and agreed to the
published version of the manuscript.
Funding: This research received no external funding
Conflicts of Interest: The authors declare no conflict of interest.
Abbreviations
The following abbreviations are used in this manuscript:
LTR Long-Term Rentals
POI Point of Interest
P2P Peer-to-Peer
RAKE Rapid Automatic Keyword Extraction
RevPAR Revenue Per Available Room
STR Short-Term Rentals
References
1. Hellwig, K.; Morhart, F.; Girardin, F.; Hauser, M. Exploring different types of sharing: A proposed
segmentation of the market for “sharing” businesses. Psychol. Market. 2015, 32, 891–906.
2. Stephany, A. The Business of Sharing: Making it in the New Sharing Economy; Springer: Berlin, Germany, 2015.
3. Hamari, J.; Sjöklint, M.; Ukkonen, A. The sharing economy: Why people participate in collaborative
consumption. J. Assoc. Inf. Sci. Tech. 2016, 67, 2047–2059.
4. Walsh, B. 10 Ideas That Will Change the World. 2011. Available online: http://content.time.com/time/
specials/packages/article/0,28804,2059521_2059717,00.html (accessed on 14 January 2020).
5. Airbnb—Holiday Lets, Homes, Experiences & Places. Available online: https://airbnb.com/ (accessed on
14 January 2020).
6. Kavadias, S.; Ladas, K.; Loch, C. The transformative business model. Harv. Bus. Rev. 2016, 94, 91–98.
7. Wachsmuth, D.; Weisler, A. Airbnb and the rent gap: Gentrification through the sharing economy.
Environ. Plan. A Econ. Space 2018, 50, 1147–1170, doi:10.1177/0308518X18778038.
8. Ključnikov, A.; Krajčík, V.; Vincúrová, Z. International sharing economy: The Case of AiRBnB in the Czech
Republic. Econ. Sociol. 2018, 11, 126–137.
9. Gourzis, K.; Alexandridis, G.; Gialis, S.; Caridakis, G. Studying the Spatialities of Short-Term Rentals’
Sprawl in the Urban Fabric: The Case of Airbnb in Athens, Greece. In Artificial Intelligence Applications and
Innovations; MacIntyre, J., Maglogiannis, I., Iliadis, L., Pimenidis, E., Eds.; Springer: Cham, Switzerland,
2019; Volume 560, pp. 196–207.
10. Luo, Y. What Airbnb Reviews Can Tell Us? an Advanced Latent Aspect Rating Analysis Approach. Ph.D.
Thesis, Iowa State University, Ames, IA, USA, 14 June 2018.
11. Matsaganis, M.; Leventi, C. Poverty and Inequality during the Great Recession in Greece. Polit. Stud. Rev.
2014, 12, 209–223.
12. Sheppard, S.; Udell, A. Do Airbnb Properties Affect House Prices? 2016. Available online: https://web.
williams.edu/Economics/wp/SheppardUdellAirbnbAffectHousePrices.pdf (accessed on 14 January 2020).
13. Einav, L.; Farronato, C.; Levin, J. Peer-to-Peer Markets. Annu. Rev. Econ. 2016, 8, 615–635.
14. Edelman, B.; Luca, M. Airbnb (A). 2011. Available online: https://store.hbr.org/product/airbnb-a/912019
(accessed on 14 January 2020).
15. Yrigoy, I. The Impact of Airbnb in the Urban Arena: Towards a Tourism-Led Gentrification? the Case-Study
of Palma Old Quarter (Mallorca, Spain). 2016. Available online: https://core.ac.uk/download/pdf/
154376904.pdf (accessed on 14 January 2020).
16. Horn, K.; Merante, M. Is home sharing driving up rents? Evidence from Airbnb in Boston. J. Hous. Econ.
2017, 38, 14–24.
17. Adamiak, C. Mapping Airbnb supply in European cities. Ann. Tour. Res. 2018, 71, 67–71.
18. Sparck Jones, K. A statistical interpretation of term specificity and its application in retrieval. J. Doc. 1972,
28, 11–21.Algorithms 2020, 13, 59 16 of 17
19. Salton, G.; Wong, A.; Yang, C.S. A vector space model for automatic indexing. Commun. ACM 1975,
18, 613–620.
20. Andrade, M.A.; Valencia, A. Automatic extraction of keywords from scientific text: Application to the
knowledge domain of protein families. Bioinformatics (Oxford, England) 1998, 14, 600–607.
21. Engel, D.W.; Whitney, P.D.; Calapristi, A.J.; Brockman, F.J. Mining for Emerging Technologies within Text
Streams and Documents; Technical Report; Pacific Northwest National Lab.(PNNL): Richland, WA, USA, 10
February 2009.
22. Whitney, P.; Engel, D.; Cramer, N. Mining for surprise events within text streams. In Proceedings of the
2009 SIAM International Conference on Data Mining, Sparks, NV, USA, 30 April 2009; pp. 617–627.
23. Matsuo, Y.; Ishizuka, M. Keyword extraction from a single document using word co-occurrence statistical
information. Int. J. Artif. Intell. Tool. 2004, 13, 157–169.
24. Ercan, G.; Cicekli, I. Using lexical chains for keyword extraction. Inform. Process. Manag. 2007,
43, 1705–1714.
25. Abilhoa, W.D.; De Castro, L.N. A keyword extraction method from twitter messages represented as graphs.
Appl. Math. Comput. 2014, 240, 308–325.
26. Yang, K.; Chen, Z.; Cai, Y.; Huang, D.; Leung, H.f. Improved automatic keyword extraction given more
semantic knowledge. In Database Systems for Advanced Applications; Gao, H., Kim, J., Sakurai, Y., Eds.;
Springer: Cham, Switzerland, 2016; Volume 9645, pp. 112–125.
27. Ying, K.; Jingchang, P.; Minglei, W. Research on Sentiment Analysis of Micro-blog’s Topic Based on
TextRank’s Abstract. In Proceedings of the 2017 International Conference on Information Technology,
Jordan, Malaysia, 27 December 2017; pp. 86–90.
28. Petasis, G.; Karkaletsis, V. Identifying argument components through textrank. In Proceedings of the
Third Workshop on Argument Mining (ArgMining2016), Berlin, Germany, 7–12 August 2016; pp. 94–102.
29. Mihalcea, R.; Tarau, P. Textrank: Bringing order into text. In Proceedings of the 2004 Conference on
Empirical Methods in Natural Language Processing, Barcelona, Spain, 25–26 July 2004; pp. 404–411.
30. Manna, S.; Phongpanangam, O. Exploring topic models on short texts: a case study with crisis data. In
Proceedings of the 2018 Second IEEE International Conference on Robotic Computing (IRC), Laguna Hills,
CA, USA, 31 January–2 February 2018; pp. 377–382.
31. Situmorang, K.; Hidayanto, A.; Wicaksono, A.; Yuliawati, A. Analysis on Customer Satisfaction Dimensions
in P2P Accommodation Using LDA: A Case Study of Airbnb. 2018. Available online: http://journal.
portalgaruda.org/index.php/EECSI/article/view/1674/1141 (accessed on 14 January 2020).
32. SÜZEK, T.Ö. Using latent semantic analysis for automated keyword extraction from large document
corpora. Turk. J. Electr. Eng. Comput. Sci. 2017, 25, 1784–1794.
33. Kaur, B.; Jain, S. Keyword extraction using machine learning approaches. In Proceedings of the 2017 3rd
International Conference on Advances in Computing, Communication & Automation (ICACCA)(Fall),
Dehradun, India, 15–16 September 2017; pp. 1–6.
34. Wang, Y.; Zhang, J. Keyword extraction from online product reviews based on bi-directional LSTM
recurrent neural network. In Proceedings of the 2017 IEEE International Conference on Industrial
Engineering and Engineering Management (IEEM), Singapore, 10–13 December 2017; pp. 2241–2245.
35. Chen, Y.; Yang, G.; Jiang, Y.; Liu, X. Monocular Visual Odometry Based on Trifocal Tensor Constraint. In
Journal of Physics: Conference Series; IOP Publishing: Boracay, Philippines, 19–21 January 2018; Volume 976,
p. 012002.
36. Rose, S.; Engel, D.; Cramer, N.; Cowley, W. Automatic keyword extraction from individual documents. In
Text Mining: Applications and Theory; Berry, M.W., Kogan, J., Eds.; John Wiley & Sons: Hoboken, NJ, USA,
2010; pp. 1–20.
37. Roussanoglou, N. Real Estate Investment Firms Get Into Office Building Development. 2019. Available
online: http://www.ekathimerini.com/238554/article/ekathimerini/business/real-estate-investment-
firms-get-into-office-building-development (accessed on 14 January 2020).
38. Gourzis, K.; Gialis, S. Dismantled Spatial Fixes in the Aftermath of Recession: Capital Switching and Labour
Underutilization in the Greek Capital Metropolitan Region. Int. J. Urban. Reg. Res. 2019, 43, 741–759,
39. Athens Short-Term Rental Property: Where to Get the Biggest Bang for Your Buck. 2018. Available
online: https://tranio.com/articles/athens-short-term-rental-property-where-to-get-the-biggest-bang-
for-your-buck/ (accessed on 14 January 2020).Algorithms 2020, 13, 59 17 of 17
40. Short-Term Leasing Financials in Greece Through Airbnb and HomeAway Platforms—INSETE. 2020.
Available online: http://www.insete.gr/Portals/0/meletes-INSETE/01/2019/2019_AirDNA_Short_Stay.
pdf (accessed on 20 February 2020).
41. HomeAway|Book Your Vacation Rentals: Beach Houses, Cabins, Condos & More. Available online:
https://www.homeaway.com/ (accessed on 14 January 2020).
42. Greek Property Sale and Rent Prices Per Area|Spitogatos. Available online: https://en.spitogatos.gr/
property-index (accessed on 14 January 2020).
43. AirDNA|Short-Term Rental Data & Analytics|Airbnb & Vrbo. Available online: https://www.airdna.co/
(accessed on 14 January 2020).
44. Velesioti, A. Airbnb Rentals: The New Eldorados and the “ghosts”—What Did The Evidence for 2019 Show
(In Greek). 2020. Available online: https://www.eleftherostypos.gr/oikonomia/525785-misthoseis-airbnb-
ta-nea-elntoranto-kai-ta-fantasmata-ti-edeixan-ta-stoixeia-gia-to-2019/ (accessed on 14 January 2020).
45. Mauri, A.G. Hotel Revenue Management: Principles and Practices; Pearson Italia Spa: Milano MI, Italy, 2013.
46. Inside Airbnb. Adding Data to the Debate. Available online: http://insideairbnb.com/ (accessed on 14
January 2020).
47. Wieditz, T. Could Airbnb Turn Toronto’s Most Affordable Rental Housing Stock Into Ghost Hotel Suites?
FAIRBNB CA Coalition. 2017. Available online: https://fairbnb.ca/wp-content/uploads/2019/07/
Fairbnb_Report-on-Secondary-Suites_final.pdf (accessed on 14 January 2020).
48. Zadeh, L.A. Fuzzy sets. In Information and Control; Elsevier: Oxford, UK, 1965.
© 2020 by the authors. Licensee MDPI, Basel, Switzerland. This article is an open access
article distributed under the terms and conditions of the Creative Commons Attribution
(CC BY) license (http://creativecommons.org/licenses/by/4.0/).You can also read