A Large-Scale Analysis of Attacker Activity in Compromised Enterprise Accounts
←
→
Page content transcription
If your browser does not render page correctly, please read the page content below
A Large-Scale Analysis of Attacker Activity in
                                                  Compromised Enterprise Accounts

                                             Neil Shah1,2 , Grant Ho1,2 , Marco Schweighauser2 , M.H. Afifi2 , Asaf Cidon3 ,
                                                                           and David Wagner1
                                                                                 1
                                                                                   UC Berkeley
                                                                            2
                                                                                Barracuda Networks
arXiv:2007.14030v1 [cs.CR] 28 Jul 2020

                                                                           3
                                                                                Columbia University

                                                  Abstract. We present a large-scale characterization of attacker activity
                                                  across 111 real-world enterprise organizations. We develop a novel foren-
                                                  sic technique for distinguishing between attacker activity and benign ac-
                                                  tivity in compromised enterprise accounts that yields few false positives
                                                  and enables us to perform fine-grained analysis of attacker behavior. Ap-
                                                  plying our methods to a set of 159 compromised enterprise accounts, we
                                                  quantify the duration of time attackers are active in accounts and exam-
                                                  ine thematic patterns in how attackers access and leverage these hijacked
                                                  accounts. We find that attackers frequently dwell in accounts for multi-
                                                  ple days to weeks, suggesting that delayed (non-real-time) detection can
                                                  still provide significant value. Based on an analysis of the attackers’ tim-
                                                  ing patterns, we observe two distinct modalities in how attackers access
                                                  compromised accounts, which could be explained by the existence of a
                                                  specialized market for hijacked enterprise accounts: where one class of
                                                  attackers focuses on compromising and selling account access to another
                                                  class of attackers who exploit the access such hijacked accounts provide.
                                                  Ultimately, our analysis sheds light on the state of enterprise account hi-
                                                  jacking and highlights fruitful directions for a broader space of detection
                                                  methods, ranging from new features that home in on malicious account
                                                  behavior to the development of non-real-time detection methods that
                                                  leverage malicious activity after an attack’s initial point of compromise
                                                  to more accurately identify attacks.

                                                  Keywords: compromised enterprise accounts · characterization of at-
                                                  tacker activity · account hijacking.

                                         1      Introduction
                                         With the growth of cloud-backed services and applications, ranging from email
                                         and document storage to business operations such as sales negotiations and
                                         time sheet tracking, modern enterprise accounts provide a wealth of access to
                                         sensitive data and functionality. As a result, attackers have increasingly focused
                                         on compromising enterprise cloud accounts through attacks such as phishing.
                                         For example, several government agencies have issued advisories and reports
                                         warning that phishing represents “the most devastating attacks by the most
sophisticated attackers” and detailing the billions of dollars in financial harmed
caused by enterprise phishing and account compromise [18,31]. Not limited to
financial gain, attackers have also compromised enterprise cloud accounts for
personal and political motives, such as in the 2016 US presidential election,
when nation-state adversaries dumped a host of internal emails from high-profile
figures involved with Hillary Clinton’s presidential campaign and the Democratic
National Committee [37].
Given the growing importance of online accounts and credentials, a large
body of existing work has focused on building mechanisms to defend against at-
tacks through better credential hygiene, detecting phishing attacks, and stronger
user authentication [14,15,20,22,23,33,36]. Despite these advances, account hi-
jacking, the compromise and malicious use of cloud accounts, remains a widespread
and costly problem [8]. Although prior work has characterized what attackers do
with a hijacked account, [13,30,35], existing work focuses heavily on compromised
personal email accounts. While these insights are useful, it remains unclear how
well they generalize to compromised enterprise accounts and whether attacks
on enterprise accounts have different characteristics. Unlike personal accounts,
enterprise accounts often have access to a wealth of sensitive business data, and
an attacker who compromises one enterprise account can use the identities of
the compromised account to launch additional attacks on other employees, ex-
panding their access to other data and assets within the enterprise.
To close this knowledge gap and identify additional avenues for defending
enterprise accounts, we conduct a large-scale analysis of attacker activity within
compromised enterprise accounts. We analyze a historical dataset of nearly 160
real-world compromise accounts from over 100 organizations that have been
confirmed as compromised by both a commercial security product (Barracuda
Networks) and by the organization’s IT or security team. First, given a com-
promised account, we develop a method that allows us to identify what account
actions correspond to activity by the attacker versus the benign user.Evaluating
our approach on a random sample of enterprise accounts, we find that our foren-
sic technique yields a false positive rate of 11% and a precision of 94%.
Using this method for fine-grained attacker behavior analysis, we find that for
over one-third of the hijacked accounts in our dataset, the attacker’s activity oc-
curs across a week or more. This extended dwell time suggests that there is value
in developing (non-real-time) detection techniques that analyze account behavior
over longer time horizons to more accurately identify compromise and mitigate
an attack before its completed execution. Additionally, based on a deeper analy-
sis of the access timing patterns within these accounts, we identify two different
modes in the way attackers utilize hijacked accounts. In particular, the access
patterns of hijacked accounts with long durations of attacker activity could re-
flect the existence of a specialized market of account compromise, where one set
of attackers focuses on compromising enterprise accounts and subsequently sells
account access to another set of attackers who focus on utilizing the hijacked
account.
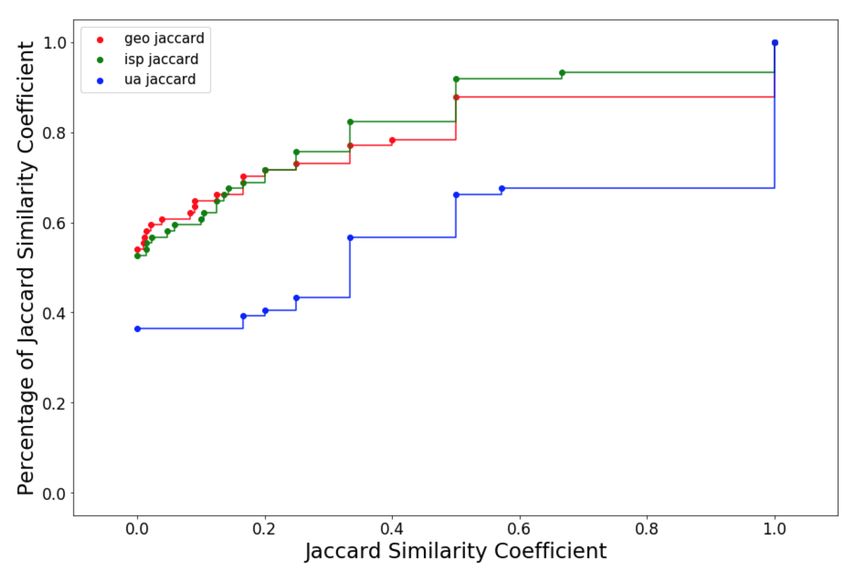
2Fig. 1. Categorization of the 120 organizations in our dataset across various economic
sectors.
Finally, examining the kinds of data and applications that attackers access via
these enterprise accounts, we find that most attackers in our dataset do not access
many applications outside of email, which suggests that either many enterprise
cloud accounts do not have access to interesting data and functionality outside
of email, or that attackers have yet to adapt to and exploit these additional
resources.
2 Data
Our work starts with a historical dataset consisting of 989 compromised en-
terprise accounts from 120 real-world organizations. We rely on two pieces of
information for ground-truth labeling. First, all of these organizations use a
commercial anti-fraud service (Barracuda Sentinel) for preventing phishing and
account takeover attacks [2,14]. For each of the compromised accounts in our
dataset, Barracuda’s detectors flagged at least one event (e.g., a user login or a
user-sent email) as malicious. Additionally, all of these compromised instances
were verified by their organization’s IT or security team. For the remainder of
the paper, we will use the terms compromised enterprise account, compromised
user, compromised account, and account interchangeably.
Figure 1 shows the distribution of the 120 organizations by economic sector. A
majority of these organizations belong to the industrials, education, health, and
people services economic sectors, with counts of 28, 26, 14, and 10 respectively.
These four sectors represent 65% of the set of organizations in our dataset.
32.1 Schema and Data Sources
Our dataset consists of Microsoft Office 365 cloud audit log events [3,6] for all
of the compromised accounts we study. Each time a user logs into their account,
accesses an Office 365 application (e.g., Outlook, Sharepoint, and Excel), or
performs an account operation (e.g., a password reset), Office 365 records an
audit log event. Across the 989 compromised accounts, our dataset consists of
927,822 audit log events from August 1, 2019 – January 27, 2020, where each
account was marked as compromised during that time window. At a high level,
each audit event in our logs includes the following key fields:
– Id - Unique identifier for an audit event
– UserId - Email of user who performed the operation
– UserAgent - Identifier string of device that performed the operation
– ClientIp - IP address of the device that performed the operation
– Operation - Operation performed by the user
– ApplicationId - Id of Office 365 application acted upon
The Operation field indicates which cloud operation the user performed, such
as a successful user login or a password reset. Note that based on the way Office
365 generates these audit events, only events that reflect an account login or
application access contain values for UserAgent and ClientIp; audit events for
other operations (such as a password reset event) don’t contain user agent or IP
address information. Throughout the paper, we will refer to the audit events that
are login or application accesses as “application login events” or “login events”.
We also augment the information above by using MaxMind [28] to identify the
country and country subdivision (e.g., state or province) of each available Client
IP address.
Additionally, we draw upon several other data sources to help evaluate our
technique for distinguishing between benign versus attacker activity within a
compromised account (Appendix A.2): the raw emails sent by users in our
dataset and any audit events, emails [4], and inbox forwarding rules flagged
by Barracuda’s machine learning detectors for the compromised users.
As we discuss in Section 3.2, in order to prevent a large batch of compromised
accounts from a single attacker or organization from skewing our analysis results,
we de-duplicate this set of 989 compromised accounts to a final dataset of 159
compromised accounts across 111 organizations.
2.2 Ethics
This work reflects a collaboration between researchers at UC Berkeley, Columbia
University, and a large security company, Barracuda Networks. The set of or-
ganizations included in our dataset are customers of Barracuda, and is secured
using standard industry best practices.
Due to the confidential nature of account data, only authorized employees
of Barracuda Networks accessed the data, and no sensitive data was released
to anyone outside of Barracuda Networks. Our project received approval from
4Barracuda Networks, and strong security controls were implemented to ensure
confidentiality and limited scope of access.
3 Detecting Attacker Activity
Compromised accounts contain a mix of activity, such as application accesses
(logins), from both the true user and an attacker. In order to accurately analyze
attacker usage of hijacked accounts, we developed a ruleset, based on well-known
anomaly detection ideas [10,32], for identifying which audit events correspond
to activity from the attacker versus a benign user.
Throughout this section, when describing the components of our rule set,
we use the name Bob to refer to a generic compromised user from our dataset.
Our rule set first builds a historical profile for Bob that represents the typical
locations and user agent strings that he uses to log into his account. We then
use this profile to classify future login events as either attacker-related or benign
by identifying actions that deviate from the historical profile. Our rule set is not
guaranteed to find every attack, nor does it guarantee robustness against moti-
vated attackers trying to evade detection. However our rule set is still relatively
comprehensive and generates few false positives.
3.1 Historical User Profile and Features
Historical User Profile Conceptually, a user’s historical profile reflects the
typical activity (operations, login provenance, etc.) that the user makes under
benign circumstances. To construct this profile, we assume that historical login
events that occurred significantly (one month) before any known compromise
activity reflect benign behavior by the true user. For each compromised user
(Bob), we find the earliest time, t, that any of Barracuda’s detectors flagged the
account as compromised. To create Bob’s historical user profile, we first retrieve
a set of historical login events from the time window of 2 months prior to t until 1
month prior to t (i.e., one-month of historical data). From this historical dataset,
we construct a historical profile for Bob that consists of 3 sets of values: the set
of country subdivisions (states or provinces) that he logged in from during that
time period, the set of countries he has logged in from, and the set of user agents
that he has logged in with.
Features Given a recent event, e, that we wish to classify as malicious or
benign activity, we extract 2 features based on a user’s historical profile. First,
we extract a numerical geolocation feature by comparing the geolocation of e’s
IP address to the set of geolocations in the user’s historical profile:
(a) If e represents a login from a country that was never seen in Bob’s historical
user profile, then assign e’s geolocation feature value a 2 (most suspicious).
(b) Otherwise, if e represent a login from a country subdivision not found in
Bob’s historical user profile, then assign e’s geolocation feature value a 1
(medium suspicion).
5(c) Otherwise, assign e’s geolocation feature value a 0 (least suspicious).
We also extract a user agent feature that captures the suspiciousness of the
user agent of e. All user agents are normalized in a pre-processing step: the
version number is removed and only the device and model identifiers are retained,
so a user agent string such as iPhone9C4/1706.56 is normalized to iPhone9C4.
Thus, iPhone9C4/1706.56 and iPhone9C4/1708.57 yield the same normalized
user agent. The user agent feature is then defined as follows:
(a) If e’s normalized user agent does not match any of the normalized user agents
in Bob’s historical user profile, then assign e’s user agent feature value a 1
(most suspicious).
(b) Otherwise, assign e’s user agent feature value a 0 (least suspicious).
3.2 Classification Rule Set
In order to identify the set of attacker actions within a compromised account, we
start by selecting the first known compromise event that Barracuda’s detectors
marked as malicious and that was confirmed by the organization’s IT team. Next,
we compute a user’s historical profile as described above and use it to extract
features for every login event in a two-month window centered around this first
confirmed compromise event (i.e., all login events in the month preceding this
initial compromise time as well as all login events in the one month following
the initial compromise time). We then apply the following set of rules to classify
the login events in this “recent” two-month window as attacker activity or not.
Below, we present a high-level sketch of our rule set and discuss assumptions
made in the development of our rules. We defer further details and evaluation
results to Section 3.2 and Appendix A.2.
Rules For a compromised account (Bob), each recent event contains a geolo-
cation feature, denoted as geo, and a user agent feature, denoted as ua, as
described above. Given these features, we mark an event as malicious or benign
based on the following rule set:
if geo == 2
mark e as malicious (attacker related)
else if (geo == 1) and (ua == 1)
mark e as malicious
else
mark e as benign
Intuition and Assumptions The geolocation and user agent features quantify
the suspiciousness of a new login event in relation to a user’s historical profile.
We assume that the historical login events for each user do not contain attacker
activity; i.e., that the attacker has not operated within the account for over
one month prior to detection. However, it is possible that some of the events
6shortly preceding the initial confirmed compromise could be attacker related.
Thus, we conservatively analyze one month’s worth of events preceding a user’s
first confirmed compromise event to more comprehensively capture and analyze
the full timeline of an attack.
Our rule set also assumes that it is less common for users to travel to another
country than to another state or province within their home country. Although
traveling abroad is common in some industries, we assume that most employees
travel more frequently to another state or region within their residential country
rather than to an entirely different country. As a result, if a login event contains
an IP address mapped to a country that was never seen before in a user’s his-
torical login events, the event in question is marked as an attacker event. For
travel within the same country, the country subdivision and user agent need to
be new for a login event to be marked as an attacker event.
Applying Rule Set to Compromised Users For each user Bob, we classify
all login events from one month prior to t to t using a historical user profile
based on events from two months prior to t to one month prior to t. Then, we
classify all events from t to one month after t using a historical user profile based
on events from two months prior to t to one month prior to t, and all events
from one month prior to t to t that were classified as benign. Thus we update the
historical user profile for each user after classifying the first month of login events
[7]. Malekian et al. also describes a similar approach [27] where the historical
profile is updated to reflect new patterns in user behaviors in e-commerce for
the purposes of detecting online user profile-based fraud. Therefore, the last
month of Bob’s events are classified using an updated historical user profile that
incorporates benign activity from his previous month of login events.
After applying this rule set to the 989 compromised accounts in our dataset,
we identified 653 accounts (across 111 organizations) that contained at least one
attack event. 276 of the 989 compromised users didn’t have any historical login
events due to the fact that these users’ enterprises registered with Barracuda as
a customer after the start of our study period, and we did not have login events
from before then. As a result, our rule set couldn’t be applied to these users. Of
the remaining 713 users that had historical login events, 653 had at least one
attacker event that our rule set classified.
We also found that 68% of the 653 compromised accounts belonged to only 6
organizations. We do not know what accounts for this skewed distribution, but it
is possible that one or a few attackers specifically targeted those 6 organizations.
Therefore, to ensure that our analysis results in Section 4 are not biased by a few
attackers that compromised many accounts, we randomly sampled a subset of
compromised accounts from each of the 111 organizations, resulting in a dataset
of 159 compromised accounts that we use for our analysis in Section 4. Appendix
A.1 contains more details about our sampling procedure, as well as a detailed
breakdown of the 653 compromised users across the 111 organizations.
In order to evaluate the accuracy of our rule set at labeling an event as
malicious or not, we randomly sampled a set of 20 compromised accounts and
7manually labeled each event based on the analysis procedure described in Ap-
pendix A.2. Our evaluation suggests that our rule set has a false positive rate of
11% and precision of 94%.
Limitations of Rule Set and Attacker Evasion Although our rule set has
relatively high precision, we acknowledge some limitations that exist with our
rules and features. Given the construction of our rule set, if a motivated attacker
logs in from a state that the typical user has logged in from or with a device
and model that matches that of the typical user, the attacker would successfully
evade our rule set.
We did observe evidence of attackers trying to “blend in” with benign char-
acteristics of some users, potentially to evade detection. For the 60 compromised
enterprise accounts mentioned above in Section 3.2 in which our rule set classi-
fied no events as attacker-related, we took a random sample of 10 accounts and
performed deeper analysis of the events that our rule set classified as benign.
For 6 of the 10 accounts, we found that attackers only logged in from locations
close in proximity to those logged in by the true user of the account (within the
same states as the typical user). The geolocations appeared normal and since all
10 of these accounts were flagged by Barracuda’s detectors, this is evidence of
likely evasive behavior. This potentially evasive behavior parallels a result from
Onaolapo et al. [30], where they found that attackers deliberately choose their
geolocations to match or come close to ones used by the true user in an effort
to evade detectors that look for anomalous geolocations.
For the remaining 4 accounts, we see a combination of logins from close
geolocations to ones used by the true user and further geolocations (e.g. different
province), but it is unclear if the logins from different provinces originate from
the attacker or not given the similar user agent strings (same device and model)
that are present in the event logs. This could be potential evidence for user agent
masquerading, but additional work would be needed to explore this idea further.
4 Characterizing Attacker Behavior
In this section, we conduct an analysis of attacker behavior across our dataset of
159 compromised users belonging to a total of 111 organizations. Our analysis
reveals three interesting aspects of modern enterprise account hijacking. First,
we find that for a substantial number of accounts (51%), malicious events oc-
cur over multiple days. From a defensive standpoint, this suggests that while
real-time detection is ideal, detectors that identify attacks in a delayed manner
(e.g., as a result of using features based on a longer timeframe of activity) might
still enable an organization to thwart an attack from achieving its goal. Sec-
ond, we observe evidence that at least two distinct modes of enterprise account
compromise exist. In particular, we estimate that 50% of enterprise accounts
are compromised by attackers who directly leverage the information and access
provided by the hijacked account. In contrast, for roughly one-third of the the
compromised accounts in our dataset, the attackers’ access patterns suggest a
8compromise strategy where one set of attackers compromised the account and
then sold access to the account (i.e., its credentials) to another set of actors
who ultimately leveraged the account for malicious purposes (e.g., by sending
spam or phishing emails). Finally, we find that attackers who compromise enter-
prise accounts primarily use the accounts for accessing email-related information
and functionality; 78% of the hijacked accounts only accessed email applications
across all their attacker events. Given that attackers did not access other appli-
cations (such as SharePoint or other corporate cloud applications), this suggests
that a number of real-world attackers have not yet investigated or found value
in accessing other data and functionality provided by these enterprise accounts,
outside of email.
4.1 Duration of Attacker Activity and Damage Prevention
In this section, we estimate the length of time attackers are active in enterprise
accounts. Our results suggest that in many cases, attackers spend multiple days
exploiting the information and functionality within enterprise accounts. This
suggests that even if a detector doesn’t operate in a real-time fashion, it can still
prevent attackers from inflicting significant damage.
Duration of Attacker Activity Given our dataset of 159 compromised users
and their respective login events, we cannot definitively determine how long an
attacker compromised the account for. However, we can estimate a reasonable
lower bound on the length of time an attacker is active within an account (i.e.
logging in and accessing the account). For each user, we computed the differ-
ence (in seconds) between the time of the earliest attacker login event and the
time of the last attacker login. As seen in Figure 2, across all 159 compromised
enterprise accounts, attackers appear to use and maintain access to many enter-
prise accounts for long periods of time. In almost 51% of the enterprise accounts
within our dataset (81 out of 159), attackers are active for at least 1 day and in
37% of accounts, attackers are active for at least 1 week. As a result, while it’s
important to detect attacks in real-time, detection can still provide significant
value even if it occurs after the initial compromise.
As an example of where non-real-time detection can still mitigate significant
harm, we analyzed accounts that sent at least one malicious email flagged by one
of Barracuda’s detectors during the two month “attack window” that we applied
our rule set on. Across the 11 corresponding accounts, 7 out of the 11 accounts
(63%) exhibited a 3 day gap between the first malicious login event identified by
our rule set and the first phishing email sent by the account (Appendix B shows
the full interarrival distribution for all 11 accounts). In these instances, with a
long gap between the initial compromise and the first phishing email, a detector
that uses more computationally expensive features or detection methods, which
might not be feasible to run in real-time, could prevent a significant portion of
the attack activity. In the absence of such a detector, even providing manual
tools for organizations to investigate whether the compromised account affected
additional ones may prove beneficial.
9Fig. 2. The distribution of time (seconds) between the first and last attacker login
event across the compromised accounts in our dataset.
4.2 Attacker Account Access Patterns
In this section, we explore the different modes in which attackers access these
hijacked accounts. We estimate that in 50% of our sample of enterprise accounts,
a single attacker conducts both the compromise and utilization of the account.
However, for many of the remaining accounts, both the timing and application
access patterns suggest that potentially two or more attackers compromise and
access the hijacked account. This access pattern would be consistent with the
existence of a specialized market for compromised enterprise accounts, where one
set of attackers conducts the compromise and another attacker buys access to
the compromised account and obtains value from the account (e.g., by accessing
sensitive information or sending spam or phishing emails).
End-to-End Attackers Revisiting our findings from Section 4.1, we found
that 81 out of 159 enterprise accounts (51%) are compromised for at least 1 day,
suggesting that there are largely two main segments of compromised enterprise
accounts; those that are compromised for less than a day and the remaining that
appear to be compromised for a day or more. Given this preliminary result, we
aim to investigate the relationship between duration of attacker activity and the
economy and existence of various modes of attackers operating in the enterprise
account space.
We start by investigating whether enterprise accounts are generally accessed
regularly by attackers or in isolated pockets of time during the compromise life-
cycle. For each of the 159 compromised enterprise accounts, we compute the
10interarrival time (absolute time difference) between every pair of successive at-
tack events sorted in time. We then take the max interarrival time for each user,
which represents the longest time gap between any two successive attacker ac-
cesses within an account. From Figure 3, which shows a CDF of the max attacker
Fig. 3. Distribution of the maximum attacker interarrival times (seconds) for all 159
enterprise accounts. The maximum attacker interarrival corresponds to the longest time
gap between two consecutive attack events.
interarrival times in seconds for all 159 compromised enterprise accounts, we can
see that at around the 1 day mark (first red line from the left), the inflection and
trend of the CDF start to change. In 53% of compromised enterprise accounts,
the largest time gap between successive attacker accesses is less than 1 day, while
the remaining 47% of compromised enterprise accounts (74 out of 159) have 1
or more days as their longest time gap.
A short attack life cycle (i.e., less than 1 day) seems to reflect an end-to-end
compromise approach: where a single actor compromises an account and also
leverages its access for further malicious actions. In our dataset, 78 out of the
159 enterprise accounts (50%) fall within this category. Due to the small time
gaps between successive attacker events and relatively small durations of time
attackers are active, these 78 accounts are likely compromised by a single set of
attackers that both perform the compromise and use the accounts for a short
period of time; it is also possible that some of these cases reflect compromise
within an organization that rapidly identified and responded to the compromise
incident.
11Segmented Account Access As seen in Figure 3, 53% of enterprise accounts
(74 out of 159) experienced a maximum of 1 or more days between successive
attacker events. One possible explanation of the large time gap is that the initial
set of attackers that compromised these accounts sold them to another set of
attackers; hence, the time gaps represent the time needed for the transaction to
complete. Exploring this theory, we compared attacker events before and after
the max attacker interarrival time in these 74 accounts on the basis of geolo-
cation, user agent, and internet service providers (ISPs). If the two periods of
activity have significant differences across these three attributes, then that sug-
gests that the two different activity windows could reflect access by two different
sets of attackers.
To quantify the similarity of the two sets of attributes before and after the
max interarrival time, we use the Jaccard Similarity Coefficient. Given two sets of
data A and B, the Jaccard Similarity Coefficient relates the number of elements
in the set intersection of A and B to the number of elements in the set union of
A and B. It has been widely used in many fields [12,21,29,38] such as keyword
similarity matching in search engines to test case selection for industrial software
systems.
For each of the 74 compromised enterprise accounts, we gather two sets of
country subdivisions mapped to attacker events before and after the max at-
tacker interarrival time respectively. Similarly, we gather two sets of user agents
and two sets of ISPs in the same manner. We then compute 3 Jaccard similarity
coefficients for geolocation, user agent, and ISP respectively. In Figure 4, most
of the enterprise accounts have low Jaccard similarity coefficients for geolocation
and ISP; one reason the user agent curve follows a different pattern is because
of the normalization we performed, where we treat user agent strings with dif-
ferent device versions as the “same” underlying user agent. 50 of the enterprise
accounts (around 70% of 74) had Jaccard similarity coefficients of 0.3 or less
for geolocation and ISP, indicating that the sets of country subdivisions and
ISPs before and after the large time gaps in these accounts were substantially
different.
We also show in Appendix C.1 that if attackers are using proxy services
for obtaining IP addresses, in 85% of the 74 compromised enterprise accounts,
these services are fairly stable; hence, the low geolocation Jaccard similarity
coefficients are not a result of attackers using unstable anonymized IP proxies
or even Tor.
Given the large time gaps between successive attacker events and low simi-
larity of the access attributes between these attack periods, we believe that 50
of the 159 enterprise accounts (31%) reflect the exploitation of a hijacked ac-
count by multiple attackers. For example, these hijacked accounts could reflect
compromise that results from a specialized economy, where one set of attack-
ers compromise the accounts and sell the account credentials to another set of
attackers that specialize in monetizing or utilizing the information and access
provided by the enterprise account.
12Fig. 4. Distribution of the Jaccard Similarity between Geolocation, User Agent, and
ISP usage across the two time-separated attacker access periods; 74 compromised en-
terprise accounts had long time gaps (max interarrival times) between attacker access
events.
In terms of understanding the potential damage inflicted by the two sets
of attackers, we found that in 30 of the 50 accounts (60%), the second set of
attackers that utilize the accounts access Office 365 applications at a higher
rate than the first set of attackers. This further shows the importance of early
mitigation in compromised enterprise accounts and that non-real-time detectors
should be designed to monitor continuous activity in order to prevent future
damage after an account is sold. Details of our analysis are shown in Appendix
C.2.
Overall, in this section, we identified two distinct patterns of compromise and
access behavior that reflect attacker behavior across 81% of enterprise accounts.
For many of these accounts, significant differences between the attacker’s login
location and access patterns suggest that modern enterprise account exploitation
consists of two phases conducted by separate types of attackers: those who com-
promise the account and those who leverage the hijacked account’s information
and functionality.
134.3 Uses of Compromised Enterprise Accounts
In this section, we explore how attackers use enterprise accounts. In our dataset,
attackers do not appear to establish additional access footholds into the account:
they rarely change account passwords and never grant new OAuth access. In
addition, within the Office 365 ecosystem, we find that attackers are not very
interested in many cloud applications outside of email; 78% of the enterprise
accounts only accessed email applications through attack events.
Other Operations Performed During Attacker Window As we discussed
in Section 2, every audit event has an Operation field that specifies the action
that was taken. The operations we are most interested in learning if attackers
perform are ones that affect a user’s ability to access their account; namely,
operations such as “Change user password” and “Add OAuth”. The operation
“Change user password” enables the user to change the password to their ac-
count, while the “Add OAuth” operation enables a user to grant applications
access to certain data within their account. Since our rule set only classifies lo-
gin events due to the non-empty IP and user agent fields, we gather all “Change
user password” and “Add OAuth” audit events that are close in time to each
account’s attack events.
We find that only 2 out of 159 compromised enterprise accounts (2%) had at
least one “Change user password” operation performed close in time to attacker
activity. Looking deeper into the 2 accounts, we see the presence of more attacker
activity after the change password operations were performed, indicating that
these operations were performed by the attacker themselves. None of the 159
accounts had a single “Add OAuth” operation performed during the time period
of attacker activity. Taken together, these findings suggest that attackers are not
interested in changing a users password or adding OAuth to a users account, as
this might reveal to the user that their account has been compromised and
limit the amount of time the attacker can operate in the account. As a result,
a “Change user password” event or “Add OAuth” event are likely not good
features for detectors, as they are rarely found performed by an attacker.
Unusual Application Accesses by Attackers We now aim to understand
if there are specific Office 365 applications outside of frequently accessed email
applications, such as Microsoft Exchange and Microsoft Outlook, that attackers
access but the true users of the accounts don’t access.
There were a total of 21 non email-related Office 365 applications that were
accessed by at least one of the 159 accounts. For each of the 21 non-email applica-
tions, we determined the number of accounts that only accessed the application
through their attack events and the number of accounts that only accessed the
application through their benign events. The results for each of the 21 non-email
applications are shown in the stacked bar chart in Figure 5. Surprisingly, other
than Ibiza Portal, none of the remaining 20 applications had the characteris-
tic of more accounts accessing it only through attack events than number of
14Fig. 5. Bar chart comparing number of accounts accessing each of the 21 non-email
applications via only attacker-labeled events and number of accounts accessing non-
email applications via only benign events from August 1, 2019 – January 27, 2020.
accounts accessing it through benign events. 3 accounts accessed Ibiza Portal
only through attack events, while only one account accessed it solely through
benign events. Ibiza Portal, or Microsoft Azure portal, [5] enables users to build
and monitor their enterprise’s web and cloud applications in a simple, unified
place; therefore, it might allow an attacker to view confidential data within an
enterprise’s applications, but retrieving that data may take longer compared to
other file-sharing applications, such as Microsoft SharePoint or Microsoft Forms.
In addition, Microsoft Azure Portal is very rarely accessed by true users of en-
terprise accounts (only one account ever accessed Microsoft Azure Portal during
their benign events). Therefore, based on our dataset of compromised enterprise
accounts, it does not appear that attackers are accessing cloud-based applica-
tions that typical users don’t access within the Office 365 ecosystem. Therefore,
in the current state, building features for detectors around atypical accesses
to cloud-based applications may not aid much in detecting attacker activity
post-compromise. Future work would involve exploring additional cloud-based
applications outside of Office 365.
Applications that Attackers Commonly Use In this section, we aim to
understand the types of cloud applications that attackers exploit in enterprise
accounts, regardless of how common the application is for enterprises to use.
Most attackers favor email-related applications. We found that in 98% of
compromised enterprise accounts (156 out of 159), attackers accessed at least one
email-related Office 365 application. Much of the previous work in understanding
compromised personal accounts found that attackers tended to go through user’s
inboxes and send phishing emails; we now see that at scale, attackers seem to be
exhibiting similar behavior in enterprise accounts. We also found that in 78% of
15compromised enterprise accounts (124 out of 159), attackers only accessed email-
related Office 365 applications. We speculate that this may be because examining
a user’s inbox is sufficient for attackers who want to learn more about the user
and the enterprise the account belongs to.
In terms of non-email-related Office 365 applications, Microsoft Sharepoint
has the highest percentage of accounts that access it through attack events
(17%), with Bing as the second highest percentage at 3%. A full bar chart show-
ing the percentage of enterprise accounts that access each non-email related
Office 365 application through attack events is shown in Appendix D. Given
the wide range of Office 365 cloud applications accessible by attackers and the
abundance of information these applications harbor, it is surprising that attack-
ers don’t access these applications more often. Attackers of enterprise accounts
still generally favor email-related applications, such as Microsoft Outlook, which
offer a quick and convenient way for an attacker to gain access to contact lists
and learn about any confidential and financial information tied to the employee
and or enterprise.
5 Related Work
In this section, we highlight previous works that study detection and characteri-
zation of compromised accounts. We also draw comparisons between our findings
in the space of compromised enterprise accounts and that of previous work.
5.1 Overview of Previous Work
Detection and Forensics There has been an extensive amount of literature
proposing various techniques from machine learning and anomaly detection for
detecting phishing attacks in personal and enterprise accounts on a smaller scale
[9,11,19,24] and on a large scale [14,22,23,33]. In addition, a limited amount of
prior work exists on detecting compromised accounts [16,26] through the use of
honeypot accounts and personal accounts on social networks.
Liu et al. in [26] monitored the dangers of private file leakage in P2P file-
sharing networks through the use of honeyfiles containing forged private infor-
mation. Their work focused more on the use of honeyfiles instead of account
credentials and doesn’t study compromised accounts outside of P2P.
Egele et al. in [16] developed a system, called COMPA, for detecting compro-
mised personal accounts in social networks. COMPA constructs behavior profiles
for each account and evaluates new messages posted by these social networking
accounts by comparing features such as time of day and message text to the
behavioral profiles. They measured a false positive rate of 4% on a large-scale
dataset from Twitter and Facebook. However, their work only studies how to
detect compromised personal accounts and doesn’t include enterprise accounts.
As a result, none of the works in the literature have performed analysis to
understand attacker activity in enterprise accounts post-compromise. Our work
addresses this gap by presenting a forensic technique that allows an analyst or
16organization to distinguish between attacker and benign activity in enterprise
accounts.
Characterization Although there has been prior work on understanding at-
tacker behavior and patterns within compromised accounts [13,17,30,34], most
of this research has been primarily focused on understanding the nature of com-
promised personal accounts; few efforts have been examined the behavior of
attackers in compromised enterprise accounts at large scale.
TimeKeeper, proposed by Fairbanks et al. [17], explored the characteristics
of the file system in honeypot accounts controlled by attackers. Although their
work applied forensic techniques to honeypot accounts post-compromise, they
operated at small scale and only characterized attacker behavior in relation to
file systems on these accounts.
Onaolapo et al [30] studied attacker behavior in small-scale hijacked Gmail
accounts post-compromise and characterized attacker activity based on where
the account credentials were leaked. They also devised a taxonomy of attacker
activity accessing the Gmail accounts, noting the presence of four attacker types
(curious, gold diggers, spammers, and hijackers). However, their work did not
examine compromised enterprise accounts and they were only able to monitor
certain actions, such as opening an email or creating a draft of an email.
Bursztein et al. [13] examined targeted account compromise through the
use of various data sources, such as phishing pages targeting Google users and
high-confidence hijacked Google accounts. However, their work focuses on com-
promised personal accounts and not on enterprise accounts.
5.2 Comparing Enterprise versus Personal Account Hijacking
Duration of Attacker Activity Extensive prior works have studied how long
attackers remain active within personal accounts, but none have studied this
characteristic in compromised enterprise accounts. Thomas et al. [34] studied
account hijacking in the context of social media by analyzing over 40 million
tweets a day over a ten-month period originating from personal accounts on
Twitter. They found that 60% of Twitter account compromises last a single day
and 90% of compromises lasted fewer than 5 days. However, in our work with
compromised enterprise accounts, we find that in 37% of accounts, attackers
maintain their access for 1 or more weeks.
Onaolapo et al. [30] also found that the vast majority of accesses to their
honey accounts lasted a few minutes or less. However, their work also notes
that for about 10% of accesses by ”gold digger” attackers (those that search
for sensitive information within an account) and for most accesses by ”curious”
attackers (those that repeatedly log in to check for new information), attacker
activity lasted several days. These two modalities, of short and long compromise
durations, also manifests itself in our results, where attackers in nearly half of
the compromised accounts in our dataset conducted all of their activity within
one day, but over one-third of hijacked accounts experienced attacker activity
across multiple days or weeks.
17Attacker Account Usage Patterns. Onaolapo et al. also devised a taxonomy
of attacker activity and categorized four different attacker types (curious, gold
diggers, spammers, and hijackers) based on personal honeypot accounts leaked
to paste sites, underground forums, and information-stealing malware. Addition-
ally, Onaolapo et al. found that the largest proportion of ”gold digger” accesses
came from honey accounts leaked on underground forums where credentials are
shared among attackers. In our work, we explore the potential for an economy of
compromised enterprise accounts and the different modes in which attackers ac-
cess these hijacked accounts. We estimate that in 50% of our sample of enterprise
accounts, a single attacker conducts both the compromise and utilization of the
account. Additionally, we find that roughly one-third of accounts in our dataset
appear to be accessed by multiple attackers; one explanation for this could be
the existence of a specialized market for compromised enterprise accounts where
one attacker conducts the compromise and another attacker likely buys access to
the compromised account and obtains value from the account (e.g., by accessing
sensitive information or sending spam or phishing emails). Such an economy,
where compromised enterprise accounts are also sold in underground forums,
would be consistent with the findings in Onaolapo et al.
Uses of Compromised Accounts. Much of the prior work in the space of en-
terprise and personal accounts has studied attacker activity from the perspective
of detecting phishing emails. For example, Ho et al. [22] conducted the first large-
scale detection of lateral phishing attacks in enterprise accounts. We find that
within the space of compromised enterprise accounts, email-related applications
still seem to be the most common and desired way attackers obtain informa-
tion within accounts. This suggests that either many enterprise cloud accounts
may not have access to interesting data outside of email or that attackers have
yet to exploit these additional sources of information in enterprise accounts. As
a result, email remains an important direction of analysis within the space of
compromised enterprise accounts.
6 Summary
In this work, we presented a large-scale characterization of attacker activity
in compromised enterprise accounts. We developed and evaluated an anomaly-
based forensic technique for distinguishing between attacker activity and benign
activity, enabling us to perform fine-grained analysis of real-world attacker be-
havior. We found that attackers dwell in enterprise accounts for long periods of
time, indicating that in some situations, non-real-time detectors that leverage
more computationally expensive approaches and features can still provide sig-
nificant defensive value. Based on the timing of attacker behavior, we infer that
a specialized market for compromised accounts might exist, with some attackers
developing skills specific for stealing credentials and other attackers specializing
in how to extract information and value from a hijacked account. Finally, we
find that most attackers in our dataset do not access many applications outside
18of email, which suggests that attackers have yet to explore the wide-range of
information within cloud applications.
7 Acknowledgements
We thank Professor Raluca Ada Popa and the anonymous reviewers for their
extremely valuable feedback. This work was supported in part by the Hewlett
Foundation through the Center for Long-Term Cybersecurity, an NSF GRFP
Fellowship, and by generous gifts from Google and Facebook.
A Rule Set Extended Details
A.1 Extended Details on Applying Rule Set
Fig. 6. Categorization of the 111 organizations in our dataset based on number of
compromised user accounts.
After applying our rule set on the original set of 989 compromised users, we
obtained 653 compromised users that had at least one attacker event classified.
Across these 653 compromised users, our attacker rule set labeled 17,842 au-
dit events as attacker-related. Figure 6 shows the distribution of compromised
accounts among organizations. 98 of the 111 organizations (89%) had 1–5 com-
promised users, 12 organizations had 6–200 compromised users, and 1 organiza-
tion had over 200 compromised users, precisely 206. Moreover, 68% of the 653
19compromised accounts belong to 6 organizations. As a result, it is possible that
one or a few attackers specifically targeted those 6 organizations. Therefore, to
ensure that we obtain many different attackers and our results are not biased
by a few attackers that compromise many accounts, we grouped each of the 653
compromised users by organization and month of earliest attack event flagged by
our rule set and randomly selected one compromised user from each group. This
resulted in a final sample of 159 compromised users across the 111 organizations.
A.2 Evaluation
In this section, we evaluate our attacker rule set. We first describe how we
sampled a set of users and established ground truth labels for login events.
We then show how well our rule set performs on the sample of users. Overall,
our rule set generates few false positives and offers a promising direction for
distinguishing between attacker activity and benign activity at the granularity
of login events.
Evaluation Methodology We evaluated our rule set on 159 compromised
enterprise accounts that each have attacker events classified by the rule set.
To understand how effective our rules are, we randomly sample 20 users and
manually evaluate the accuracy of the rule set on these users. For each of the 20
sampled users, we also randomly sample up to 2 sessions labeled by our rule set
as attacker-related and 1 session labeled as benign, where we define a session to
consist of all events with the same (IP address, user agent) pair value; all events
within the same session are assigned the same label by our rule set. Across the
sample of 20 users, we evaluate a total of 54 sessions, 34 of which are labeled as
attacker-related sessions and 20 as benign.
Establishing Ground Truth In order to evaluate whether the labels our rule
set applies to sessions are correct, we must develop a way to reason about what
the ground truth labels for sessions are. Just knowing that a user has been com-
promised does not give us much information on which particular login events
are performed by the attacker. In this section, we describe four basic indicators
that we apply to each of the 54 sessions to help us gain confidence on what
the “true” labels are for the sessions when evaluating the rule set. We note that
since the four basic indicators discussed in this section are not perfect in terms of
determining the true label for sessions, we also perform a more extensive manual
analysis for sessions in which the basic indicators label a session as benign and
our rule set labels the session as attacker-related to ensure comprehensiveness.
Due to our conservative approach, we aim to limit the false positives of our rule
set and thus obtain a more refined label through manual analysis when the ba-
sic indicators are not comprehensive enough. Throughout the remainder of this
section, we refer to a compromised user out of our sample of 20 as Bob and one
of Bob’s sessions as s.
20Phishing Email Indicator. For some session s, we retrieve all emails sent
from Bob’s account within ±5 hours from a login event in s. The time window
of ±5 hours serves as a heuristic for relating the email to the login event it is
close in time to, as users may not send email immediately after logging into their
accounts. In addition, there are sometimes delays as to when Office 365 creates
login events in the data buckets for retrieval by Barracuda.
Once all emails are retrieved that are close in time to s, we first determine
if any of the emails were flagged as phishing by Barracuda; if so, then we as-
sign the phishing email indicator for s a value of 1. If none of the emails were
flagged, we then iterate over all emails and manually label them as phishing
or not, using properties of the email header and body. Our method for manu-
ally labeling emails as phishing is similar to approaches taken in previous work
[14,22], in which we first analyze the subject of an email in the context of the
sender’s organization and the number and domains of recipients of the email.
For example, an email of the form ”Bob has shared a file with you” sent to many
recipients across many types of domains is very likely to be phishing. For emails
in which the subject is not suspicious and the number of recipients is small, we
look through the bodies of the emails along with any links present to determine
if the domains of the links are unrelated to the sender’s organization. For many
of the emails that we looked at, these steps were sufficient to determine if emails
were related to phishing or not. We assign the phishing email indicator for s a
value of 1 if there was at least one phishing email we labeled; else, we assign
the phishing email indicator for s a value of 0 if there were no flagged emails by
Barracuda and no manually labeled phishing emails.
Inbox Rules Detection Indicator. We retrieve all suspicious inbox and email
forwarding rules detected by Barracuda that are ±5 hours from a login event
during Bob’s session s. An inbox rule detection indicates that a suspicious rule
was created in a user’s account, such as emails being forwarded to the trash or
to an external account. The inbox rules detection indicator is assigned a value
of 1 for session s if at least one inbox rules detection exists close in time to s.
Interarrival Time Indicator. The interarrival time between 2 login events
e1 and e2 is the absolute value of the difference in timestamps between e1 and
e2 . The general idea for including this interarrival time indicator is for detecting
if the absolute time difference between login events for the same user with two
different locations is shorter than the expected travel time between the two lo-
cations. We first obtain the country subdivision that is most common in Bob’s
historical user profile (i.e. the country subdivision that is associated with the
most number of Bob’s historical login events). For simplicity, we call this coun-
try subdivision Bob’s home territory. Then, for each of Bob’s login events e
during session s, we compute the interarrival time between e and the closest
login event in time to e that contains Bob’s home territory. Among all events
during Bob’s session s, we take the smallest interarrival time and if that value
is smaller than the expected travel time between Bob’s home territory and the
21Table 1. Illustration of an example of a set of login events, with country subdivision
in the first column and timestamp in the second column.
Country Subdivision Timestamp
MO, US 2019-11-29 08:00:05
IL, US 2019-11-29 15:06:45
IL, US 2019-11-29 21:14:32
27, JP 2019-11-29 22:00:07
location mapped to session s, we mark the interarrival time indicator for s with
a value of 1.
An example of a set of login events (anonymized for privacy) is shown in
Table 1. If IL, US is Bob’s home territory and we are evaluating one of Bob’s
sessions tied to 27, JP, the interarrival time for this session would be about 46
minutes given that there was a login event from 27, JP 46 minutes after a login
from IL, US. However, the expected travel time between Illinois and Japan is
about 13 hours. Therefore, the session tied to 27, JP would be suspicious and
would be marked with a value of 1 by the indicator. Note that in applying the
indicator to some session s, we use Bob’s home territory for computing inter-
arrival times for login events during s to reduce the amount of manual analysis
needed to be done in evaluating the rule set (we had to manually look up the
expected travel time between all sessions and the respective home territories for
our random sample of 20 users). To make this indicator more general, for each
event during s, we could calculate the smallest interarrival time between the
event and any country subdivision within Bob’s historical user profile. However,
using the home territory for each user was sufficient for the evaluation.
Tor Exit Node Indicator. If the IP address for s is a Tor exit node, then
we assign the Tor exit node indicator for session s as a 1.
Applying the Basic Indicators and Refinement. For each of the 54 ses-
sions across our random sample of 20 users that we evaluate our rule set on, we
apply the four basic indicators described above. If at least one indicator labels
a session with a value of 1, then we say that it is an attacker-related session;
otherwise, we label it a benign session.
Out of the 54 sessions, there were seven that were labeled as benign by the
basic indicators and attacker by our rule set. To ensure that we obtained the
highest confidence ground truth label for these seven sessions (possible false
positives), we performed manual analysis to obtain a more refined label. Each of
the seven sessions involved a different compromised user. From their respective
historical user profiles, four users primarily use US-based IP addresses and the
remaining three primarily use IP addresses based in countries outside the US.
Through our analysis that we present below for each of the seven sessions, we
22You can also read