A New Inclusive Volcanic Risk Ranking, Part 1: Methodology
←
→
Page content transcription
If your browser does not render page correctly, please read the page content below

ORIGINAL RESEARCH
                                                                                                                                               published: 03 August 2021
                                                                                                                                          doi: 10.3389/feart.2021.697451

                                            A New Inclusive Volcanic Risk
                                            Ranking, Part 1: Methodology
                                            Amiel Nieto-Torres 1*, Leticia Freitas Guimarães 2, Costanza Bonadonna 3 and
                                            Corine Frischknecht 3
                                            1
                                             Departamento de Vulcanología, Instituto de Geofísica, Universidad Nacional Autónoma de México, Ciudad de México, Mexico,
                                            2
                                             Geoscience Institute, University of São Paulo, São Paulo, Brazil, 3Department of Earth Sciences, University of Geneva, Geneva,
                                            Switzerland

                                            The ever-increasing population living near active volcanoes highlights the need for the
                                            implementation of effective risk reduction measures to save lives and reduce the impact of
                                            volcanic unrest and eruptions. To help identify volcanic systems associated with potential
                                            high risk and prioritize risk reduction strategies, we introduce a new Volcanic Risk Ranking
                                            (VRR) methodology that integrates hazard, exposure, and vulnerability as factors that
                                            increase risk, and resilience as a factor that reduces risk. Here we present a description of
                                            the methodology using Mexican volcanoes as a case study, while a regional application to
                                            Latin American volcanoes is presented in a companion paper (Guimarães et al.,
                                            submitted). With respect to existing strategies, the proposed VRR methodology
                                            expands the parameters associated with hazard and exposure and includes the
                                            analysis of 4 dimensions of vulnerability (physical, systemic, social, economic) and of
                         Edited by:
                                            resilience. In particular, we propose 41 parameters to be analyzed, including 9 hazard
                  Mark Bebbington,
     Massey University, New Zealand         parameters, 9 exposure parameters, 10 vulnerability parameters and 13 resilience
                        Reviewed by:        parameters. Since the number of parameters evaluated for each risk factor is different,
                   Melody Whitehead,        they are normalized to have the same weight based on dedicated sensitivity analyses. In
    Massey University, New Zealand
                    Annalisa Cappello,
                                            order to best illustrate the methodology, the proposed VRR is here applied to 13 Mexican
 National Institute of Geophysics and       volcanoes and compared with other approaches. We found that the volcanoes associated
                     Volcanology, Italy
                                            with the highest combination of hazard, exposure and vulnerability (3-factor VRR) for this
                  *Correspondence:
                                            geographic area are Tacaná and El Chichón regardless of the analyzed time window of
                   Amiel Nieto-Torres
        amielnieto@ciencias.unam.mx         eruption occurrence (i.e.,
Nieto-Torres et al.                                                                                              New Inclusive Volcanic Risk Ranking

volcanic observatories around the world still lack enough                   past volcanic activity as an indication of potential future
scientific and economic resources to establish resilient, multi-             impact as well as the exposure analysis associated with each
parametric monitoring networks (e.g., Sparks 2003; Pallister et al.,        volcano. Fifteen hazard parameters were included, such as
2019). Because resources are often limited, monitoring and other            volcano type, occurrence of unrest, the general frequency of
volcanic risk mitigation strategies and efforts need to be                  past eruptions, and the tendency toward explosivity. Unrest
prioritized depending on the potential impacts. Risky                       parameters integrate seismicity within 20 km of a volcano,
volcanoes can be classified based on dedicated risk ranking                  deformation in response to magma intrusion or gross changes
strategies.                                                                 to an existing hydrothermal system and degassing. The
    Global risk rankings and maps have been proposed for various            exposure parameters include population, aviation, power
natural phenomena such as earthquakes and landslides. For                   generation/transmission, major development, or sensitive
instance, the Global Seismic Risk Map (v2018.1) presents the                areas, totalizing 8 parameters. This system, with some
geographic distribution of average annual loss (USD) normalized             adjustments, has been widely applied to several parts of the
by the average construction costs of the respective country                 world, including Chile (Lara et al., 2006), Central America
(USD/m2) due to ground shaking in the residential, commercial,              (Palma et al., 2009), México (Espinasa-Pereña et al., 2015),
and industrial building stock, considering contents, structural and         Perú (Macedo et al., 2016), Argentina (Elissondo et al., 2016)
non-structural components. The normalized metric allows a direct            and Ecuador (Santamaría and Bernard, 2018). The threat
comparison of the risk between countries with widely different              ranking for U.S. volcanoes was recently used by Peers et al.
construction costs (Silva et al., 2018). In the case of landslides, a       (2021) to estimate the economic effects of volcanic alerts on
global risk map by country was constructed by Yang et al. (2015)            the housing prices and business patterns in volcanic regions
presenting the expected annual mortality caused by these                    with very high-threat volcanoes.
phenomena. In this approach, risk represents the interaction of                In Japan, the Japan Meteorological Agency has developed a
hazard intensity with population density and its vulnerability. An          classification system, using two different time windows, a 10-ka
integrative analysis of risk was presented in the World Risk Index          activity level index, and a 0.1-ka activity level index. This system
(WRI) (Welle and Birkmann, 2015). The WRI is a statistical model            classifies volcanoes only based on volcanological criteria. In this
for assessing the global risk of disasters that arise directly from         approach exposure and vulnerability factors were not included
extreme natural hazards such as earthquakes, storms, floods,                 (Uhira, 2003). To rank volcanic hazards and events that may
droughts, or sea-level rise. It is based on the notion that disaster        impact the Auckland Region (New Zealand), Magill and Blong
risk is particularly high where extreme natural events hit vulnerable       (2005a,b) calculated risk by multiplying the relative probability of
societies and provides a disaster risk assessment for 181 countries         the specific volcanic hazard (e.g., lava flow, lahar, ash fall) by the
worldwide. This assessment defines vulnerability as composed of              relative importance of the impact.
susceptibility to harm, lack of coping and adaptive capacities.                A method for volcanic hazard and exposure assessment
Regarding volcanoes, local and international efforts have been              applied to 16 priority countries of the World Bank’s Global
dedicated to the characterization and assessment of volcanic                Facility for Disaster Reduction and Recovery (GFDRR) has
hazard, threat, and risk during the last decades. From the oldest           been developed by Aspinall et al. (2011). This approach uses
to the newest, at regional scale, Bailey et al. (1983) made a general       eight indicators to assess hazard (e.g., volcano type, Holocene
assessment of the potential for future eruptions in the United States       PDCs, lava flow, lahar, crater lake or snow cap presence, number
by grouping volcanoes based on the age of the most recent eruptions         of sub-features, maximum Volcanic Explosivity Index - VEI,
and eruption periodicities. Lowenstein and Talai (1984) ranked              eruption frequency) and the population exposure index to
volcanoes in Papua New Guinea, including hazard parameters                  evaluate the risk to the population. At hazard level, the
based on geological features, historically recorded hazardous               approach attributes an uncertainty score depending on
phenomena, and present unrest. These hazard parameters were                 the knowledge of the volcano, which is then summed with the
summed with population data to calculate a relative potential               hazard score. Auker et al. (2015) proposed an approach (the
hazard rating.                                                              Volcanic Hazard Index; VHI) aiming at improving the volcanic
    Yokoyama et al. (1984) developed the first approach to rank              hazard assessment approaches of Ewert (2007) and Aspinall et al.
volcanoes globally. This scheme assessed ten hazard parameters,             (2011) and assess global volcanic hazard for the next 30 year
focused on the characteristics of volcanism and its historical              period. This approach considers the eruption frequency and
occurrences, such as magma composition, occurrence of major                 extreme characteristics (maximum VEI recorded), giving more
explosive eruption, pyroclastic density currents (PDCs), tsunamis           weight to recent activity patterns, as these are considered as the
within the last hundred years and seismic activities, and seven             most likely to indicate the type of future eruptions. Moreover, the
exposure parameters based on exposed population and historical              eruption frequency is used as a multiplicator instead of just a
evacuations and fatalities; these two components were scored, and           summed indicator. In parallel, to evaluate the total volcanic threat
the results summed to identify high threat volcanoes.                       borne by countries, Brown et al. (2015) developed two measures
    The U.S. Volcano Disaster Assistance Program developed a                of volcanic threat for all volcanoes listed in the Global Volcanism
system of relative threat ranking for non-U.S. volcanoes (Ewert             Program database. First, the volcanic threat to life was obtained
et al., 1998), which was later extended to include U.S.                     for each volcano based on an estimate of exposed population
volcanoes by Ewert et al. (2005) and Ewert (2007) and                       weighted by the number of historical fatalities. Second, the
recently updated (Ewert et al., 2018). This system considers                importance of volcanic threat was assessed for each volcano

Frontiers in Earth Science | www.frontiersin.org                        2                                    August 2021 | Volume 9 | Article 697451
Nieto-Torres et al.                                                                                                   New Inclusive Volcanic Risk Ranking

using an indicator based on the previous indicator multiplied by               proportion of the value be lost as a result of a volcanic event;
the inverse of the human development index, this index being                   and hazard is the probability of a specific area to be affected by a
considered as a proxy for vulnerability.                                       volcanic event over a certain period of time.
    Recently, the volcanoes in Italy and Canary Islands were                      More generally, UNDRO (1991) defined risk as “the expected
ranked by Scandone et al. (2016) through the Volcanic Risk                     number of lives lost, person injured, damage to property and
Coefficient (VRC). The VRC is given by the sum of the VEI of the                disruption of economic activity due to a particular natural
maximum expected eruption from the volcano, the logarithm of                   phenomenon”:
the eruption rate, and the logarithm of the population that may be
                                                                                       Risk  Elements at Risk × Hazard × Vulnerability              (2)
affected by the maximum area reached by PDCs, used as a proxy
to the size of the VEI. This approach is useful for comparing the                 During the last few decades, several efforts have been made to
degree of risk associated with different volcanoes in a region, even           integrate other key aspects into the risk analysis, such as coping
in case of limited availability of data. However, the lack of                  capacities, which refer to the “means to face adverse consequences
systematized and integrated framework still prevents us from a                 related to a disaster”, including “management of resources before,
comprehensive and holistic understanding of the volcanic risk at               during, and after the disaster” (Villagrán De León, 2006) or lack of
regional scale.                                                                preparedness (e.g., lack of early warning systems, emergency
    In this paper a new strategy for Volcanic Risk Ranking (VRR)               plans; Villagrán De León, 2001). Some authors integrated
is presented that is based on the analysis of various risk factors. As         coping capacities at the denominator of the risk equation (e.g.,
all previous rankings, also the new VRR does not provide a risk                ISDR, 2004; White et al., 2005; Diouf and Gaye, 2015):
assessment of volcanic systems, but a relative classification of
volcanic systems based on the analysis of key risk factors. Unlike                                        Hazard × Vulnerability
                                                                                                 Risk                                               (3)
previous ranking approaches applied to volcanic settings, the new                                            Coping capacity
VRR not only considers hazard and exposure factors, but also
                                                                                   Some other authors have proposed an approach to carry out a
physical, systemic, economic, and social vulnerabilities as well as
                                                                               relative comparison among systems with or without existing
resilience, which are the most used categories in risk analysis (e.g.,
                                                                               capacities and measures (e.g., Bollin et al., 2003; Hahn et al., 2003):
Hahn et al., 2003; ISDR, 2004; Villagrán De León, 2006; Beccari,
2016; Ramli et al., 2020). In particular, volcanic systems are                             Risk  Hazard + Exposure + Vulnerability
analyzed based on two expressions, one that combines only
                                                                                                    − Capacities & measures                          (4)
the factor contributing the increase the risk (i.e., hazard,
exposure and vulnerability; 3-factor VRR) and one that also                    where “Capacities & measures” indicate coping capacities and
considers the factor that reduces risk (i.e., resilience; 4-factor             measures of prevention, mitigation, preparation, response and
VRR). The results of the two expressions are compared in order to              rehabilitation and reconstruction. Finally, risk has also been
identify volcanoes with the highest hazard, exposure and                       defined as a function of hazard, vulnerability, exposure, and
vulnerability and the volcanoes where no or only few                           resilience, without identifying a mathematical relationship
resilience measures are in place and that, therefore, require the              between factors (MRM, 2002; Thywissen, 2006); these more
most urgent actions to reduce risk.                                            qualitative analyses allow to better understand the various
    Here, we present the detailed methodology using the Mexican                factors of risk, but they cannot be applied to case studies or
volcanoes as a case study. The effect of time window of analyzed               used in a risk ranking.
volcanoes on the results is also assessed (e. g. 1 ka versus 10 ka;                The new VRR integrates hazard (H), exposure (E), and
data provided in Supplementary Table S1). In a companion                       vulnerability (V) as factors that contribute to increase risk (R),
paper (Guimarães et al., submitted), the same methodology has                  and resilience (Res) as a factor that reduces risk. In the proposed
been applied at regional scale to assess the risk of volcanoes of the          VRR, the resilience factor integrates both coping capacities and
entire Latin America region that have been active in the last                  mitigation measures in line with the most recent definition of
1,000 years.                                                                   resilience of UNDRR (2017), i.e. “the ability of a system,
                                                                               community or society exposed to hazards to resist, absorb,
                                                                               accommodate, adapt to, transform and recover from the effects
METHODOLOGY                                                                    of a hazard in a timely and efficient manner, including through the
                                                                               preservation and restoration of its essential basic structures and
The first definition of volcanic risk was provided by Fournier                   functions through risk management” (https://www.undrr.org/
d’Albed (1979):                                                                terminology). Therefore, resilience considers aspects that not
                Risk  Value × Vulnerability × Hazard               (1)        only help to prevent and face the disasters, such as capacity to
                                                                               react, but also measures that can reduce the impacts, such as
where risk is the possibility of a loss of life, property, or productive       mitigation measures.
capacity; value is the number of people, assets (e.g. land,                        The selection of the equation to be used in the new VRR was
buildings), or economic activities (e.g. factories, power plants,              based on a sensitivity analysis that tested various strategies
agricultural land) exposed (what now is more commonly                          (Supplementary Table 2A). We found that the most suited
expressed as exposure); vulnerability is the expected                          equations for a relative volcanic risk ranking are:

Frontiers in Earth Science | www.frontiersin.org                           3                                      August 2021 | Volume 9 | Article 697451
Nieto-Torres et al.                                                                                                New Inclusive Volcanic Risk Ranking

           VRR(1)  Hazard × Exposure × Vulnerability              (5)        analyzing manifestations as seismic activity within 20 km of the
and                                                                           volcanic edifice, since this is the common distance at which the first
                                                                              earthquakes appear in some observed eruptions (e.g., El Chichón,
                        Hazard × Exposure × Vulnerability                     Popocatépetl, Colima; Zobin, 2012), ground deformation, and
           VRR(2)                                                 (6)
                                   (Res + 1)                                  active fumarole or magmatic degassing (Table 1;
                                                                              Supplementary Table S1).
   In fact, VRR(1) (3-factor VRR) is used to investigate the
factors that most contribute to increase risk, while VRR(2) (4-
                                                                              Exposure Parameters
factor VRR) is used to investigate the contribution of resilience in
                                                                              We define exposure as the identification and quantitative
reducing risk. VRR(1) is in line with the risk definition of
                                                                              assessment of elements at risk (e.g., population, type of assets,
UNDRO (1991) (Eq. 2), while VRR(2) is in line with the risk
                                                                              infrastructure) located in an area exposed to volcanic hazards.
definition of ISDR (2004) (Eq. 3). Nonetheless, in order to treat
                                                                              The evaluation of the exposure of each volcano was carried out
volcanic systems with values of resilience  0 and exposure or vulnerability is zero, the risk
                                                                              critical facilities (Government offices, schools, and recreation
would be equal to the hazard, which is not in line with the concept
                                                                              facilities), economic activities (agriculture, livestock, forestry,
of risk. This can be seen, as an example, with the case of volcano
                                                                              fishing, mining, industry, tourism) were considered. The
Barcena, for which the hazard is > 0 and the exposure is 0
                                                                              analysis of exposed elements for each volcano was carried out
(Supplementary Table 2A); in case of Eq. 4, the risk would be
                                                                              considering the possible extension of the hazards in radii of 5, 10,
equal to the hazard, while in case of Eq. 6 the risk is 0.
                                                                              30 and 100 km from the main crater. These radii were defined
                                                                              based on three aspects adapted from Ewert et al. (2005): 1) it was
Hazard Parameters                                                             observed that in Latin America there are populations living
Hazard is defined as a potentially damaging phenomenon that                    within a radius of 5 km from the volcano crater (e.g., Tacaná
can affect a specific area over a specific recurrence time.                     volcano, in México, San Salvador volcano in El Salvador and
Identification of volcanic hazards that can affect an area is                  Almolonga volcano in Guatemala), 2) the 10 and 30 km distances
typically based on records of past events, as derived from                    were chosen according to analysis in Newhall and Hoblitt (2002)
geological and/or historical and/or instrumental evidence (e.g.               for VEI 4-5 eruptions (e.g., for these magnitudes of eruption a
Alberico et al., 2002; Marzocchi et al., 2006; Connor et al., 2015;           PDC can reach 10 and 30 km distance from the main crater), 3)
Scandone et al., 2016; Marti Molist, 2017). The hazard parameters             according to Newhall and Hoblitt (2002), tephra accumulation
considered in our VRR have been adapted from the methodology                  can exceed 10 cm at 100 km downwind in case of a VEI ≥4
of Ewert et al. (2005). They concern the type of volcano, the                 eruption. A few centimeters of tephra can already have an impact
maximum intensity, the eruptive recurrence interval and the type              on transportation, electric power, and water supply, whilst 10 cm
of volcanic phenomena. We scored the parameters related to                    of tephra, particularly if wet, could trigger structural damage to
volcano type (0 in case of cinder cone, basaltic field, small shield,          buildings (Ewert et al., 2005). In the case of monogenetic volcanic
or fissure vents and 1 in case of stratocone, lava dome, complex               fields (MVF), the analysis was carried out considering all the
volcano, maar or caldera) to the possible type of activity such as            exposed elements within the MVF as well as considering buffer
known VEI (VEI ≥7:4, VEI 5 or 6:3, VEI 3 or 4:2, VEI 2:1 and,              distance of 5, 10 and 30 km from the rim of the field, due the
VEI ≤ 1:0) and to the eruptive recurrence interval between                    variation in the spatio-temporal behavior of volcanic fields
confirmed eruption, as it is reported in Global Volcanism                      (Runge et al., 2014; Runge et al., 2015).
Program (GVP). In particular, given that minor eruptions are                      Population was scored based on four density intervals. Density
under-recorded, the eruptive recurrence interval was analyzed                 was calculated using the ratio between the number of inhabitants
only for eruptions with VEI ≥3 (eruption interval < 50 years  4;             and the area, considering each of the radius defined. Population
eruption interval 50–100 years  3; eruption interval                         density >0 inhab/km2, between 1 and 10 inhab/km2, between 10
100–1000 years  2; eruption interval 1000–10,000 years or no                 and 100 inhab/km2, and above 100 inhab/km2 score, 1, 2, 3 and 4,
Holocene eruption but caldera forming eruption occurred                       respectively. This density-based score system was chosen
>10,000 years  1; no known Holocene eruptions  0). The                      considering that the population density concept 1) simplifies
occurrence of the different volcanic hazards (PDCs, lava flows,                the communication with stakeholders, 2) provides the
lahars, tsunamis, phreatic activity) was scored 0 (non-occurrence)            opportunity to identify social conditions of a population and
to 1 (occurrence in the Holocene). The hazard associated with                 the pressure on the territory and on resources, and 3) allows us to
tephra fallout is intrinsically assessed in the VEI analysis, since the       fit maximum values that facilitate the normalization of the
VEI scale is defined based on the volume of tephra deposits                    final score.
(Newhall and Self, 1982). The existence of water/ice on the                       The presence of any number of residential buildings,
volcano that could potentially trigger a lahar was also                       transportation, power, water, and telecommunication
considered. The current state of activity was integrated by                   infrastructures, as well as critical facilities and economic

Frontiers in Earth Science | www.frontiersin.org                          4                                    August 2021 | Volume 9 | Article 697451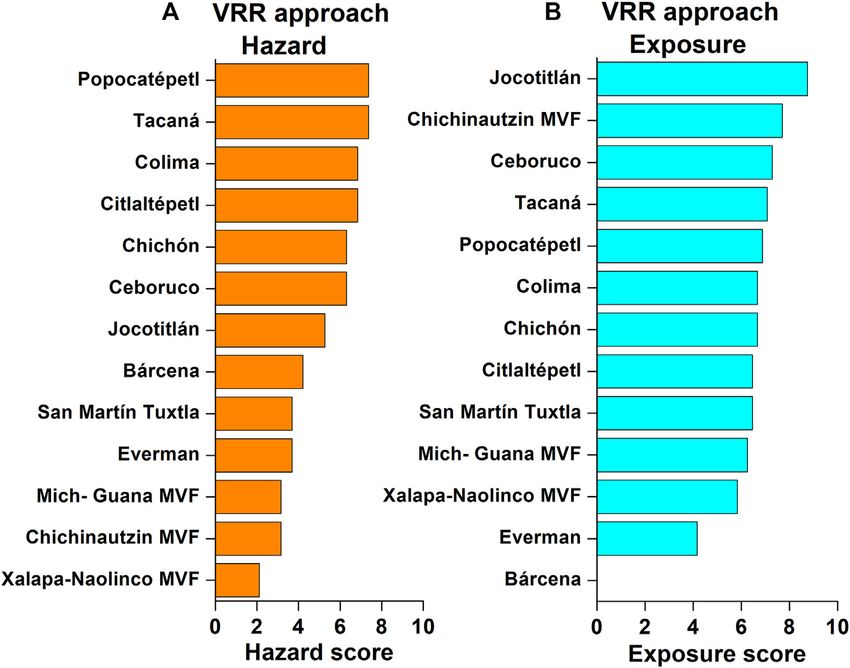
Nieto-Torres et al.                                                                                                                       New Inclusive Volcanic Risk Ranking

TABLE 1 | Hazard parameters evaluated in the new ranking strategy (adapted from Ewert et al. (2005)).

                                                                              Hazard parameters                                                 Score     Maximum score
                                                                                                                                                              value

Volcano Type                           Cinder cone, basaltic field, small shield, fissure vents                                                     0               1
                                       Stratocone, lava dome, complex volcano, maar, caldera                                                      1
Maximum VEI                            VEI ≥ 7                                                                                                    4               4
                                       VEI  5 or 6                                                                                               3
                                       VEI  3 or 4                                                                                               2
                                       VEI  2                                                                                                    1
                                       VEI ≤ 1                                                                                                    0
                                       No VEI listed; volcano type  1                                                                            1
                                       No VEI listed; volcano type  0                                                                            0
                                       No known Holocene, not silicic caldera system                                                              0
Eruptive recurrence interval VEI≥3     Eruption interval 10,000 years
                                       No known Holocene eruptions                                                                                0
Types of volcanic hazards              Holocene PDCs. If yes                                                                                      1               1
                                       Holocene lava flows. If they have traveled beyond the immediate eruption site or flanks and reached          1               1
                                       populated areas
                                       Holocene lahars. If they have traveled beyond the flanks and reached populated areas                        1               1
                                       Holocene tsunamis. If yes                                                                                  1               1
                                       If the volcano has had Holocene phreatic explosive activity and/or has thermal features that are           1               1
                                       extensive enough to represent a potential for explosive activity
Sector collapse potential              If the volcano has produced a sector collapse and has re-built its edifice, or has high relief, steep       1               1
                                       flanks and demonstrated or inferred alteration.
Primary lahar source                   If the volcano has a source of permanent water/ice on edifice, water volume > 106 m³                        1               1
Observed seismic unrest                Since last eruption, in the absence of eruptive activity, within 20 km of the volcanic edifice. If yes      1               1
Observed ground deformation            Since last eruption, in the absence of eruptive activity, inflation or other evidence of magma              1               1
                                       injection. If yes
Observed fumarolic or magmatic         Since last eruption, in the absence of eruptive activity, either heat source or magmatic gases. if yes     1               1
degassing
Total hazard score                                                                                                                               H              19

activities (agriculture, livestock, forestry, fishing, mining,                             material, then the typology of the houses is used as a proxy for the
industry, tourism) was scored with values of 1, 2, 3 and 4                                type of material; this criterion is based on the predominant (more
considering the first appearance in 100, 30, 10 and 5 km from                              than 50%) typology of residential buildings within the different
a central volcano, respectively or in case of MVF from a buffer (as                       radii. Most fragile buildings such as huts, ranches, cabins, mobile
Runge et al. (2014) and Runge et al. (2015) suggest) of 30, 10, and                       homes, indigenous or ethnic homes, or improvised dwellings
5 km or first appearance within field (Table 2).                                            have the highest score (3), followed by progressively less fragile
                                                                                          structures, which score 2 such as cottage and little houses, and
Vulnerability Parameters                                                                  multiple dwelling, villa, apartment, collective dwellings that score
Four vulnerability dimensions were considered: physical,                                  1. These analyses depend on available data, but it is recommended
systemic, social, and economic, based on the most common                                  to use the latest available version of local census, whenever
indicators used in literature (Hahn et al., 2003; ISDR, 2004;                             possible.
Villagrán De León, 2006; Beccari, 2016; Ramli et al., 2020;                                   The evaluation of the systemic vulnerability relied on
Table 3). Physical vulnerability of buildings is defined as the                            evaluating how a lifeline system is prone to failure not only
expected degree of loss resulting from the impact of a certain                            because of physical damage to one of its components, but also as
hazard (e.g., Guillard-Gonçalves and Zêzere, 2018). Its                                   the indirect effect of some physical, functional, or organizational
assessment requires the evaluation of various parameters such                             failure suffered by other interconnected systems as well as on the
as building category (e.g., huts, cabins, indigenous homes, or                            lack of possibility to be replaced either by transfer of its function
improvised dwellings), construction material, resistance and                              or due to redundancy. Furthermore, the method considers the
implemented protective measures. In this study, due to lack of                            vulnerability of urban and regional systems expressed as the loss
other information, physical vulnerability analysis considers the                          of accessibility to gas, water, power, and communication utilities
main type of construction material (wood, masonry, and                                    among others (Menoni et al., 2002). The systemic vulnerability
reinforced concrete) as a proxy. In particular, we assigned a                             was carried out considering two main aspects: 1) the lack of
score 3 in the case of wood, 2 in the case of masonry and 1 in the                        redundancy (based on the number of each type of infrastructure,
case of reinforced concrete. If it is not possible to know the type of                    e.g., transportation, power, water, telecommunication present in a

Frontiers in Earth Science | www.frontiersin.org                                      5                                              August 2021 | Volume 9 | Article 697451
Nieto-Torres et al. New Inclusive Volcanic Risk Ranking
TABLE 2 | Exposure parameters evaluated in the new ranking strategy (adapted from Ewert et al. (2005)).
Exposure parameters Score Maximum score
value
Population density [inhab/km2] Population within 5 km radius from the main crater or if 4
volcanic field within the field. If density >01; >12;
>103; >1004
Population within 10 km radius from the main crater, or in 4
a buffer of 5 km from the field border if volcanic field. If
density >01; >12; >103; >1004
Population within 30 km radius from the main crater, or in 4
a buffer of 10 km from the field border if volcanic field. If
density >01; >12; >103; >1004
Population within 100 km radius from the main crater, or 4
in a buffer of 30 km from the field border if volcanic field. If
density >01; >12; >103; >1004
Residential buildings If first appearance in 5 km radius from the main 4 4
crater
If first appearance in 10 km radius from the 3
main crater
If first appearance in 30 km radius from the 2
main crater
If first appearance in 100 km radius from the 1
main crater
If volcanic field, residential buildings within the field4 or
first appearance in a buffer from the field border of
5 km3, 10 km2, 30 km1
Transportation: Airports, air route, train stations, rails, highways, national ways, harbors If first appearance in 5 km radius from the main 4 4
crater
If first appearance in 10 km radius from the 3
main crater
If first appearance in 30 km radius from the 2
main crater
If first appearance in 100 km radius from the 1
main crater
If volcanic field, transportation infrastructure within the
field4 or first appearance in a buffer from the field border
of 5 km3, 10 km2, 30 km1
Power infrastructure: Power plants, transmission lines electricity, gas, oil If first appearance in 5 km radius from the main 4 4
crater
If first appearance in 10 km radius from the 3
main crater
If first appearance in 30 km radius from the 2
main crater
If first appearance in 100 km radius from the 1
main crater
If volcanic field, power infrastructure within the field4 or
first appearance in a buffer from the field border of
5 km3, 10 km2, 30 km1
Water infrastructure: Dams, tanks, waterways If first appearance in 5 km radius from the main 4 4
crater
If first appearance in 10 km radius from the 3
main crater
If first appearance in 30 km radius from the 2
main crater
If first appearance in 100 km radius from the 1
main crater
If volcanic field, water infrastructure within the field4 or
first appearance in a buffer from the field border of
5 km3, 10 km2, 30 km1
Telecommunication infrastructure: Radio, tv, telephone, internet antennas, lines If first appearance in 5 km radius from the main 4 4
crater
If first appearance in 10 km radius from the 3
main crater
If first appearance in 30 km radius from the 2
main crater
(Continued on following page)
Frontiers in Earth Science | www.frontiersin.org 6 August 2021 | Volume 9 | Article 697451Nieto-Torres et al. New Inclusive Volcanic Risk Ranking
TABLE 2 | (Continued) Exposure parameters evaluated in the new ranking strategy (adapted from Ewert et al. (2005)).
Exposure parameters Score Maximum score
value
If first appearance in 100 km radius from the 1
main crater
If volcanic field, telecommunication infrastructure within
the field4 or first appearance in a buffer from the field
border of 5 km3, 10 km2, 30 km1
Emergency facilities: Civil protection installations, police stations, fire stations, hospitals, If first appearance in 5 km radius from the main 4 4
army crater
If first appearance in 10 km radius from the 3
main crater
If first appearance in 30 km radius from the 2
main crater
If first appearance in 100 km radius from the 1
main crater
If volcanic field, emergency facilities within the field4 or
first appearance in a buffer from the field border of
5 km3, 10 km2, 30 km1
Critical facilities: Government offices, schools, recreation facilities. If first appearance in 5 km radius from the main 4 4
crater
If first appearance in 10 km radius from the 3
main crater
If first appearance in 30 km radius from the 2
main crater
If first appearance in 100 km radius from the 1
main crater
If volcanic field, critical facilities within the field4 or first
appearance in a buffer from the field border of 5 km3,
10 km2, 30 km1
Presence of at least one economic activity (agriculture, livestock, forestry, fishing, mining, If first appearance in 5 km radius from the main 4 4
industry, tourism). crater
If first appearance in 10 km radius from the 3
main crater
If first appearance in 30 km radius from the 2
main crater
If first appearance in 100 km radius from the 1
main crater
If volcanic field, presence of at least one economic activity
within the field4 or first appearance in a buffer from the
field border of 5 km3, 10 km2, 30 km1
Total exposure score E 48
specific area) and 2) the level of accessibility (based on the 2002). It is linked to the level of wellbeing of individuals,
number and type of transportation means available to reach communities, and society. It includes aspects related to levels
an infrastructure). For the lack of redundancy, if none or of literacy and education, the existence of peace and security,
only one specific infrastructure (e.g. hospital) is located within access to basic human rights, systems of good governance, social
100 km radius from the main crater or within the volcanic equity, positive traditional values, customs and ideological beliefs
field up to a 30 km radius from the rim, the score is 1, and overall collective organizational systems (Wisner et al., 2004).
otherwise it is 0 (Table 3). The same score system was also Here we consider the characteristics of population based on
used to assess the lack of accessibility for the same radii. functional and access needs (namely proportion of children
Finally, considering that the management of a volcanic crisis 60 years, and invalids) as well as ethnicity,
depends on the government response, and that the presence unemployment, and illiteracy (Fothergill et al., 1999; Flanagan
of volcanoes on geographic borders require an effective et al., 2011; Zhou et al., 2014; Beccari, 2016; Teo et al., 2019;
communication between the affected countries, the existence Federici, 2020). Such indicators are counted as the arithmetic
of a volcano within 10 and 100 km from a border was scored average of data (obtained from the latest version of local census
2 and 1, respectively. surveys) for each administrative unit (province, region, or
Social vulnerability refers to the inability of people, department) inside the 100 km radius; in particular, the score
organizations, and societies to withstand adverse impacts of value is varied from 0 to 10, with the number increasing of one
hazards due to characteristics inherent to social interactions, unit each 10% and 10 corresponding to 100% of the population
institutions, and systems of cultural values (Menoni et al., in the considered condition. The greater the proportion of
Frontiers in Earth Science | www.frontiersin.org 7 August 2021 | Volume 9 | Article 697451Nieto-Torres et al. New Inclusive Volcanic Risk Ranking
TABLE 3 | Vulnerability parameters evaluated in the new ranking strategy.
Vulnerability parameters Score Maximum
score value
Physical Main type of construction within 5 km radius from the main crater or if more than 50% of wood or hut, ranch, 3 3
vulnerability within the field in case of volcanic field cabin, mobile home, indigenous home,
buildings not built for human habitation
and improvised dwelling
if more than 50% of masonry or cottage 2
and little houses.
if more than 50% of reinforced concrete or 1
villa, apartment, collective dwelling
within 10 km radius from the main crater or if more than 50% of wood or hut, ranch, 3 3
within a buffer of 5 km from the border of cabin, mobile home, indigenous home,
the field in case of volcanic field buildings not built for human habitation
and improvised dwelling
if more than 50% of masonry or cottage 2
and little houses.
if more than 50% of reinforced concrete or 1
villa, apartment, collective dwelling
within 30 km radius from the main crater or if more than 50% of wood or hut, ranch, 3 3
within a buffer of 10 km from the border of cabin, mobile home, indigenous home,
the field in case of volcanic field buildings not built for human habitation
and improvised dwelling
if more than 50% of masonry or cottage 2
and little houses.
if more than 50% of reinforced concrete or 1
villa, apartment, collective dwelling
within 100 km radius from the main crater if more than 50% of wood or hut, ranch, 3 3
or within a buffer of 30 km from the border cabin, mobile home, indigenous home,
of the field in case of volcanic field buildings not built for human habitation
and improvised dwelling
if more than 50% of masonry or cottage 2
and little houses.
if more than 50% of reinforced concrete or 1
villa, apartment, collective dwelling
Systemic Redundancy Critical facilities: Government offices, If number of critical facilities > 1 within 0 1
vulnerability (Vital schools, recreation facilities 100 km radius from the main crater
lines) If number of critical facilities ≤ 1 within 1
100 km radius from the main crater
For volcanic field, if number of power infrastructure is
≤ 1 within the field up to a buffer of 30 km from the
boundary, then score 1, otherwise 0
Emergency facilities: Civil protection, If number of emergency facilities > 1 within 0 1
police, fire stations, hospitals, army 100 km radius from the main crater
If number of emergency facilities ≤ 1 within 1
100 km radius from the main crater
For volcanic field, if number of power infrastructure is
≤ 1 within the field up to a buffer of 30 km from the
boundary, then score 1, otherwise 0
Transportation: Airports, air route, train If number of transportation > 1 within 0 1
stations, rails, highways, national ways, 100 km radius from the main crater
harbors If number of tranpsortation ≤ 1 within 1
100 km radius from the main crater
For volcanic field, if number of transportation is ≤ 1
within the field or in a buffer from the boundary of
30 km, then score 1, otherwise 0
Power (electricity) infrastructure If number of power infrastructure > 1 within 0 1
100 km radius from the main crater
If number of power infrastructure ≤ 1within 1
100 km radius from the main crater
For volcanic field, if number of power infrastructure is
≤ 1 within the field up to a buffer of 30 km from the
boundary, then score 1, otherwise 0
Water infrastructure If number of water infrastructures > 1 0 1
within 100 km radius from the main crater
1
(Continued on following page)
Frontiers in Earth Science | www.frontiersin.org 8 August 2021 | Volume 9 | Article 697451Nieto-Torres et al. New Inclusive Volcanic Risk Ranking
TABLE 3 | (Continued) Vulnerability parameters evaluated in the new ranking strategy.
Vulnerability parameters Score Maximum
score value
If number of water infrastructures ≤ 1
within 100 km radius from the main crater
For volcanic field, if number of power infrastructure is
≤ 1 within the field up to a buffer of 30 km from the
boundary, then score 1, otherwise 0
Telecommunication infrastructure If number of telecommunication 0 1
infrastructures > 1 within 100 km radius
from the main crater
If number of telecommunication 1
infrastructures ≤ 1 within 100 km radius
from the main crater
For volcanic field, if number of power infrastructure is
≤ 1 within the field up to a buffer of 30 km from the
boundary, then score 1, otherwise 0
Accessibility access by transport means to critical If number of means of transportation >1 0 1
facilities: Government offices, schools, within 100 km radius from the main crater
recreation facilities. If number of means of transportation ≤1 1
within 100 km radius from the main crater
For volcanic field, if number of power infrastructure is
≤ 1 within the field up to a buffer of 30 km from the
boundary, then score 1, otherwise 0
access to emergency facilities by transport If number of means of transportation >1 0 1
means: Civil protection, police, fire stations, within 100 km radius from the main crater
hospitals, army. If number of means of transportation >1 1
within 100 km radius from the main crater
For volcanic field, if number of power infrastructure is
≤ 1 within the field up to a buffer of 30 km from the
boundary, then score 1, otherwise 0
access to power (electricity) infrastructure If number of means of transportation >1 0 1
by transport means within 100 km radius from the main crater
If number of means of transportation >1 1
within 100 km radius from the main crater
For volcanic field, if number of power infrastructure is
≤ 1 within the field up to a buffer of 30 km from the
boundary, then score 1, otherwise 0
access to water infrastructure by transport If number of means of transportation >1 0 1
means within 100 km radius from the main crater
If number of means of transportation >1 1
within 100 km radius from the main crater
For volcanic field, if number of power infrastructure is
≤ 1 within the field up to a buffer of 30 km from the
boundary, then score 1, otherwise 0
access to telecommunication infrastructure If number of means of transportation >1 0 1
by transport means within 100 km radius from the main crater
If number of means of transportation >1 1
within 100 km radius from the main crater
For volcanic field, if number of power infrastructure is
≤ 1 within the field up to a buffer of 30 km from the
boundary, then score 1, otherwise 0
Volcanoes on border If volcano within 10 km of border line 2 2
If volcano within 100 km of border line 1
Social Age % of population 60 years 10 1 10
Ethnicity % of native-language speaking population 20 2 10
Unemployment % of unemployed population 30 3 10
Disabled population % of disabled population 40 4 10
Education level % of illiterate population 50 5 10
60 6
70 7
80 8
90 9
100 10
(Continued on following page)
Frontiers in Earth Science | www.frontiersin.org 9 August 2021 | Volume 9 | Article 697451Nieto-Torres et al. New Inclusive Volcanic Risk Ranking
TABLE 3 | (Continued) Vulnerability parameters evaluated in the new ranking strategy.
Vulnerability parameters Score Maximum
score value
Economic Diversified economic activities If no more than one type of activity in 5 km radius from the main crater or within a volcanic 4 4
vulnerability (agriculture, livestock, forestry, field
fishing, mining, industry, tourism). If no more than one type of activity in 10 km radius from the main crater or within a buffer of 3 3
5 km from the border of the field in case of volcanic field
If no more than one type of activity in 30 km radius from the main crater or within a buffer of 2 2
10 km from the border of the field in case of volcanic field
If no more than one type of activity in 100 km radius from the main crater or within a buffer 1 1
of 30 km from the border of the field in case of volcanic field
Total vulnerability score V 95
TABLE 4 | Resilience parameters evaluated in the new ranking strategy. Monitoring parameters are adapted from Ewert et al. (2005).
Resilience parameters Score Maximum score
value
Mitigation Risk map if yes2, if no0 2 2
Volcanic hazard map If yes and multihazard (with different hazards described either in one map or in multiple 2 2
maps)2, if no0
If yes and simple hazard 1, if no 0 1
Engineering mitigation if yes1, if no0 1 1
measures
Hazard-based land use planing if yes1, if no0 1 1
Monitoring Well monitored Monitoring provides the ability to track detailed changes in real-time and to 4 4
develop, test, and apply models of ongoing and expected activity.
Basic real time Monitoring provides the ability to detect and track pre-eruptive and eruptive 3
changes in real-time,
with a basic understanding of what is occurring.
Limited Monitoring provides the ability to detect and track activity frequently 2
monitoring enough in near-real time to recognize that something anomalous is
occurring.
Minimal Monitoring provides the ability to detect that an eruption is occurring or that 1
gross changes are occurring/have occurred near a volcano. Data are not
collected systematically or at very long
intervals (e.g., years).
No monitoring No real-time data from ground-based sensors are available. Eruption 0
confirmation (up to hours after the fact) is provided only by remote-sensing
data or from people observing the event.
Early warning system If yes1, if no0 1 1
Exercises or simulations for If yes1, if no0 1 1
institutions
Exercises or simulations for If yes1, if no0 1 1
population
Educational activities for If yes1, if no0 1 1
population
Insurance coverage If yes1, if no0 1 1
Response Evacuation plan If yes1, if no0 1 1
Shelters available If yes1, if no0 1 1
In case of past eruption If yes1, if no0 1 1
successful evacuation
Total resilience score Res 18
population in the considered vulnerable conditions, the greater countries (e.g., Pesaro, 2018). In that respect, economic
the associated vulnerability. vulnerability of a country/region will depend on the different
From an economic perspective, extreme natural events can values of local resources as well as on the capability of
induce damage that causes a loss of resources and impacts to a continuing to produce goods and services and of restoring the
territorial system over long periods, affecting its development; lost resources and at which speed (Pesaro, 2018). In case economic
such an impact can be even more significant for developing activities are too close to the source of damage and are not
Frontiers in Earth Science | www.frontiersin.org 10 August 2021 | Volume 9 | Article 697451Nieto-Torres et al. New Inclusive Volcanic Risk Ranking
diversified, the economic vulnerability is considered high, affecting potential impact. A total of 41 parameters were analyzed: 9
the capability of people and the affected region to face the hazard parameters, 9 exposure parameters, 10 vulnerability
consequences (Hahn et al., 2003). If the economy is not parameters and 13 resilience parameters, where the maximum
diversified, meaning only one type of economic activity (e.g. theoretical value is 19, 48, 95 and 18 for hazard, exposure,
agriculture or livestock or forestry) is present within a 5 km vulnerability, and resilience, respectively (Tables 1–4). The score
radius or within a volcanic field, 4 points are scored, within a value for each parameter was chosen after performing a sensitivity
10 km radius or in a buffer of 5 km in case of volcanic field, 3 points analysis with different score values (Supplementary Table 2B). Since
are scored, within a 30 km radius or in a buffer of 10 km if volcanic the number of parameters evaluated for each risk factor is different,
field, 2 points are scored and within a 100 km radius or in a buffer each factor was equally normalized to ten, for them to have the same
of 30 km in case of volcanic field, 1 point is scored (Table 3). weight regardless of the different scores, following standard strategies
(e.g., Beccari, 2016; Ramli et al., 2020). For hazard, exposure and
Resilience Parameters vulnerability, the normalization was done using the Eq. 7:
Resilience is defined as adaptation to changes and capacity to n1 score of all factor parameters at a given volcano
absorb or overcome a disturbance reaching a new level of Normalized factor n × 10
1 maximum score of all factor parameters at a given volcano
dynamic equilibrium and/or to transform impact into (7)
opportunity (UNDRO, 1991; UNISDR, 2004; UNDRR 2017: where n is the number of parameters for each factor. For
https://www.undrr.org/terminology/resilience). It is also resilience, the normalization was achieved using the Eq. 8:
defined as the capacity of a system to experience disturbance
n score of all factor parameters at a given volcano + 1
and still maintain its ongoing functions and controls (Gunderson Normalized factor n 1 × 10
1 maximum score of all factor parameters at a given volcano
and Holling, 2002). Resilience is, therefore, considered as a (8)
positive factor that reduces the risk. Consequently, we include It is important to notice that in Eq. 8, the mathematical factor
mitigation measures, such as the existence of hazard and risk 1 is added to resilience before normalization in order to make the
maps, hazard-based land-use planning, monitoring, early equation insensitive to the normalization (see Supplementary
warning systems, engineering mitigation measures, insurance Table 2A).
coverage, educational activities for the population, exercises,
and simulations both for operational institutions and for the
population (Zio, 2018; Aven, 2019). Besides, we also include response
capacity by considering the existence of evacuation plans, availability RESULTS
of shelters and, if successful, evacuations that took place in past
eruptions (Table 4). Parameters such as early warning systems or Application of VRR(1) and VRR(2) to
drills are score 0 (absence) or 1 (existence). Regarding hazard maps, Volcanoes of México
the availability of single-hazard maps scores 1, whereas the VRR(1) and VRR(2) were applied to Mexican volcanoes as a case
availability of multiple-hazard maps (with different hazards study. We considered 13 volcanoes with confirmed eruptions in
described either in one single map or in multiple maps) scores 2; the last 1,000 years, since these eruptions are the best constrained
in fact, volcanic eruptions are typically multi hazard events (e.g., in the eruptive records (Brown et al., 2014; Mead et al., 2014). Our
Sandri et al., 2014; Deligne et al., 2017; Takarada, 2017; Zuccaro et al., results were compared with those of Espinasa-Pereña et al. (2015)
2018; Dunant et al., 2021). The existence of risk map is given more who applied the risk-ranking approach of Ewert et al. (2005).
weight and is scored 2. The score values for monitoring systems are Finally, the influence on the results of two different time windows
attributed following the four categories defined by Ewert et al. (2005). for eruption occurrence was also investigated considering both
Therefore, scores vary from 4 in case of a well monitored volcano, to 1,000 and 10,000 years (Table 5).
3 if monitoring is basic but can work in real time, to 2 if there is a For this analysis, data for hazard were derived from those
limited monitoring, but still providing some key information almost volcanoes listed on the GVP (http://www.volcano.si.edu/) in
in real time, to 1 if minimal monitoring is implemented, to 0 if no addition to the analyses developed by Martínez Bringas et al.
monitoring exists, assuming forecasting methods more accurate for (2006), Capra et al. (2007), De la Cruz Reyna (2008), Varley
the best-monitored volcanoes (Table 4). (2012) and Espinasa-Pereña et al. (2015).
The exposure and vulnerabilities analyses for Mexican volcanoes
Risk Analysis were conducted considering the information available in the National
All the risk factors evaluated are composed of several parameters that Atlas of Risks, an online system developed by the Civil Protection
are summed before being normalized. This normalization is based authorities that allows for the consultation of data related to exposure
on the maximum possible value for each of the evaluated factors. In to different hazards (http://www.atlasnacionalderiesgos.gob.mx/
the case of hazard, the maximum value represents the highest archivo/visor-capas.html) and the 2015 census of the Instituto
intensity of each type of hazard; in the case of the exposure, it is Nacional de Geografía y Estadística (INEGI). These data were
the largest quantity of elements prone to be affected; in the case of complemented by downloadable shapefile information from other
vulnerability, it represents the highest level of susceptibility to institutions such as Consejo Nacional de Población (CONAPO) and
damage or loss. In contrast, in the case of resilience, the from the Humanitarian Data Exchange database (HDX), the United
maximum score represents the maximum level of capacity to face Nations Office for the Coordination of Humanitarian Affairs
or overcome a disaster, therefore reducing the level of risk or (OCHA), the Humanitarian Open Street Map Team (HOT) and
Frontiers in Earth Science | www.frontiersin.org 11 August 2021 | Volume 9 | Article 697451Nieto-Torres et al. New Inclusive Volcanic Risk Ranking
TABLE 5 | List of the 39 Mexican volcanoes ranked in this study. 13 volcanoes with an eruption < 1 ka and 26 having erupted < 10 ka
Volcano GVP Volcano Last Eruption Erupting period Latitude Longitude Elevation (masl)
Number Year
Popocatépetl 341090 2021Nieto-Torres et al. New Inclusive Volcanic Risk Ranking
FIGURE 1 | Active volcanoes of México. Tectonic settings from Padilla et al. (2013) are also shown.
1994, in 1997 and in December 2000 (VEI 3, Novelo-Casanova analyzed that have had activity in the last 1 ka, only 10 are
and Valdés González, 2008). associated with some resilience parameters. Popocatépetl and
Additional volcanic systems could severely impact México, Colima are the volcanoes with the highest resilience score,
such as calderas and monogenetic volcanic fields (MVF). For followed by, Tacaná, El Chichón and Chichinautzin MVF
instance, the birth of a monogenetic volcano in the (Figure 3B).
Chichinautzin volcanic field represents a major volcanic
threat to México City, one of the most important cultural 3-Factor VRR and 4-Factor VRR
and financial centers in Latin America and could impact the The 4 risk factors contributing to the risk analysis are not
economic and social activity of the whole country (Nieto-Torres uniformly distributed amongst the Mexican volcanoes. In
and Martin Del Pozzo, 2019). particular, the controlling factors for the development of
strategies to increase resilience are mostly related to the
Hazard, Exposure, Vulnerability, and Resilience occurrence of volcanic activity within the last 1,000 years
When we applied the VRR(1) and VRR(2) to Mexican volcanoes and the proximity to main cities (Figure 4). The resulting
having eruptedNieto-Torres et al. New Inclusive Volcanic Risk Ranking FIGURE 2 | (A) Hazard and (B) exposure analysis based on the new ranking strategy for Mexican volcanoes having erupted
Nieto-Torres et al.                                                                                                                       New Inclusive Volcanic Risk Ranking

  FIGURE 4 | Contribution of the individual risk factors (hazard, exposure, vulnerability, resilience) for the Mexican volcanoes with eruption
Nieto-Torres et al.                                                                                                                      New Inclusive Volcanic Risk Ranking

  FIGURE 5 | (A) VRR(1) (red histograms) and VRR(2) (black circles) of Mexican volcanoes having erupted
Nieto-Torres et al.                                                                                              New Inclusive Volcanic Risk Ranking

26 years, whilst Colima volcano has presented intermittent                  our hazard results; Figure 2A). However, Popocatépetl falls to the
activity since its last Plinian eruption in 1913. Popocatépetl,             fifth and tenth position in our 3-factor VRR and 4-factor VRR,
due to its proximity to México City, has become the volcano                 respectively. In contrast, when vulnerability and resilience are
with the highest level of monitoring in México and one of the best          considered, Tacaná volcano, located at the 8th place with the
monitored in Latin América. In addition to that, there are many             Ewert et al. (2005) approach, rises to the top of both VRR(1) and
other diverse activities aimed at raising awareness of the                  VRR(2) (Figures 5A,B). This is because Tacaná has the same
population around the Popocatépetl such as educational                      hazard score than Popocatépetl, but vulnerability in Tacaná is
activities on volcanic hazards, drills, early-warning systems,              higher since it is in the poorest state of México and because the
design of operational plans and evacuation routes, as well as               resilience associated with this volcano is low. The same situation
well-defined temporary shelters. These actions are sufficient for             is shown for El Chichón; this volcano ranks sixth in the hazard
the risk score of Popocatépetl to decrease slightly and, therefore,         ranking and seventh in the exposure ranking, but second in the
to move from position 5 to 6 in the risk ranking (Figure 5A). In            vulnerability ranking and low resilience which makes it occupy
contrast, the catastrophic eruption VEI 5 of El Chichón in 1982             the second position in VRR(1) and sixth position in VRR(2)
and the phreatic activity of Tacaná, in 1986, have not been                 (Figure 5A). Interestingly, Everman and Bárcena volcanoes fall in
sufficient to implement an adequate level of monitoring in                   the last two positions of the ranking both for VRR(1) and VRR(2)
these two volcanoes and the activities of dissemination of                  and in the ranking of Espinasa-Pereña et al. (2015); in fact, even
hazard information and risk reduction have been minimal, so                 though they are associated with no or few resilience measures, the
the level of resilience of these volcanoes is relatively low.               exposure is very low or zero. Accounting for resilience in the VRR
                                                                            allows to identify which volcanoes in the region have already a
3-Factor VRR and 4-Factor VRR                                               significant level of copying capacity and/or a series of mitigation
The 3-factor VRR of Mexican volcanoes shows that Tacaná and El              measures in place and which, instead, require special attention for
Chichón are the volcanoes with the highest score in México                  the associated risk to be decreased. Such an approach might
regardless of the time window considered for eruption                       motivate local and national stakeholders (e.g., governments) to
occurrence (
Nieto-Torres et al. New Inclusive Volcanic Risk Ranking
hazard assessment should be carried out to delineate those areas Finally, the multiple dimensions of vulnerability and resilience
within the field where an eruption is most likely to occur in the future had never been considered in previous rankings. Even though the
and identify probable eruptive styles as it has been done for the number of parameters considered both for vulnerability and
Chichinautzin Volcanic Field (Nieto-Torres and Martin Del Pozzo, resilience is still limited, the new proposed strategy for both
2019). In the case of San Martin volcano, as the monitoring in place is VRR(1) and VRR(2) represents an important step forward
minimal, a first step would be to strengthen its capability, by towards a comprehensive characterization of volcanic risk. In
densifying the existing seismic network and implementing particular, resilience is still widely debated in literature (e.g.,
additional monitoring techniques. Moreover, it would also be Jones, 2019; Ungar et al., 2021). Further analysis that could
important to compile both hazard and risk maps. reconcile the various existing descriptions of resilience would
Some volcanoes such as Tacaná, and Ceboruco, for which largely improve the presented VRR(2).
some mitigation measures exist, are still at the top of the 4-factor
VRR for volcanoes with eruptionNieto-Torres et al. New Inclusive Volcanic Risk Ranking
TABLE 6 | Comparison of the number of parameters and approach used in the new ranking strategy with previous volcanic ranking systems.
Approach Yokoyama et al. Aspinall et al. Aucker et al. Brown et al. Ewert et al. This work
(1984) (2011) (2015) (2015) (2005)
Threat Risk Risk Threat (country level) Threat VRR
Threat=Σ(H+E) Risk=H*PEI Risk=VHI*PEI Threat=meanVHI*# Threat=H*E VRR(1)=
volcanoes*pop30 H*E*V VRR(2)=
(H*E*V)/(res+1)
Risk factors Number of parameters evaluated per risk factor
Hazard (H) 10 8 (5) Volcanic Hazard (5) Volcanic Hazard Index (VHI) 15 9
Index (VHI)
Exposure (E) 7 (1) Population (1)Population (1) Total population within 30 km from 8 9
Exposure Index (PEI) Exposure Index (PEI) active volcanoes (pop30) by country
Vulnerability (V) - - - - - 10
Resilience (Res) - - - - - 13
Total number of 17 9 6 6 23 41
parameters
the observatories add stations, or some others are lost due to vulnerability factor that clearly impacts both the 3-factor VRR
volcanic activity or because they are installed in remote places and the 4-factor VRR ranking. Everman and Bàrcena volcanoes
where the weather conditions are extreme. In addition, different fall in the last two positions of both VRR(1) and VRR(2) mostly
educational activities are carried out regularly, which strengthen due to low or absence of exposed elements. The selection of time
resilience. In some cases, it is also necessary to update the hazard window of eruption occurrence (i.e.You can also read