A New Jersey Affordability Methodology and Assessment for Drinking Water and Sewer Utility Costs - A Project of New Jersey Future for Jersey Water ...
←
→
Page content transcription
If your browser does not render page correctly, please read the page content below
A New Jersey Affordability
Methodology and Assessment for
Drinking Water and Sewer Utility
            Costs

   A Project of New Jersey Future for Jersey Water Works
                 Daniel J. Van Abs PhD, FAICP/PP
        With Tim Evans and Kimberley Irby, New Jersey Future
                            August 2021
A New Jersey Affordability Methodology and Assessment for Drinking Water and Sewer Utility Costs

P a g e | ii

A New Jersey Affordability Methodology and Assessment for Drinking Water and Sewer Utility Costs

Contents
I.         Project Purpose and Background                                                      1
II.        Summary of Results and Recommendations                                              3
III.            Methodology                                                                    8
      A.        Overview                                                                       8
      B.        Water Utility Rate Schedules                                                   9
      C. Baseline Service Level                                                               10
      D. Water Utility Costs for Baseline Water Demands                                       11
      E.        Income Metrics                                                                11
      F.        Disposable Household Income                                                   12
      G. Comparison Against Thresholds                                                        14
           1.     Multi-tier Affordability Thresholds                                         14
           2.     Justification for Thresholds                                                15
           3.     Application of Thresholds to Households                                     19
           4.     Methodology Example                                                         20
      H. Aggregation of Results                                                               22
      I.        Implementation Approach                                                       22
IV.             Results                                                                       23
      A.        Statewide Results                                                             23
      B.        Regional Results                                                              26
      C. System and Municipal Results                                                         29
V.         Results Summary and Recommendations                                                32
      A.        Potential Policy and Program Uses of the Affordability Results                33
      B.        Research and Development                                                      33
Appendix A: Map Series                                                                        35
Appendix B: PCWS Cost Tables                                                                  51
Appendix C: Sewer Utility Cost Tables                                                         60
Acknowledgements                                                                              73
      Principal Investigator                                                                  73
      New Jersey Future                                                                       73
      Jersey Water Works                                                                      74
      Expert Advisory Panel                                                                   74

P a g e | iii
A New Jersey Affordability Methodology and Assessment for Drinking Water and Sewer Utility Costs
Listing of Tables
Table Title Page
ES-1 Statewide Estimates of Potential Household (HH) Affordability Stress in Response 4
to Combined Drinking Water and Sewer Costs
1 Annual Disposable Household Income at Lowest Quintile Income by County 13
2 Combined Water Utility Costs at Affordability Thresholds 15
3 Comparison of NJ Combined Residential Water Utility Costs (45,000 gallons per 16
year per household) to Threshold Maximums at LQI
4 NJ Combined Residential Weighted Average Water and Sewer Utility Costs 16
(45,000 gallons per year per household) Compared to Household Disposable
Income
5a Sewer Utility Residential Costs (45,000 gallons per year per household) 17
5b Drinking Water Utility Residential Costs (45,000 gallons per year per household) 17
6 Affordability Stress Threshold Values by County at Lowest Quintile Income 18
7a Hypothetical Low-Income Area Evaluation 20
7b Hypothetical High-Income Area Evaluation 21
8 Statewide Estimates of Household (HH) Affordability Stress to Combined Drinking 23
Water and Sewer Costs
9 Percentage of Households Exceeding Affordability Thresholds Based on 29
Combined Water Utility Costs, Within Service Areas of Large Public Community
Water Systems
10 Percentage of Households Exceeding Affordability Thresholds Based on 30
Combined Water Utility Costs, Within Service Areas of Large Public Sewer
Systems
11 Percentage of Households Exceeding Affordability Thresholds, Large 31
Municipalities
Listing of Figures
Figure Title Page
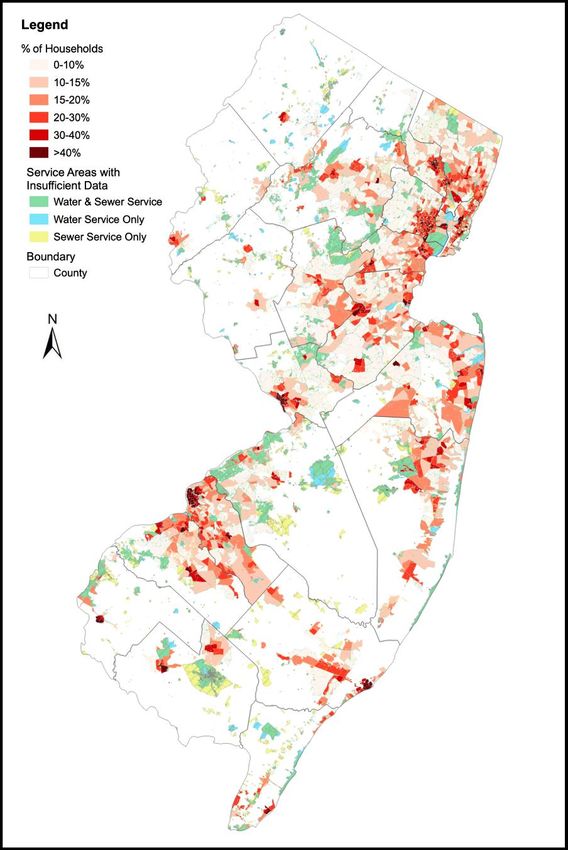
ES-1 Estimated Percentage of Households Exceeding Baseline Affordability Threshold 6
ES-2 Estimated Percentage of Households Exceeding Baseline Affordability Threshold: 7
Newark Area
1 Residential Sewer Costs (45,000 gallons per year per household) 17
2 Residential Drinking Water Costs (45,000 gallons per year per household) 18
3 Estimated Percentage of Households Exceeding Baseline Affordability Threshold 24
4 Polygon Distribution of Baseline Affordability Stress 25
5 Estimated Percentage of Households Exceeding Baseline Affordability Threshold: 27
Northeast New Jersey
6 Estimated Percentage of Households Exceeding Baseline Affordability Threshold: 28
Camden Region
P a g e | iv
I.       Project Purpose and Background
This report presents a detailed methodology for assessing the extent to which current drinking
water and sewer utility costs pose a major financial burden for New Jersey households. The
report also provides the results from applying the methodology using utility rate schedules from
the year 2020, and the most recent information on household incomes and expenditures. The
report is intended to address a primary question that New Jersey, and indeed the nation, faces:
         What is the geographic distribution and approximate number of households
         potentially facing affordability issues from water and sewer costs, if they receive
         no financial assistance?
The resulting affordability assessment for New Jersey is one metric in the “Jersey WaterCheck”
data dashboard from Jersey Water Works that will track progress in reaching the collaborative’s
goals. It will be available also as guidance for municipal, utility authority, utility and State efforts
to understand and track household affordability issues and to improve affordability assistance at
any appropriate level (e.g., utility, municipal or State). Finally, the methodology and assessment
may be useful in ongoing decision-making at the state and national levels regarding household
affordability issues and the potential development of affordability programs. The assessment
methodology is not intended for direct use in design of an affordability program at the utility or
state level, but it is intended to provide a solid sense of the magnitude and geographic
distribution of affordability stresses. It also provides a method for assessing how rate decisions,
affordability programs and financial support to utilities from the state or federal government may
change the level of household affordability stresses.
The criteria for this New Jersey affordability assessment are:
     1. Focus on households with legitimate affordability issues
     2. Useable at the utility and larger (e.g., statewide) levels
     3. Sufficient data are available for deriving the affordability assessments at relatively low
        cost
     4. Affordability benchmarks can be developed
     5. Affordability can be tracked over time
     6. Realistic results
This report builds upon three prior reports for Jersey Water Works regarding the affordability of
drinking water and sewer services for residential households in New Jersey. All reports were
supported by grants to New Jersey Future, the Jersey Water Works backbone staff
organization.
     ●   Van Abs and Evans, 2018, Assessing the Affordability of Water and Sewer Utility
         Costs in New Jersey: Phase 1 Report: Methodology Review and Preliminary
         Assessment. This report was developed on behalf of Jersey Water Works by Rutgers
         University and New Jersey Future researchers. It summarized and tested a variety of
         affordability assessment methods which have been used or proposed in the United
         States.
     ●   Van Abs, 2020, Assessing the Affordability of Water and Sewer Utility Costs in
         New Jersey: Phase 2 Report: Conceptual Issues for a New Jersey Affordability
         Assessment Methodology. This report uses the assessment methodologies reviewed
         in the Phase 1 report to suggest criteria for effective assessments of the affordability of
A New Jersey Affordability Methodology and Assessment for Drinking Water and Sewer Utility Costs

        water utility services for households, and recommendations for affordability assessment
        in New Jersey. It was initial completed in June and then revised in November 2020 to
        reflect a reevaluation of essential household costs and net disposable income at the
        county level prepared by Kimberley Irby of New Jersey Future.
    ●   Van Abs, 2020, A New Jersey Assessment Methodology for Water and Sewer
        Utility Costs. This white paper was provided in June 2020 to an expert panel and the
        Jersey Water Works Asset Management & Finance Committee for consideration. The
        white paper has been superseded by this report, where the final assessment
        methodology has been merged with the results of its implementation.
These prior products and this report support efforts of Jersey Water Works (JWW) for
development of a consensus assessment method and threshold(s) for household affordability.
This effort does not directly address affordability assessments relative to the ability of a utility to
finance capital expenditures, operations, maintenance and major repairs. Utility-level
assessments are used by the N.J. Department of Environmental Protection (NJDEP) and the
U.S. Environmental Protection Agency (USEPA) to determine compliance schedules for system
upgrades and can be used to target utility finance subsidies such as grants, loan forgiveness
and low-interest loans. However, the findings from this report can be useful in augmenting such
utility-level financial analyses.

Page |2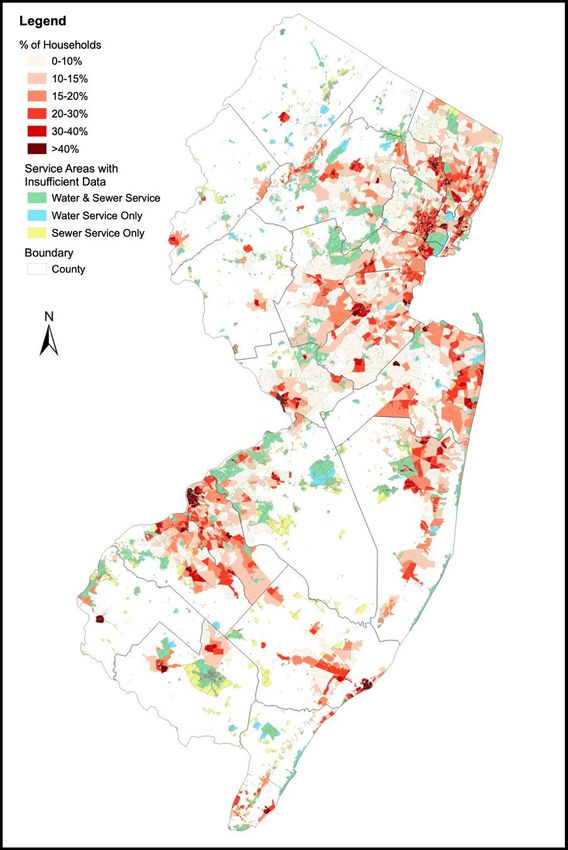
A New Jersey Affordability Methodology and Assessment for Drinking Water and Sewer Utility Costs

II.      Summary of Results and Recommendations
The major result of this investigation is that a detailed analysis of relative household affordability
stresses in New Jersey is feasible given the wealth of available data on: utility rate schedules
(compiled for this project, with 328 sewer systems and 266 water systems);1 land use/land cover
(from the NJ Department of Environmental Protection); population and household income
distributions (U.S. Census Bureau); and essential expenditures (U.S Bureau of Labor
Statistics).2 Household affordability stresses can be determined for any year using current utility
rate schedules, household incomes and household essential expenses. The methodology
provides the number and percentage of households in each geographic area where the
combined water and sewer costs exceed thresholds for affordability. The geographic areas are
small; a unique combination of Census tract, and the drinking water and sewer utilities serving
each tract. The results can be aggregated to any larger area, such as utility, municipality, county
or state. This report provides results based on the combined costs of drinking water and sewer
utilities, but the underlying spreadsheet model can be used to assess the relative impact of each
utility cost. In addition, the underlying utility cost spreadsheets can be used to determine how
costs for households could vary based on changes to water demands and the utility rate
schedules.
While the methodology can be strengthened through additional research, the results are
sufficiently robust to support planning and policy development. However, the methodology
should not be used to assess affordability stresses for specific households, which is a different
issue that requires confidential information not available for this project. In addition, it should be
noted that the analysis is focused on potential household affordability stress; it was beyond the
scope of the study to determine the extent to which these stresses may already be mitigated
through existing laws and programs.
It must be emphasized that all affordability assessment thresholds are inherently somewhat
subjective. Affordability is a continuum that changes with circumstances and time, and therefore
no perfect metric or threshold exists. In the end, all thresholds involve value judgements and
approximations. The point is to choose, assess, determine what lessons can be learned.
The affordability assessment methodology is an adaptation for New Jersey of the Affordability
Ratio method proposed by Teodoro (2018). The methodology establishes thresholds above
which household water bills cause affordability stress at three levels (baseline, high and severe)
using percentages of household disposable income for households at the Lowest Quintile
Income (LQI, which is the 20th percentile income level) for each county. Household disposable
income is calculated as the LQI minus the essential (or non-discretionary) expenses for a
household at that income level. The Phase 2 report, Appendix A, provides details on the
derivation of essential expenses by county.
The percentages used for this assessment are as follows:
   • Baseline Affordability Stress: 10 percent of Household Disposable Income
   • High Affordability Stress: 20 percent of Household Disposable Income

1 In New Jersey, roughly 90 percent of residents are served by drinking water and/or sewer utilities, representing
slightly more than 2.8 million households. The utilities included in this analysis collectively serve more than 2.6 million
households, or 91 percent of the total served statewide.
2 Essential household expenses are discussed in detail in the Phase 2 report, and the process for deriving them is

summarized in Section III.F on Disposable Household Income.

Page |3
A New Jersey Affordability Methodology and Assessment for Drinking Water and Sewer Utility Costs
• Severe Affordability Stress: 30 percent of Household Disposable Income
The methodology is applied to each geographic area that represents a unique combination of
drinking water utility, sewer utility and Census tract. The metric used here is the number of
households (HH), rather than total population, as affordability is a household finance issue.
Using these thresholds, the household income distribution for each Census tract, and 2020
water and sewer rate schedules, and the estimated number of households of each unique
geographic area, the methodology then calculates the number and percentage of households in
each geographic area where the combined water and sewer rates exceed the dollar thresholds
for baseline, high and severe affordability stress.
The statewide results are shown in Table ES-1 and Figure ES-1.3 The analysis is based on the
most recent household incomes and essential expenditures available as of early 2000, all of
which pre-date the economic impacts of the SARS-CoV-2 (COVID-19) pandemic. As can be
seen, the Baseline affordability threshold is potentially exceeded by roughly one-quarter of all
households for which cost data were available. As expected, fewer households exceed the
thresholds for High and Severe affordability stresses. Actual results will differ based on a variety
of factors, including but not limited to household size, water use efficiency, who pays the utility
costs (e.g., renters, landlord, homeowners), and subsidies. Therefore, these results should be
seen as an “upper bound” result. Actual results are likely to be lower, and as affordability
programs improve the difference between potential stresses and actual stresses would
increase, reflecting a positive outcome for low-income households.
Table ES-1. Statewide Estimates of Potential Household (HH) Affordability Stress in Response
to Combined Drinking Water and Sewer Costs
HHs in polygons with Estimated # of HHs Estimated # of HHs Estimated # of HHs
sufficient water and potentially exceeding potentially exceeding potentially exceeding
sewer cost data Baseline threshold High threshold Severe threshold
2,658,052 546,270 480,157 457,705
20.6% 18.1% 17.2%
For the largest water and sewer systems, the ranges of aggregate Baseline affordability stress
range widely, from 5% of households to more than 50%. The same is true of aggregate results
for the largest municipalities, ranging from less than 5% to more than 55%. A review of the
statewide map confirms general expectations that areas with higher concentrations of low-
income households will have greater affordability stresses. However, complicating this picture
are the major differences in water and sewer costs4 and the major differences in county values
for essential household expenditures and therefore household disposable income.
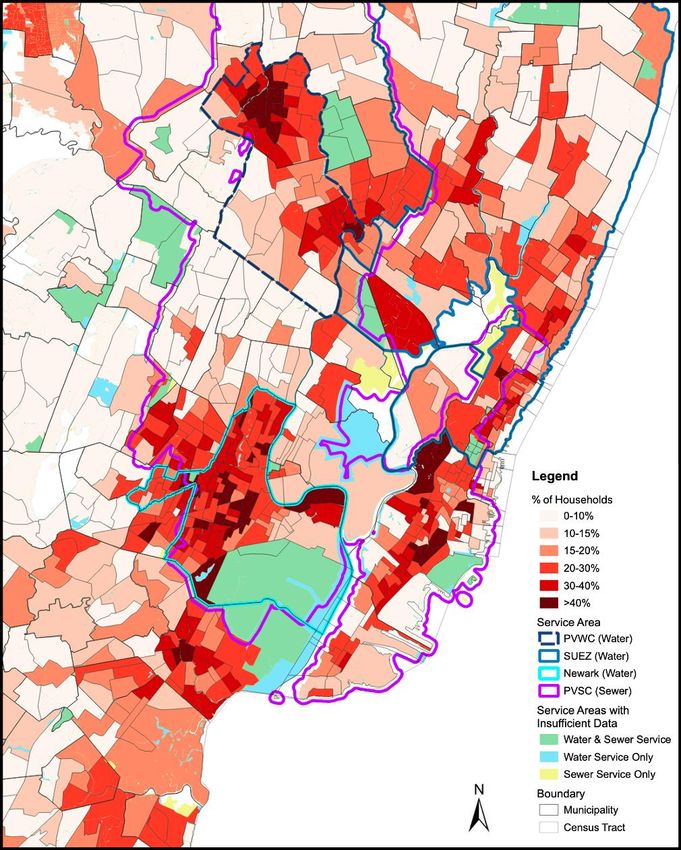
Figure ES-2 is a closer look at one area of Figure ES-1, showing the area around Newark, NJ.
One notable point is that there is significant geographic variation in results even within systems
(the same is true for municipalities). Therefore, it would be incorrect to assume that household
affordability issues for a single system can be fully understood at the system level. It is the
3See Chapter IV, Results, for a more detailed explanation of the mapping process.
4While the median and maximum costs are similar for the largest water utilities, the maximum costs for medium
utilities are more than double the median costs. A similar pattern exists for sewer utilities, where the maximum costs
are roughly double the median costs.
Page |4
A New Jersey Affordability Methodology and Assessment for Drinking Water and Sewer Utility Costs

granular, polygon-based analysis of this methodology that provides a wealth of information not
available with generalized methods.
Inevitably, the project team identified ways in which this methodology could be strengthened, as
discussed in the section on Research and Development. In summary, these research and
development efforts would include a more detailed analysis of selected areas with high
affordability stresses to determine the extent to which the stresses may be alleviated (e.g.,
housing subsidies, rent regulation, rate subsidies for military veterans and senior citizens) or
hidden from the direct consumer (e.g., utilities paid by landlords rather than by tenants). 5 Further
work on county-level essential household expenses would be useful, along with an evaluation of
whether those expenses vary significantly for household incomes below and above the LQI.
Regarding water demands, the methodology uses a “nominal household demand” of 45,000
gallons per year based on prior research. Research on the relationship between household size
and demands would provide a more nuanced view of actual water costs. Finally, a sensitivity
analysis could be conducted to show the effects on affordability stress of utility cost trends and
rate schedules (e.g., the ratio between fixed and volumetric charges for households using
different amounts of water).
The affordability assessment methodology and findings provided in this report represent a major
step forward for New Jersey decision makers. Affordability stresses can be assessed statewide
and down to a granular level. The methodology also provides a way of understanding the
implications of cost increases on affordability at any geographic level. We recommend use of
this report to develop approaches at all levels, from utility to national, for mitigating household
affordability stresses related to drinking water and sewer utility costs.
The remainder of this report provide the detailed methodology and results.

5Additional information on these issues is presented in a report to Jersey Water Works by the Natural Resources
Defense Council (2019), Promoting Affordability of Public Water and Sewer Service for Low-Income Households in
New Jersey: Policy Options.

Page |5

A New Jersey Affordability Methodology and Assessment for Drinking Water and Sewer Utility Costs

Figure ES-1. Estimated Percentage of Households Exceeding Baseline Affordability
Threshold

Page |6
A New Jersey Affordability Methodology and Assessment for Drinking Water and Sewer Utility Costs

                                Newark Liberty International Airport &
                                Port Newark-Elizabeth Marine Terminal

Figure ES-2. Estimated Percentage of Households Exceeding Baseline Affordability
Threshold: Newark Area

Page |7
A New Jersey Affordability Methodology and Assessment for Drinking Water and Sewer Utility Costs
III. Methodology
This section provides an overview and details of the affordability assessment methodology as
applied to New Jersey utility information and household demographics.
A. Overview
The methodology will allow for an estimation of the number and percent of households in a
geographic area for whom combined drinking water and sewer rates impose a Severe, High or
Baseline affordability stress based on a comparison of rates to threshold percentages of their
disposable income. The methodology requires several steps of data gathering, followed by
analysis of the data against affordability thresholds. No information is required from individual
households for this approach. The general steps are as follows:
1. Water Utility Rates: The drinking water and sewer utility (i.e., water utility) rate
schedules for the target geographic area (state, county, utility) must be compiled and
assessed to understand if and how rates per volume change with increasing demands.
2. Baseline Service Level: A level of per capita demand must be established that
constitutes a volume of water deemed essential for normal household uses, not
including outdoor uses or any luxury demands. A nominal household size must be
selected, multiplied by the per capita demand to yield a nominal household demand at
the baseline service level.
3. Water Utility Costs for Baseline Water Demands: For each utility, the costs are the
annual charges for the baseline service level for the nominal household size. The total
utility costs are the combined costs of drinking water and sewer service for the nominal
household.
4. Income Metrics: Household income must be assessed at the Census tract level, so that
analytical results are not skewed at the larger geographic aggregations such as utility,
county or state. The number of households at each income range are collected for each
Census tract.
5. Disposable Household Income: Then, a household income statistic must be selected
to serve as a representative household income. The county 20th percentile income
(Lowest Quintile Income) is used here. Given cost of living differences within New
Jersey, household income must be adjusted to reflect necessary or essential expenses,
to provide an estimate of available income against which water utility costs are
compared. The adjustments should be as fine scale as data allow.
6. Comparison of Utility Costs to Available Household Income: The comparison here
is utility costs as a percentage of disposable household income.
7. Comparison Against Thresholds: The methodology uses a range of thresholds to
identify the number of households for which current water utility rates exceed each
threshold, indicating affordability stresses for the representative households. The
Baseline, High and Severe thresholds are represented by specific percentages (10, 20
and 30 percent, respectively) of Household Disposable Income for a household at the
Lowest Quintile Income.
Page |8A New Jersey Affordability Methodology and Assessment for Drinking Water and Sewer Utility Costs
8. Aggregation of Results: The results of this analysis at the Census tract level are then
aggregated to the utility, county or statewide level.
B. Water Utility Rate Schedules
Roughly 90 percent of New Jersey households are served by drinking water and sewer utilities.
Unlike household income and expenditure information, there is no centralized database that
routinely collects rate schedules for all drinking water and sewer utilities in New Jersey. Nor is
there a standard format for rate schedules that simplifies the comparison of rates and costs.
Rate schedules may or may not be available to the public using online resources. For this
reason, compiling and interpreting rate schedules was the most complicated and time-
consuming portion of the project. One recommendation resulting from this project is that state
guidance be developed on methods to improve the clarity of rate schedules, and that a
statewide information site be developed where utilities would upload their rate schedules.
Drinking water and sewer utility rates are generally based on one or more methods of assigning
costs to ratepayers:
• Fixed charges – a cost, often quarterly but sometimes annual, that is paid by a
household regardless of how much water they use or sewage they generate.
• Volumetric charges – a cost per thousand gallons or hundred cubic feet (equivalent to
748 gallons) of water used or sewage generated.
In some cases, utilities (especially sewer utilities that do not have access to water demand data)
rely entirely on a fixed charge (all households pay the same amount regardless of demand).
Drinking water utilities are more likely to combine a fixed charge plus a volumetric charge, as
are many sewer utilities. A few utilities use only a pure volumetric (no fixed charge), while
roughly 80 sewer utilities do not charge residential customers at all, as utility costs are covered
through property taxes.
In this report, rate schedules from early to mid-2020 are used. Rates were collected by Rutgers
team members. The rate schedules were available from a variety of sources: online utility web
sites; municipal ordinance codes (primarily accessed through https://eCode360.com), the Board
of Public Utilities, and direct inquiries by email and telephone. Rate schedules were compiled, to
the extent possible, for all drinking water systems with more than 3,300 residents and some
smaller systems, a total of 266 systems representing nearly 90 percent of all households with
drinking water service.6 All these systems are regulated under state permits. Through Jersey
Water Works, and as part of a Jersey WaterCheck project, all utilities whose rates were
gathered were requested to examine and recommend corrections to the resulting costs, an
opportunity that some utilities did take. However, despite the efforts made, the project team
cannot guarantee total success in interpreting rate schedules.
For the sewer utilities, rates were collected for all utilities contributing sewage flows to the
largest treatment plants comprising a total of 95% of all sewage flow in New Jersey, a total of
328 systems representing nearly 90 percent of all households with sewer service. The situation
6 A drinking water system is a contiguous distribution system under single ownership, which may deliver water from
its own supplies and treatment system, from another system that provides treated or untreated water through bulk
sales, or a combination thereof. Likewise, a sewer system is a contiguous collection system under single ownership,
which may include a treatment plant or may send the wastewater to a regional treatment facility. A utility is an
ownership entity, which may include multiple independent systems.
Page |9A New Jersey Affordability Methodology and Assessment for Drinking Water and Sewer Utility Costs
for sewer systems is more complicated than for drinking water systems, as in many cases a
regional treatment plant that is directly regulated by NJDEP will accept sewage from many
municipalities and municipal utility authorities that are not similarly regulated by NJDEP (through
NJPDES permits) because they do not own a treatment plant. In most cases, the regional utility
charges the contributing systems based on total volume, and the contributing systems then bill
residential customers directly (potentially including both the regional utility charge and a local
charge). The Camden County Municipal Utilities Authority (CCMUA) is a major exception to this
approach, as it bills residential customers directly. Where a regional treatment plant receives
sewage from contributing systems with their own customer base and rates, the rates for those
municipal system or municipal utility authorities were collected. In the case of CCMUA, the rates
for CCMUA were added to the local collection system charge, if any.
As discussed in the Phase 1 report, one analytical complexity is that rental households in multi-
family apartment complexes pay water utility costs through their rents, rather than directly. For
this report, the assumption is that all households pay their utility costs directly, as a first-level
assessment. Also, this methodology does not address how affordability stresses could be
modified through rate schedule changes (e.g., shifting from heavy dependence on fixed charges
to more use of volumetric charges). The focus here is on “what is”, not “what could be.”
C. Baseline Service Level
Baseline service levels require determination of a per capita demand and a household size that
are used as the basis for comparison to rates, as a “nominal household”. In reality, a wide range
of per capita demands and household sizes exist in all areas. Higher levels of precision will
result in more complicated calculations. For a large-scale methodology, the assumptions are
focused on simplicity of analysis.
This methodology uses 40 gpcd (14,600 gallons per year per person) as most appropriate for
New Jersey use. This demand level is based on national practice and recommendations
documented in the Phase 2 report, which range from 35 to 50 gallons per person per day
(gpcd), and New Jersey demand evaluations which indicate typical water demands of 40 to 60
gpcd for high-density development.
The justification is that the 50 gpcd levels recommended nationally are intended to address
typical baseline needs across a wide variety of climates, including some for which higher indoor
demands are a necessity for a basic quality of life. On the other hand, 35 gpcd is considered a
constrained demand that requires either high-efficiency appliances for all water demands (which
is likely unaffordable to low-income households) or major constraints on normal water demands.
In Van Abs et al. (2018),7 the average demand for high-density development, non-summer use
in the Highlands/Ridge and Valley areas was 42 gpcd, and the Coastal Plain was 48 gpcd.
These values reflect water demands for a variety of household incomes and sizes. Therefore, a
level of 40 gpcd is more reasonable for New Jersey, selected to reflect a water lifestyle that is
water conserving but not highly constrained.
The second part of this step is to multiply the 40 gpcd by a household size. New Jersey’s
average household size is 2.71, with 2.81 for owner-occupied and 2.52 for renter-occupied.
These values are slightly different, but the municipal distributions for these figures are even
7Van Abs, Daniel, Jiayi Ding and Eric Pierson. 2018. Water Needs through 2040 for New Jersey Public Community
Water Supply Systems. Rutgers University, New Brunswick, NJ. https://www.danvanabs.com/recent-projects.html
P a g e | 10A New Jersey Affordability Methodology and Assessment for Drinking Water and Sewer Utility Costs
more different, with the averages of all municipalities at 2.78 for owner-occupied and 2.33 for
renter-occupied.
However, recognizing that the municipal averages are not population-weighted, this
methodology uses the statewide average, rounded up to 3 persons per household.8 As a
result, the household water use is 120 gpcd, or 43,800 gallons per year per household. Again,
for ease of calculation, a rounded figure of 45,000 gallons per year per household will be
used.
D. Water Utility Costs for Baseline Water Demands
Combined water utility costs are determined by applying the rate schedule to demands (in this
case the baseline service level) using both fixed and volumetric charges as applicable. Only
where the municipality covers all utility costs through property taxes will there be no utility
charge. Combined water utility costs are then determined for each unique relationship of
drinking water and sewer utilities within a Census tract. In other words, if two sewer utilities and
one drinking water utility serve areas within the Census tract, there would be two unique
relationships (Sewer 1 and Drinking Water; Sewer 2 and Drinking Water) to be summed.
E. Income Metrics
For this methodology, the Lowest Quintile Income, or LQI (i.e., 20th Percentile Household
Income) is used to develop thresholds of affordability; it is the highest income of the lowest
quintile of household incomes. The latest American Community Survey (ACS) from the Census
Bureau will generally be the best available source of income information, recognizing that there
is inherent uncertainty in these estimates due to sample size. (Census data should be used
when relatively recent.) It is recognized that households with even lower incomes will be more
stressed than those actually at the LQI. However, use of the LQI represents a major
improvement over the use of USEPA’s median household income, and does not involve so
many income metrics that the methodology becomes cumbersome. LQI estimates are
developed at the county level. Where a utility service area includes more than one county, the
relevant LQI for each county is used to derive affordability thresholds in the relevant Census
tracts.
8The use of this value represents a shift from the Phase 1 report, which used 4 persons per household to reflect
national practice.
P a g e | 11A New Jersey Affordability Methodology and Assessment for Drinking Water and Sewer Utility Costs
Household incomes at the Census Tract level are used for comparison to water utility costs for
baseline demands for each drinking water and sewer system associated with each Census
Tract. For this methodology, information at the Census tract is used to provide a high level of
resolution within larger geographic areas such as utility, county and state.9 The methodology
recognizes that households above the LQI could exceed the affordability thresholds in some
areas, which households below the LQI could be within the affordability thresholds in other
areas (e.g., areas with relatively high incomes and low utility costs).
F. Disposable Household Income
There is no compiled government analysis of what part of the LQI should be considered
available to address utility and other costs. Therefore, this report relies on a modification of the
Teodoro (2018) approach of estimating disposable income by subtracting “essential household
expenses” (other than water and sewer costs) using the Consumer Expenditure Survey (CEX)
from the U.S. Bureau of Labor Statistics. The term “essential” goes beyond survival to
encompass normal, necessary uses associated with household functions, and not including
luxury items.
While the Teodoro methodology is generally used at the metropolitan area level or larger,
Teodoro (a member of the expert advisory panel for this project) suggested that many New
Jersey counties have sufficient population to justify use at that that level, recognizing that there
may be a need to aggregate the very smallest counties in the Delaware Bay Area-Cape May,
Cumberland, Salem. The CEX survey samples are of actual households across a wide range of
incomes to determine actual expenditures. To avoid the use of aggregate expenditures across a
full range of household incomes, Teodoro (2020) estimated “essential non-water expenditures
…with a regression model, which used Bureau of Labor Statistics Consumer Expenditure
Survey data to estimate expenditures on taxes, housing, health care, food, and home energy.
Coefficients from that model were combined with ACS data on demographics and income for
each utility to estimate essential expenditures at the 20th percentile income for a family of
four.”10 It is recognized that the boundaries of the Disposable Household Income analysis will
often not coincide with the boundaries of water or sewer utilities compiled by the NJDEP. For
this reason, GIS relationships must be established to allow comparisons for each unique
geographic area.
The methodology relies on county-level assessments of essential expenditures and LQI, as
discussed in detail in Appendix A of the revised Phase 2 report. Essential expenditures are
defined for this project as they were in Teodoro (2018) except for the addition of transportation
costs, which are often considered an adjunct cost to housing. Utility-level LQI information would
have provided a greater level of resolution. However, the affordability thresholds are applied to a
combination of water and sewer utility rates, and many water and sewer utilities do not have
contiguous boundaries. The resulting complexity of analysis made the use of utility-level LQI
9 In addition, at the utility level, the Environmental Finance Center at the University of North Carolina has developed a
valuable tool that allows evaluation of rates across a wide spectrum of household incomes. This tool can help utilities
and municipalities understand the specific income distributions and stresses of households in their jurisdiction. It can
be used at any geographic level down to Census tract, but not in a manner that is easy to aggregate. Water &
Wastewater Residential Rates Affordability Assessment Tool, https://efc.sog.unc.edu/resource/water-and-
wastewater-residential-rates-affordability-assessment-tool
10 Teodoro, Manuel P., and Robin Rose Saywitz. 2020. Water and sewer affordability in the United States: a 2019
Update. AWWA Water Science 2020; e1176. DOI: 10.1002/aws2.1176. For this methodology, a household size of
four persons was used.
P a g e | 12A New Jersey Affordability Methodology and Assessment for Drinking Water and Sewer Utility Costs
results untenable for disposable household income.11 Sufficient CEX data were available to
derive estimates of essential expenditures for each county without aggregation. The result of the
analysis is a county-level estimate of essential expenditures and Household Disposable Income
at the LQI.
Table 1 shows the results for New Jersey’s 21 counties, along with a statewide population-
weighted average for comparison. The range of LQI and annual disposable incomes are from a
high of $50,000 and over $17,000 in Hunterdon County (which has a median home value of
$433,000), to less than $19,000 and $1,500 in Cumberland County (which has a median home
value of $172,000),12 differences of 2.66 and 11.5 times. On the other hand, the range of annual
essential expenditures is from nearly $33,000 to just over $17,000, a difference of 1.9 times,
driven considerably by housing costs. The range of disposable income as a percentage of LQI
is also wide, from a low of 8% in Cumberland County to a high of 34.5% in Hunterdon County, a
four-fold increase.
Table 1. Annual Disposable Household Income at Lowest Quintile Income by County
20th Monthly Annual Annual Disposable
County Percentile Essential Essential Disposable Income as %
Income (LQI) Expenditures Expenditures Income of LQI
Atlantic $23,104 $1,735 $20,820 $2,284 9.9%
Bergen $37,211 $2,278 $27,336 $9,875 26.5%
Burlington $39,344 $2,255 $27,060 $12,284 31.2%
Camden $24,911 $1,807 $21,684 $3,227 13.0%
Cape May $28,461 $1,999 $23,988 $4,473 15.7%
Cumberland $18,782 $1,440 $17,280 $1,502 8.0%
Essex $20,389 $1,527 $18,324 $2,065 10.1%
Gloucester $35,788 $2,172 $26,064 $9,724 27.2%
Hudson $25,091 $1,800 $21,600 $3,491 13.9%
Hunterdon $50,005 $2,728 $32,736 $17,269 34.5%
Mercer $29,115 $1,924 $23,088 $6,027 20.7%
Middlesex $35,925 $2,212 $26,544 $9,381 26.1%
Monmouth $37,853 $2,294 $27,528 $10,325 27.3%
Morris $48,912 $2,668 $32,016 $16,896 34.5%
Ocean $28,577 $1,969 $23,628 $4,949 17.3%
Passaic $24,817 $1,744 $20,928 $3,889 15.7%
Salem $22,490 $1,655 $19,860 $2,630 11.7%
Somerset $47,381 $2,632 $31,584 $15,797 33.3%
Sussex $41,940 $2,385 $28,620 $13,320 31.8%
Union $31,951 $1,998 $23,976 $7,975 25.0%
Warren $32,699 $2,074 $24,888 $7,811 23.9%
Weighted Avg $32,900 $2,072 $24,865 $8,035 24.4%
Maximum $50,005 $2,728 $32,736 $17,269 34.5%
Minimum $18,782 $1,440 $17,280 $1,502 8.0%
11
It should be noted that household income data for each combination of water and sewer service area are used to determine the
number of households that may face affordability stresses, as discussed in later sections.
12
Both median home values are from the National Association of Realtors, at https://www.nar.realtor/research-and-
statistics/housing-statistics/county-median-home-prices-and-monthly-mortgage-payment.
P a g e | 13A New Jersey Affordability Methodology and Assessment for Drinking Water and Sewer Utility Costs
These ranges show the usefulness and also the difficulty of using such metrics. It is clear that
the counties vary enormously regarding their household income metrics, essential expenditures
and disposable incomes, so it makes sense that a household at the LQI in each county will be
more or less stressed by equal water utility costs. However, a household income of $20,000 in
any county would mean that the household faces severe constraints regardless of cost of living.
Further research into this question would be useful. In addition, the project team did analyze the
extent to which essential expenditures increase with income, by estimating essential
expenditures at the 40th percentile level using the same methodology as for the LQI. The
purpose was to determine whether the essential expenditures differed markedly at the two
income levels, and whether those differences required incorporation of graduated essential
expenditures across incomes. The result of a preliminary analysis indicates that using
graduated essential expenditures would provide limited additional precision to the methodology,
but at a major cost of complexity in the spreadsheet model. The use of the 20th percentile
essential expenditures across all incomes may underestimate affordability stresses. However,
some households may already receive financial assistance, resulting in an overestimate of
affordability stresses. Therefore, the project team decided to not use graduated essential
expenditures due to modeling complexity, but rather use the 20th percentile essential
expenditures throughout.
G. Comparison Against Thresholds
This methodology uses a three-threshold approach, where an initial (baseline) threshold
would be used to identify the number of households that are potentially stressed by combined
water utility costs. The other two thresholds would indicate high and severe stress. A three-tier
approach has also been recommended by Raucher, et al., and the California Water Resources
Control Board, and implemented by Philadelphia. All of these methods recommend using
combined utility costs, as used in this methodology. However, the methodology below differs
from these other approaches regarding purpose (assessment versus customer assistance),
structure (single metric or multi-metric) or details. Raucher, et al., is focused on assessment
using two metrics: a comparison of Household Burden Index (a household indicator similar to
the approach recommended herein) and Poverty Prevalence Indicator (a community indicator).
California WRCB is focused on customer assistance, using thresholds for utility costs relative to
a percentage of the federal poverty level; this is similar to the Philadelphia customer assistance
program implemented in 2017.
Again, it must be emphasized that all affordability assessment thresholds are inherently
somewhat subjective. Affordability is a continuum that changes with circumstances and time,
and therefore no perfect metric or threshold exists. In the end, all thresholds involve value
judgements and approximations. The point is to choose, assess, determine what lessons can be
learned. With experience, we can modify the choices if necessary and reassess over time.
1. Multi-tier Affordability Thresholds
The affordability assessment uses the following three thresholds, based on total water utility
costs for basic demands as a percentage of Household Disposable Income for a three-person
household at LQI:
1. Severe Affordability Stress: 30 percent of Household Disposable Income
2. High Affordability Stress: 20 percent of Household Disposable Income
3. Baseline Affordability Stress: 10 percent of Household Disposable Income
P a g e | 14A New Jersey Affordability Methodology and Assessment for Drinking Water and Sewer Utility Costs
2. Justification for Thresholds
Raucher et al. uses a “Very High Burden” threshold of 10% of LQI for their Household Burden
Index. This threshold is equivalent, at the national level, to a burden of 4% MHI (USEPA’s
threshold), as discussed in the Phase 2 report. That is, a combined water utility bill that
represents 4% MHI would be 10% of LQI using national figures. However, they acknowledge
the benefit of incorporating cost of living in the index; at LQI, households are highly stressed
financially. As noted in the prior reports for this project, the Household Survival Budget from the
United For ALICE project show that even under a higher income than the LQI, many families are
not financially viable and yet are typically ineligible for government assistance such as LI-HEAP.
According to the United For ALICE project, costs for a New Jersey family of four (two adults,
one infant and one preschooler) was $74,748 (2018 report), while the New Jersey LQI used
here is $32,900.
The calculated New Jersey statewide Household Disposable Income ($8,035) as reported in the
revised Phase 2 report amounts to 24.4% of the statewide LQI of $32,900. Ten percent of total
LQI ($3,290) would be 40.9% of Household Disposable Income at LQI. This value would be an
extremely large portion of a household budget at LQI. More appropriately, as Household
Disposable Income declines, the income reasonably available for combined water and sewer
utility costs would also decline. This approach recognizes that as disposable income falls, more
choices must be made regarding fundamental costs of living, and non-essential purchases
become impossible to maintain. Therefore, an expenditure of 10% of Household Disposable
Income at LQI on water utilities is proposed as the threshold level of a baseline stressed budget
for the nominal household of three with a nominal annual water demand of 45,000 gallons.
Based on this threshold for Baseline Affordability Stress, the thresholds for High Affordability
Stress and Severe Affordability Stress are stepped up in 10% increments. This increment
recognizes that lower thresholds will reduce stress, but the increments are not specifically
based on a level of stress, as no studies are available assess this relationship.
Essentially, this methodology uses the Teodoro Affordability Ratio method but with some
different values for annual water demand. Table 2 shows the maximum combined water utility
costs (i.e., drinking water and sewer) that would not exceed each of the three thresholds,
relative to various incomes at or below the statewide LQI. As income drops, the dollar results
from the thresholds also drop, to a point where for the lowest income tiers, there is no affordable
combined utility cost. Given New Jersey’s high cost of living, this result is reasonable.
Table 2. Combined Water Utility Costs at Affordability Thresholds
Total Essential Household Maximum Combined Water and Sewer
Household Expenses: Disposable Utility Costs at Thresholds
Income (HHI) Statewide at Income Baseline High Severe
LQI 10% 20% 30%
$32,900 (LQI) $24,865 $8,035 $804 $1,607 $2,411
$30,000 $24,865 $5,135 $514 $1,027 $1,541
$25,000 $24,865 $135 $14 $27 $41
$20,000 $24,865 ($4,865) ($487) ($973) ($1,460)
$15,000 $24,865 ($9,865) ($987) ($1,973) ($2,960)
P a g e | 15A New Jersey Affordability Methodology and Assessment for Drinking Water and Sewer Utility Costs
These results are compared in Table 3 to the 2020 water and sewer utility cost statistics in New
Jersey. The amounts shown in the last three columns are the extent to which the various cost
statistics, from maximum to minimum, exceed the cost thresholds in Table 1 at LQI. As shown,
combined water utility costs at the maximum level are far higher than all the thresholds, while
combined water utility costs at the minimum and population-weighted average level are routinely
below all the thresholds.
Table 3. Comparison of NJ Combined Residential Water Utility Costs
(45,000 gallons per year per household) to Threshold Maximums at LQI
Amount in Excess Amount in Excess of Amount in Excess
Statistic Amount
of 10% Threshold 20% Threshold of 30% Threshold
MAXIMUM $1,612 $809 $5 ($799)
MINIMUM $66 ($738) ($1,541) ($2,345)
WEIGHTED AVG $673 ($131) ($934) ($1,738)
Table 4 then compares the weighted average combined utility costs from Table 3 to the
household disposable incomes from Table 2. The results at the LQI are the same as in Table 3.
At lower levels of household disposable income, the thresholds are all exceeded and to
increasing levels.
Table 4. NJ Combined Residential Weighted Average Water and Sewer Utility Costs
(45,000 gallons per year per household) Compared to Household Disposable Income
Household Weighted Amount in Excess Amount in Excess Amount in Excess
Disposable Income Average Utility of 10% Threshold of 20% Threshold of 30% Threshold
Costs
$8,035 (at LQI) $673 ($131) ($934) ($1,738)
$5,135 $673 $160 ($354) ($868)
$135 $673 $660 $646 $633
($4,865) $673 $1,160 $1,646 $2,133
($9,865) $673 $1,660 $2,646 $3,633
The utility cost statistics are as shown in Table 5a and Figure 1 for sewer systems and Table
5b and Figure 2 for drinking water systems.
In Table 5a, the sewer utilities are grouped by treatment plant size. Note that regional systems
receive sewage from multiple municipalities, each of which may have its own rates that
incorporate the regional utility costs (usually charged to the municipal utility or municipal utility
authority as a lump sum) plus local utility costs. In addition, 81 municipalities that run sewage
collection systems do not charge residential users (primarily in the Bergen County Utilities
Authority district); instead, all residential costs are paid through the municipal general budgets
using the ad valorem property tax; these municipalities are not included in the statistics. As can
be seen, there are large differences between minimum and maximum costs. The highest
maximums are shown in the Medium category, while the lowest minimum costs are in
municipalities within the High category. The Medium category also has the highest difference
between median and maximum costs.
P a g e | 16A New Jersey Affordability Methodology and Assessment for Drinking Water and Sewer Utility Costs
Table 5a. Sewer Utility Residential Costs (45,000 gallons per year per household)
System Priority # of # Prop
Minimum Median Maximum
(Based on Treatment Plant Flows) Utilities Tax
High (STP>19 MGD average flow) $30.08 $370.00 $840.00 245 77
Medium (STP>2 MGD average flow) $100.00 $460.00 $1,200.00 43 3
Low (STP>0.5 MGD average flow) $247.18 $461.25 $827.40 33 1
Very Low (STP19 MGD Medium (STP>2 MGD Low (STP>0.5 MGD Very Low (STPA New Jersey Affordability Methodology and Assessment for Drinking Water and Sewer Utility Costs
Residential Drinking Water Costs
(45,000 gallons per year)
$1,000
$900
$800
$700
$600
$500
$400
$300
$200
$100
$0
Very Large Large (50,000 to Medium (10,000 to Medium (3,300 to Small (500 to Very Small (100,000)A New Jersey Affordability Methodology and Assessment for Drinking Water and Sewer Utility Costs
Table 6. Affordability Stress Threshold Values by County at Lowest Quintile Income
County Baseline Income Statistics Maximum Combined Water and Sewer
Utility Costs at Thresholds
County 20th Percentile Annual Disposable Baseline High Severe
Income Income (10%) (20%) (30%)
Essex $20,389 $2,065 $207 $413 $620
Gloucester $35,788 $9,724 $972 $1,945 $2,917
Hudson $25,091 $3,491 $349 $698 $1,047
Hunterdon $50,005 $17,269 $1,727 $3,454 $5,181
Mercer $29,115 $6,027 $603 $1,205 $1,808
Middlesex $35,925 $9,381 $938 $1,876 $2,814
Monmouth $37,853 $10,325 $1,033 $2,065 $3,098
Morris $48,912 $16,896 $1,690 $3,379 $5,069
Ocean $28,577 $4,949 $495 $990 $1,485
Passaic $24,817 $3,889 $389 $778 $1,167
Salem $22,490 $2,630 $263 $526 $789
Somerset $47,381 $15,797 $1,580 $3,159 $4,739
Sussex $41,940 $13,320 $1,332 $2,664 $3,996
Union $31,951 $7,975 $798 $1,595 $2,393
Warren $32,699 $7,811 $781 $1,562 $2,343
3. Application of Thresholds to Households
The critical step is to determine the number of households for which actual household income is
not sufficient to pay the utility costs without exceeding each of the three thresholds. Put
differently, the intent is to quantify the number of households per unique geographic area for
which Household Disposable Incomes are below the level at which the combine utility costs for
a 3-person household would constitute 10, 20 and 30 percent of Household Disposable Income.
However, given that the only information available for household income distribution is for total
household income, the methodology determines the minimum total household income for which
the utility costs would not exceed the affordability thresholds based on Table 6. While the
Teodoro (2018) method provides an affordability stress level for households at the LQI, the
methodology for this project wanted to determine the number of households at all income
ranges where the combined water utility costs exceed the relevant percentage from Table 6.
For example, if the combined water utility costs were exactly equal to the Baseline Affordability
Thresholds as % of LQI, then all households with incomes at or below the LQI would be counted
as having baseline affordability stresses, while no households of higher income would be
included. The higher the combined water utility costs, the more households above the LQI will
be assessed as having baseline affordability stresses. It is important to note that these higher-
income households will be less stressed that those of lower income, but they still will be
considered stressed.
P a g e | 19A New Jersey Affordability Methodology and Assessment for Drinking Water and Sewer Utility Costs
This analysis is based on the relevant combined water utility rates and the distribution of
household incomes within each Census tract for each unique combination of Census tract,
drinking water utility and sewer utility. The household incomes from the Census Bureau are
grouped in ranges (e.g., 25,000 to 34,999), and so the top and bottom income associated with
each range is compared to the combined utility costs for the nominal household. If the costs
exceed the threshold at the bottom of the range, then all households in that income range are
assumed to have unaffordable rates. If the costs exceed the threshold at the bottom of an
income range but not at the top, then a proportional number of households within that range are
assumed to have unaffordable rates. For example, if 100 homes are within an income range of
$10,000 and the threshold is exactly at the halfway point, then 50 homes would be counted as
above and below the threshold.
In actuality, households in each range will have higher or lower utility bills (based on actual
household size and water demand patterns) and higher or lower incomes. There will not be a
direct relationship between the income variation and the utility bills. However, for the purposes
of this analysis, the expectation is that the use of even income distributions for each income
range, the three thresholds, and utility costs based on 45,000 gallons per year demands will
provide a robust estimate of affordability stress, enabling a comparison across and within utility
service areas and government jurisdictions.
4. Methodology Example
In this section, the methodology is applied to two hypothetical polygons (i.e., combination of
Census tract, drinking water utility and sewer service utility) of relatively low and relatively high
median income levels. These hypothetical examples use the Atlantic County LQI of $23,104, of
which the essential expenditures are $20,820 and the annual disposable income is $2,284 (see
Table 1). The combined utility costs in this example are the New Jersey weighted average of
$673; using the baseline threshold of 10 percent, that equates to a need of $6,730 of disposable
income to be affordable at the baseline affordability threshold (10%), $3,365 for the high
affordability threshold (20%) and $2,243 for the severe affordability threshold (30%). As a result,
the threshold incomes in the third through fourth columns are the total of essential expenditures
($20,820) and the income needed to manage the utility costs at each threshold. Table 7a (low-
income example) and Table 7b (high income example) show the number of households in each
income range that exhibit affordability stress at the three levels. As shown in these hypothetical
examples, the lower-income polygon exhibits far higher affordability stress levels than the
higher-income polygon. The spreadsheet model calculates results for each of more than 5,000
polygons and then aggregates the results by drinking water utility, sewer utility and municipality.
Table 7a. Hypothetical Low-Income Area Evaluation
(Using Atlantic County Disposable Income, $673 Annual Combined Utility Costs)
Threshold Threshold Threshold
# of HH # of HH # of HH
Highest Income for Income for Income for
# of Exceeding Exceeding Exceeding
Income of Baseline High Severe
HH Baseline High Severe
Cohort Affordability Affordability Affordability
Threshold Threshold Threshold
Stress Stress Stress
$10,000 117 $27,550 $24,185 $23,063 117 117 117
$14,999 181 $27,550 $24,185 $23,063 181 181 181
$24,999 397 $27,550 $24,185 $23,063 397 365 320
P a g e | 20A New Jersey Affordability Methodology and Assessment for Drinking Water and Sewer Utility Costs
Table 7a. Hypothetical Low-Income Area Evaluation
(Using Atlantic County Disposable Income, $673 Annual Combined Utility Costs)
Threshold Threshold Threshold
# of HH # of HH # of HH
Highest Income for Income for Income for
# of Exceeding Exceeding Exceeding
Income of Baseline High Severe
HH Baseline High Severe
Cohort Affordability Affordability Affordability
Threshold Threshold Threshold
Stress Stress Stress
$34,999 286 $27,550 $24,185 $23,063 73
$49,999 167 $27,550 $24,185 $23,063
$74,999 213 $27,550 $24,185 $23,063
$99,999 85 $27,550 $24,185 $23,063
$149,999 100 $27,550 $24,185 $23,063
$199,999 53 $27,550 $24,185 $23,063
Above
66 $27,550 $24,185 $23,063
$200,000
Census
1665 768 663 618
Tract Totals
% of
46.12% 39.80% 37.13%
Households
Table 7b. Hypothetical High-Income Area Evaluation
(Using Atlantic County Disposable Income, $673 Annual Combined Utility Costs)
Threshold Threshold Threshold
# of HH # of HH # of HH
Highest Income for Income for Income for
# of Exceeding Exceeding Exceeding
Income of Baseline High Severe
HH Baseline High Severe
Cohort Affordability Affordability Affordability
Threshold Threshold Threshold
Stress Stress Stress
$10,000 72 $27,550 $24,185 $23,063 72 72 72
$14,999 88 $27,550 $24,185 $23,063 88 88 88
$24,999 232 $27,550 $24,185 $23,063 232 213 187
$34,999 351 $27,550 $24,185 $23,063 90
$49,999 406 $27,550 $24,185 $23,063
$74,999 703 $27,550 $24,185 $23,063
$99,999 448 $27,550 $24,185 $23,063
$149,999 720 $27,550 $24,185 $23,063
$199,999 368 $27,550 $24,185 $23,063
Above
352 $27,550 $24,185 $23,063
$200,000
Census
3740 482 373 347
Tract Totals
% of
12.88% 9.98% 9.28%
Households
P a g e | 21You can also read