Upper Snake River Basin
Water Stewardship Assessment

4/15/2014
←
→
Page content transcription
If your browser does not render page correctly, please read the page content below
Upper Snake River Basin Water Stewardship Assessment 4/15/2014
Upper Snake River Basin Water Stewardship Assessment

1. EXECUTIVE SUMMARY

1.1   PURPOSE
Concerns about the adequacy of water supplies in the Upper Snake River Basin date nearly from the
start of the first irrigation withdrawals in the late 1800s. Considerable documentation describes the
development of irrigated agriculture and the resultant complexities of surface water and ground
water management in the area, particularly at the basin scale. This report presents a view of these
challenges through a particular lens—companies with significant but indirect agricultural
dependency.

The purpose of this report is to assess the major water resource challenges and opportunities
within the Upper Snake River Basin. This water resource assessment is then evaluated from the risk
perspective of companies that depend on agricultural products. There is considerable interest in
both fostering sound water stewardship and mitigating possible supply chain risks for companies
that source crops in the region. We propose recommendations towards achieving both these goals.
Importantly, we also identify key stakeholders that must be engaged throughout the
implementation of water stewardship activities.

1.2   BASIN REVIEW
The Upper Snake River Basin is characterized by one of the largest and most productive aquifers in
the country. Even in the absence of development, the Eastern Snake Plain Aquifer (ESPA) is highly
connected to surface water, both gaining from and losing water to streams and creeks throughout
the aquifer.

Within this complex hydrologic backdrop developed one of the most productive agricultural
regions in the country. Beginning in the late 1800s, extensive irrigation systems were built to
compensate for inadequate growing-season precipitation. With the construction of major
reservoirs, agriculture expanded quickly in the first half of the 20th century. Agricultural
development has created a highly modified water balance within the basin, diverting large volumes
of surface water for irrigation and incidentally increasing aquifer storage in the process.

By the 1950s, new pump and irrigation technology allowed farmers to more easily irrigate cropland
with ESPA groundwater. In the 1970s and 1980s, improvements in irrigation efficiency reduced
incidental recharge from surface irrigation. Periods of severe drought also occurred in the past
several decades. These events reversed the trajectory of aquifer storage and began a trend of
aquifer depletion that continues today. Declines in ESPA storage levels have in turn resulted in
decreased discharges from groundwater to surface water.

In light of declining aquifer storage, the Conjunctive Aquifer Management Plan (CAMP) was
developed by the State of Idaho to comprehensively manage the basin to mitigate future water risk.
The plan proposes implementation of specific mitigation activities over the next 30 years, including
aquifer recharge, groundwater to surface water conversion, and demand reduction.

                                                                                                    2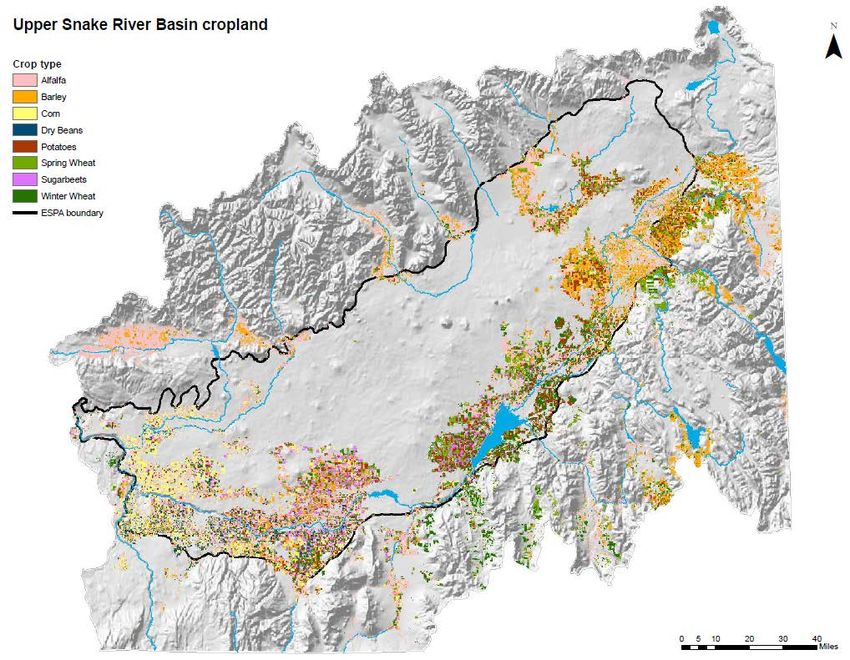
Upper Snake River Basin Water Stewardship Assessment

1.3       SUSTAINABILITY ASSESSMENT
As a result of declining ESPA discharges to springs and streams, surface water users have begun to
face significant water shortages. In order to protect their water rights, these surface water users
have sought regulatory relief through the curtailment of junior water rights held by ESPA
groundwater users. The outcome is an environment of increasing water supply insecurity,
particularly for groundwater users.

Growers in the Upper Snake River Basin face a number of additional water-related risks in addition
to water scarcity.

      •    Water quality concerns continue to grow in the basin, particularly regarding nutrient and
           sediment pollution in the Twin Falls area.
      •    Fish and wildlife are increasingly vulnerable to decreased stream flows and reduced water
           quality.
      •    Future climate change is expected to increase water scarcity through decreased snowfall
           and increased temperatures.

The complexities of conjunctive (both surface and ground water) management necessarily tie the
fates of all water users in the basin. While groundwater-dependent users are already being
impacted, all water users in the basin will face increasing uncertainty—whether due to decreased
water availability or the impacts of potential future litigation and regulation.

1.4       WATER STEWARDSHIP RECOMMENDATIONS
For companies engaged in water stewardship in the agricultural supply chain, the most immediate
question is how to mitigate anticipated water resource impacts in order to reduce risks to growers.

We identify four categories of possible water stewardship activities: stakeholder engagement,
water quantity mitigation, water quality improvement, and fish and wildlife protection. These
categories correspond to the major sources of risk. Within these categories, there are on-field and
off-field opportunities to implement water stewardship activities.

Implementation of the CAMP, already in its fifth year, has established a clear set of water resource
management priorities and determined the primary measures for implementation. As feasible,
corporate water stewardship activities should be aligned with this effort, leveraging existing
stakeholder buy-in to achieve outcomes that both reduce supply chain risks and support CAMP
objectives.

A key conclusion of this assessment is that improvements in irrigation efficiency must be
considered carefully with regard to potential impacts—both beneficial and adverse. For
groundwater users, there are likely limited opportunities for significant efficiency gains. For surface
water users, changes in irrigation practices could further exacerbate water shortages. Such changes
need to be considered with respect to overall basin sustainability, local hydrologic conditions, and
the significance of co-benefits such as pollution mitigation.

                                                                                                       3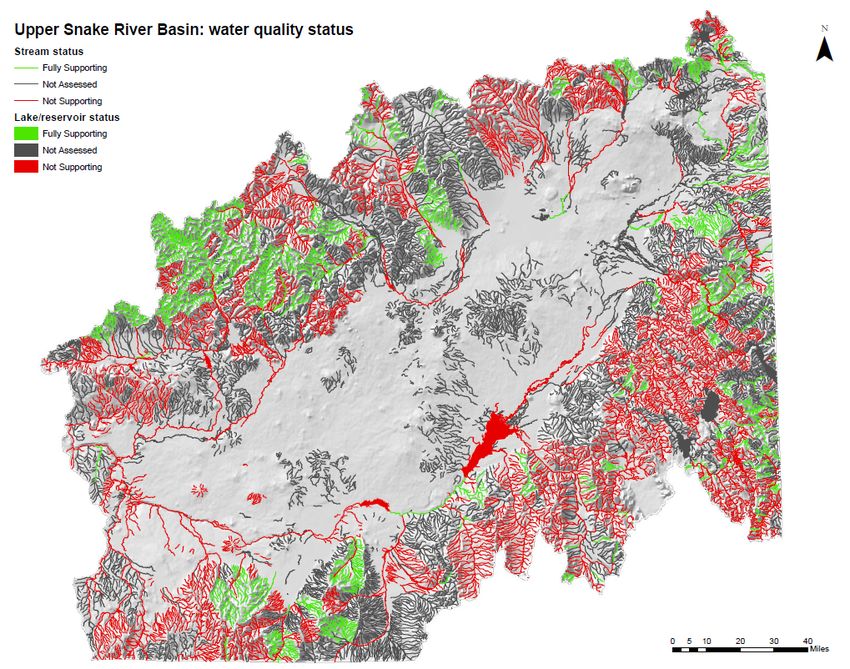
Upper Snake River Basin Water Stewardship Assessment

Outlined below are general water stewardship actions that can be developed by companies to
support supply chain risk mitigation in the Upper Snake River Basin. These recommendations are
intended to guide the development of more detailed stewardship planning efforts.

(1) Clarify water stewardship objectives relative to the identified categories of water risk and the
    scale of desired sustainability outcomes.

(2) Engage stakeholders to develop a coordinated action plan for corporate water stewardship
    activities in the basin.

(3) Coordinate with the CAMP implementation process and multi-stakeholder committee to ensure
    alignment of objectives.

(4) Assess water supply sources and on-field practices for supply chain connected growers to
    determine risk mitigation potential.

(5) Prioritize on-field water use activities that maximize co-benefits such as reduced pollutant
    loading or increased stream flows.

                                                                                                       4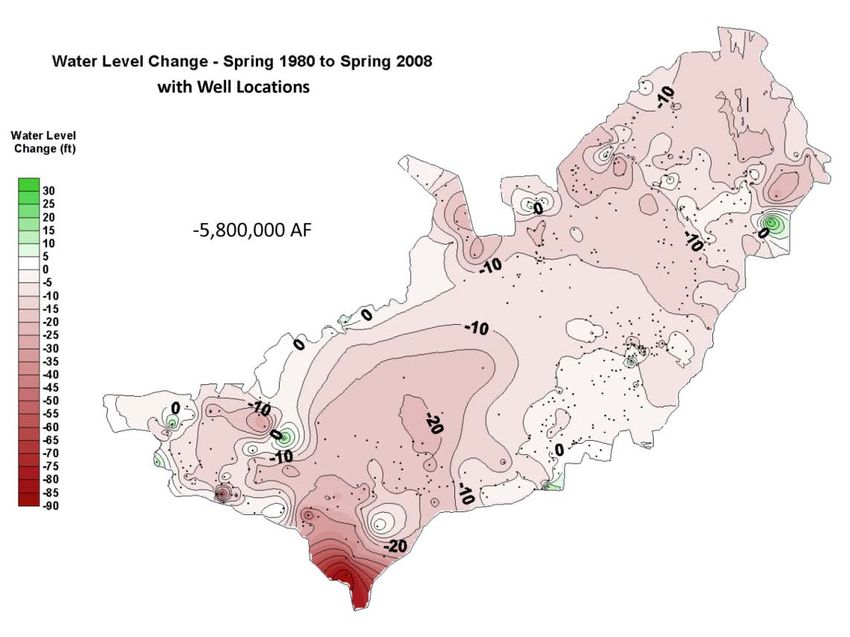
Upper Snake River Basin Water Stewardship Assessment

CONTENTS
1.     EXECUTIVE SUMMARY .............................................................................................................................. 2
     1.1      Purpose............................................................................................................................................................. 2
     1.2      Basin review.................................................................................................................................................... 2
     1.3      Sustainability assessment .......................................................................................................................... 3
     1.4      Water stewardship recommendations.................................................................................................. 3
2.     INTRODUCTION ........................................................................................................................................... 6
     2.1      Overview ......................................................................................................................................................... 6
     2.2      Approach.......................................................................................................................................................... 6
3.     PART I: BASIN REVIEW ............................................................................................................................... 7
     3.1      Watershed overview ................................................................................................................................... 7
     3.2      Water resources......................................................................................................................................... 10
     3.3      Water use ..................................................................................................................................................... 16
     3.4      Water administration and management............................................................................................ 20
4.     PART II: SUSTAINABILITY ASSESSMENT AND STEWARDSHIP PLANNING..........................26
     4.1      Sustainability assessment ....................................................................................................................... 26
     4.2      Stewardship planning ............................................................................................................................... 32
     4.3      Conclusions .................................................................................................................................................. 41
5.     REFERENCES ................................................................................................................................................ 44

           Prepared by The Nature Conservancy with support from the General Mills Foundation.

     Special thanks to Rob Van Kirk from the Henry’s Fork Foundation who contributed significant
                             review and discussion to support this report.

                                                                                                                                                                                  5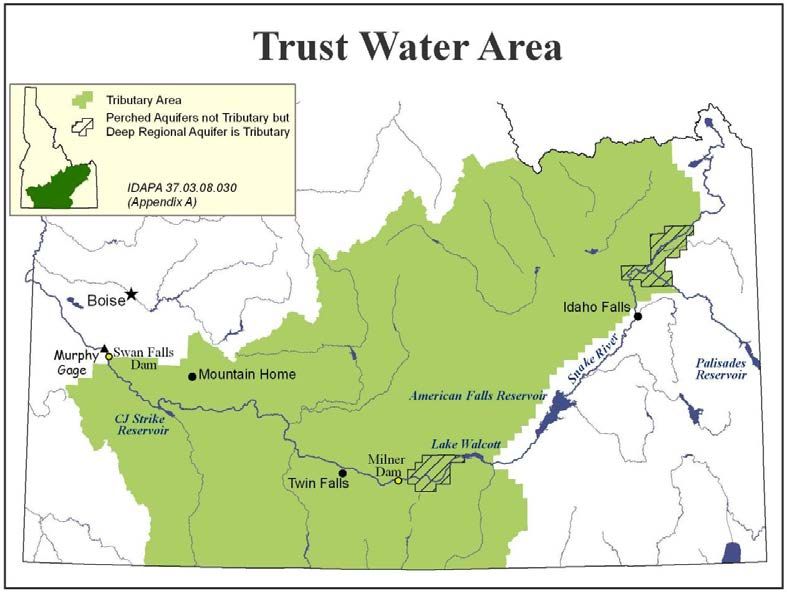
Upper Snake River Basin Water Stewardship Assessment

2. INTRODUCTION

2.1   OVERVIEW
This report presents a sustainability assessment and stewardship plan for the Upper Snake River
Basin in Idaho. The Upper Snake River Basin was selected due to its significance as a major growing
region in a basin with apparent water availability concerns. Part I provides an overview of water
resources in the Upper Snake River Basin. This section of the report also describes the governance
and management landscape. Part II presents an assessment of water resource sustainability relative
to current and future risks. The report then reviews the major types of stewardship activities that
could mitigate this water risk. The report concludes with recommendations for companies that
recognize the value in corporate stewardship for mitigating water risk.

2.2   APPROACH
The Upper Snake River Basin is undeniably a complex water system, whether in terms of hydrologic
processes or water allocation. Describing the full complexity of the basin and its management is
beyond the scope of this report. In defining the purpose of this document, we have chosen an
approach that focuses on identifying the key challenges most relevant to corporate water
stewardship and supply chain considerations in the Upper Snake River Basin.

The original proposal for this assessment focused on the eastern plain area from Rexburg to
American Falls. However, hydrologic and administrative boundaries generally include a larger
geographic area. Accordingly, the available information and data sources reported here generally
refer to Upper Snake River Basin at large or the Eastern Snake River Plain Aquifer.

For this assessment, we have utilized reports and research from key institutions in the basin
including Idaho Department of Water Resources (IDWR), U.S. Geological Survey (USGS), and the
University of Idaho. We have also consulted expert opinion from key stakeholders involved in the
science and management of the basin.

The results and recommendations presented in this report are intended to describe the range of
available opportunities for corporate water stewardship. Additional planning processes will be
necessary to further define specific stewardship actions.

                                                                                                   6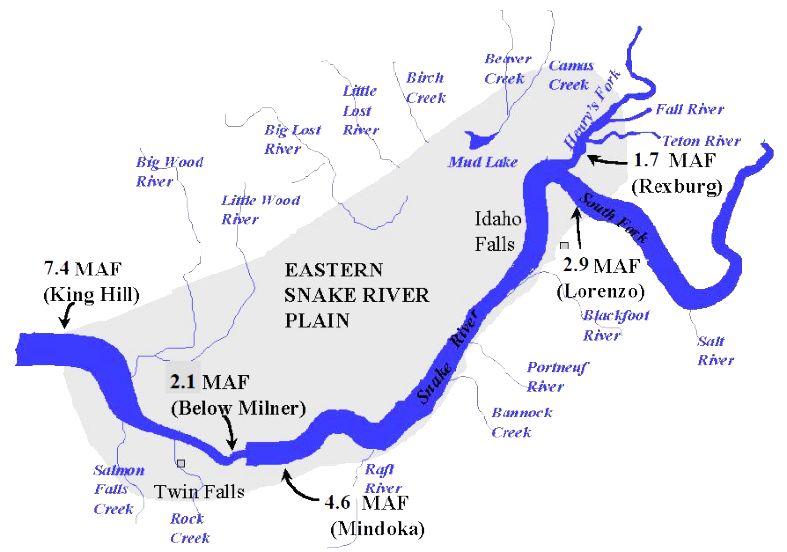
Upper Snake River Basin Water Stewardship Assessment
3. PART I: BASIN REVIEW
3.1 WATERSHED OVERVIEW
3.1.1 Basin at a glance
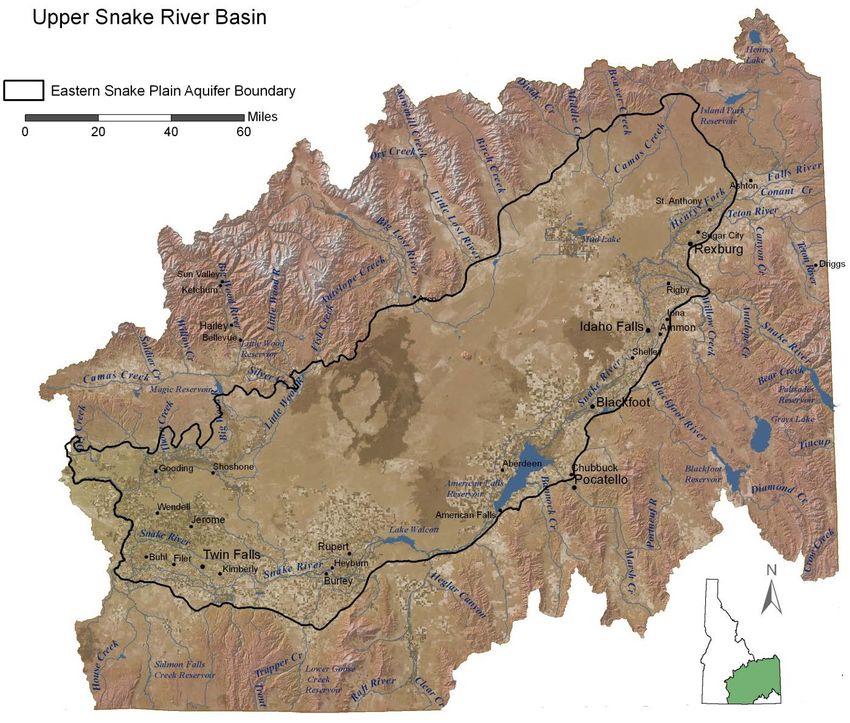
The Idaho segment of the Upper Snake River Basin1 extends from basin headwaters at the
Wyoming border to King Hill, where the river emerges from a deep canyon incised into lava rock.
Major hydrologic components include the Snake River, the Eastern Snake River Plain Aquifer
(ESPA), Malad River drainage, and Salmon Falls Creek (Figure 1). The basin covers an area of
approximately 35,800 square miles in eastern Idaho—more than 40% of the state—with the ESPA
itself comprising 10,800 square miles of that total (Van Kirk 2008, Konikow 2013).
More than 500,000 people live in the Upper Snake River Basin. The most recent State inventory of
the basin indicates that the population is increasing at a modest annual rate of 1-2 percent (IWRB
1998).
The climate is arid to semiarid with sagebrush and bunch grasses dominating the natural
landscape. Within the eastern plain, annual precipitation is low (8 to 10 in.). Precipitation during
the growing season is negligible with the system largely dependent on winter and early spring
precipitation in tributary watersheds. Mountain ranges north and east of the ESPA receive 40 to 60
inches of precipitation annually, primarily as snowfall (IWRB 1998, USGS 1992). A smaller but still
significant amount of precipitation falls on mountain ranges to the south. Regional and global
climate variability also drive precipitation (Van Kirk 2008). Several periods of widespread drought
have occurred in the past 100 years including periods of severe drought in 1987–1992 and 2000–
2007 (USACE 2009, Wise 2010).
One of the most prominent hydrologic features of the Upper Snake system is the strong connection
between surface and ground water. Tributaries to the north and east of the ESPA (approximately
from Ashton to Sun Valley) terminate on the eastern Snake Plain and infiltrate into the large
volcanic rock aquifer. The Snake River itself alternately contributes to and receives water from the
aquifer, depending on water table elevation and underlying geology.
1The Idaho segment of the Upper Snake River Basin is defined hydrologically as the region draining to the USGS gauge at
King Hill. Using this area allows for the full accounting of inflows and outflows within the basin, including groundwater. A
more restricted area upstream of Milner dam is also referred to as the “upper Snake River”. This area corresponds to the
administrative boundaries for all points of diversion and storage upstream of Milner dam. In this report, the “Upper Snake
River Basin” will refer to the larger area extending from headwaters to King Hill.
7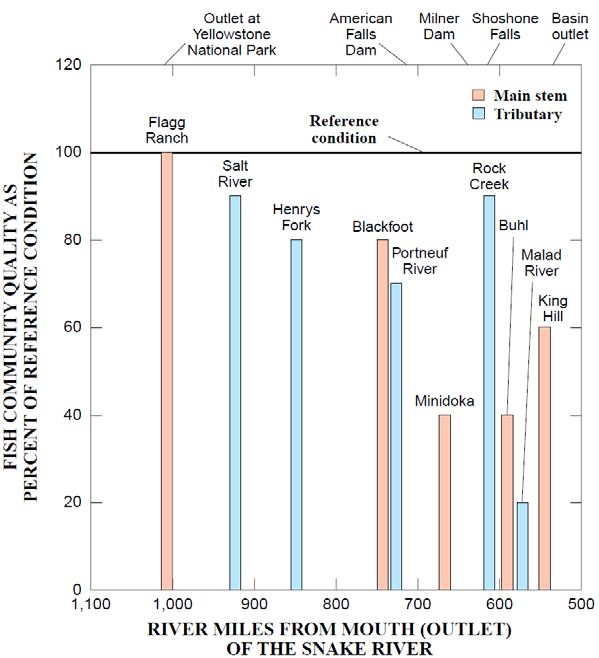
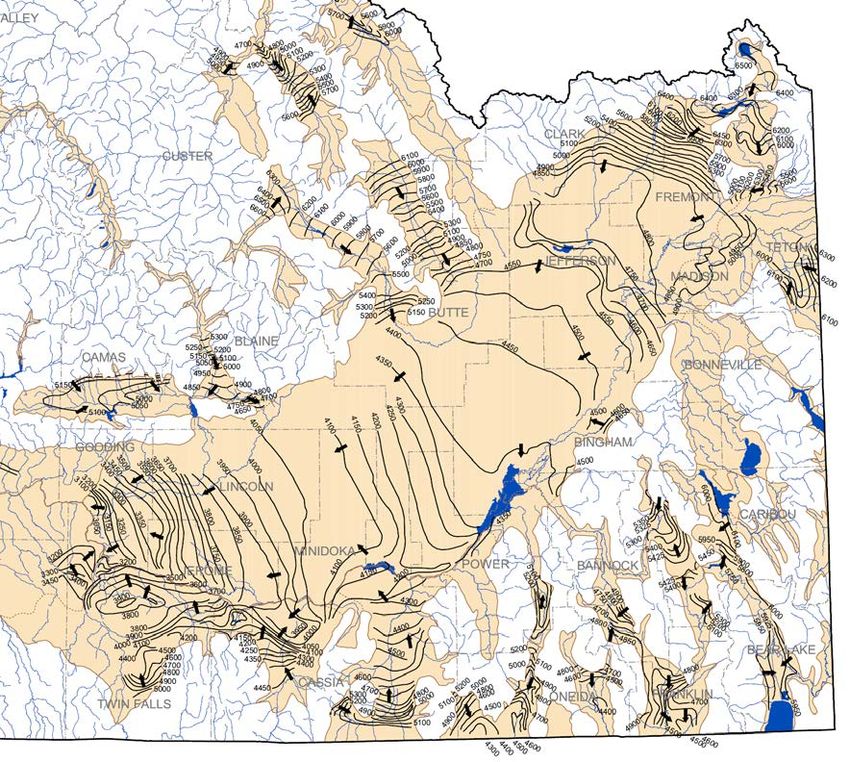
Upper Snake River Basin Water Stewardship Assessment

Figure 1. Map of the Upper Snake River Basin within Idaho. Also shown are Snake River tributaries and the ESPA
boundary (solid black line). From Idaho Department of Water Resources (IDWR).

3.1.2 Agriculture and industry
Agriculture and related agricultural services remain the primary economic drivers in the basin with
an estimated $10 billion in goods and services generated annually. Agriculture is both the largest
sector of the area economy and the biggest consumptive user of water. In the upper Snake basin,
there are nearly 2.9 million acres of harvested cropland which includes more than 2.4 million acres
of irrigated land. 2 The four largest crops by annual harvested area are hay, wheat, barley and
potatoes (Table 1).

2   Derived using county-level data from the 2007 USDA Census of Agriculture.

                                                                                                                 8
Upper Snake River Basin Water Stewardship Assessment
Crop Acres harvested Percent of total
Hay 917,567 32%
Wheat 664,789 23%
Barley 459,753 16%
Potatoes 289,680 10%
Corn 248,032 9%
Sugar beets 150,065 5%
Beans 42,782 1%
Other 121,723 4%
Table 1. Annual crop totals by acre harvested for the primary agricultural crops in Upper Snake River Basin
counties (2007 USDA Census of Agriculture).
Figure 2. Estimated growing locations for the region’s major crop types in the Upper Snake River Basin. Cropland
estimates are for the year 2012 and provided by the USDA Cropland Data Layer Program.
9Upper Snake River Basin Water Stewardship Assessment
Throughout the basin, hay and grains dominate the agricultural landscape (Figure 2). Adjacent to
and downstream of American Falls Reservoir, sugar beets, beans and corn are also important
commodities.
In addition to agriculture, dairy production and aquaculture are also important to the regional food
production industry. According to current estimates, the aquaculture industry in Idaho ranks as one
of the largest in the country producing 75% of domestically farmed trout. In the Upper Snake River
Basin, aquaculture facilities are concentrated in the Thousands Spring reach area near Twin Falls.
These businesses are highly dependent on sufficient and high quality spring discharge from the
ESPA (Slaughter 2012).
Major hydropower facilities also exist in the Upper Snake River Basin accounting for roughly a third
of the state’s hydroelectric production (total capacity is approximately 700 megawatts) (IWRB
1998). The largest hydropower facilities by total capacity are shown in Table 2. Hydropower
production is dependent primarily on reservoir operations and spring and early summer runoff.
Additional hydropower facilities further downstream on the Snake River are also dependent on
basin flows.
Facility name Stream Capacity (MW)
Palisades Snake River 176.6
American Falls Snake River 92.3
Bliss Snake River 75.0
Lower Salmon Snake River 60.0
Milner Snake River 59.5
Twin Falls Snake River 43.7
Upper Salmon Snake River 34.5
Gem State Snake River 23.4
Malad Malad River 21.7
Table 2. Major hydroelectric facilities by total capacity in the Upper Snake River Basin (after IWRB 1998).
3.2 WATER RESOURCES
3.2.1 Water availability
Surface water
Within the basin, surface water processes are highly modified from base or natural flow conditions.
Natural streamflow conditions that were once driven primarily by snowmelt have since become
carefully managed through diversions and reservoir operation in order to satisfy water user rights
(Van Kirk 2008).
In terms of total discharge, the headwaters of the Snake River account for the majority of
streamflow within the Upper Snake River Basin (Figure 3). The Henrys Fork is also an important
tributary to the system accounting for more than a quarter of average annual discharge. Additional
10Upper Snake River Basin Water Stewardship Assessment
tributaries along the perimeter of the ESPA account for the remainder of streamflow within the
system.
Figure 3. Schematic representation of the relative contribution of average annual discharge within the Upper
Snake River Basin, where thicker blue lines indicate greater reach discharge (from Cosgrove 2006).
Natural surface flows are driven primarily by mountain snow accumulations with the majority of
rainfall being lost as evapotranspiration (Van Kirk 2008). Under natural streamflow conditions,
discharges are highest in the late spring during snowmelt and lowest during fall and winter. The
result of flow regulation for irrigation and power generation purposes has been the augmentation
(increase) of base flows while peak flows have been diminished.
The largest storage reservoirs within the basin are located along the main stem of the Snake River
(Table 3). More than two-thirds of all reservoirs in the basin are operated by U.S. Bureau of
Reclamation, primarily serving purposes of irrigation and flood control. Additional objectives
include power generation, municipal and industrial withdrawals, recreation, and instream flows for
fish and wildlife. The management of storage reservoirs (i.e. the timing of filling and spilling) is
highly dependent upon the seniority of water rights. Additional discussion on water rights
administration is provided later in this report.
11Upper Snake River Basin Water Stewardship Assessment
Reservoir Completed Stream Purpose Storage (ac-ft)
American Falls 1978 Snake River Irrigation, Power 1,672,600
Irrigation, Flood,
Palisades 1957 Snake River 1,200,000
Power, Recreation
Jackson Lake 1916 Snake River Irrigation, Flood 847,000
Blackfoot 1911 Blackfoot River Irrigation, Municipal 350,000
Salmon Falls 1911 Salmon Falls Creek Irrigation 182,700
Island Park 1938 Henrys Fork Irrigation 135,200
Lake Walcott 1906 Snake River Irrigation, Power 95,200
Henrys Lake 1910 Henry's Lake Outlet Irrigation 90,400
Irrigation, Flood,
Ririe 1976 Willow Creek 80,500
Recreation
Oakley 1916 Goose Creek Irrigation 77,400
Milner 1906 Snake River Irrigation, Power 50,000
Table 3. Reservoirs in the Upper Snake River Basin with storage greater than 50,000 ac-ft, listed in order of
decreasing storage (after IWRB 1998).
Groundwater
Geologically, the ESPA is characterized by a history of volcanic activity. Following periodic episodes
of explosive volcanism associated with the Yellowstone hotspot, basaltic lava flowed across the
plain, becoming interspersed with gravel and ash. These basalt-dominated layers are highly
permeable to water and have created the conditions for one the largest and most accessible
aquifers in the United States (Konikow 2013). Wells drilled in the area indicate that the effective
aquifer depth is approximately 800-1,200 feet. Below this depth, geologic layers become
increasingly dense with less water storing capacity.
While generally considered to be highly permeable and unconfined, there remains considerable
heterogeneity within the aquifer geology (Garabedian 1992). Gravel and sand dominate the fringes
of the aquifer plain and are also associated with deposits of silt and clay. These deposits are less
permissive of water movement and can lead to locally isolated areas of perched or confined water
tables. Even in the central region of the Eastern Snake Plain dominated by basaltic rock, water
movement is non-uniform. Groundwater flow or conductivity tends to be the greatest along the
direction of lava flows and within basalt layer gaps. The general trajectory of water flow is
southwesterly but actual flow directions and velocities are highly dependent upon localized
geologic conditions (Figure 4). This is important to note when considering water management
actions since the timing and magnitude of specific hydrologic outcomes are not readily
generalizable.
12Upper Snake River Basin Water Stewardship Assessment
Figure 4. Generalized directions of groundwater flow in the ESPA area (from Graham and Campbell, 1981).
Due to the highly permissive underlying geology, the ESPA is a dynamic system with continual
fluxes in water storage. In contrast to confined or fossil aquifers, the ESPA water balance is
significantly influenced by recharge pathways. Aquifer recharge is dominated by incidental
recharge through irrigation losses—tributary underflow, precipitation, and streamflow seepage
also playing an important role. With irrigation losses accounting for more than half of the annual
aquifer recharge, the overall picture of the ESPA is a highly modified system influenced heavily by
agricultural water use practices.
Surface and groundwater interaction
The dominant hydrological characteristic of the basin is the dynamic interaction of surface and
groundwater. Along the length of the Snake River within the basin, the river and its tributaries
alternately gain and lose water between the larger ESPA and smaller perched aquifers. Additionally,
the direction and magnitude of these interchanges are often dependent upon stream flow volumes
and water table elevations. These patterns of surface and groundwater interaction have been well
described (IWRB 1998). But while the general patterns of connectivity are understood, the complex
13Upper Snake River Basin Water Stewardship Assessment
interactions of location, stream flow, and groundwater levels mean that predicting the impacts of
water management activities is highly context specific. For example, groundwater recharge
activities may actually augment stream flow rather than contribute to aquifer storage.
In addition to surface water interactions, the ESPA also feeds important springs near the American
Falls and Thousand Springs reaches of the Snake River. Discharge from these springs is
significant—Thousands Springs alone accounts for almost 40 percent of ESPA discharge (IWRB
1998). Below Milner dam, these springs can account for the entire flow within the Snake River.
Discharge at these springs is directly dependent upon aquifer storage, with higher discharges
occurring at higher aquifer storage levels.
3.2.2 Water quality
Surface water quality
In keeping with other water resource elements of the basin, the view of surface water quality
concerns is similarly mixed in the Upper Snake River Basin. In general, pollutants increase in
concentration in the downstream direction throughout the basin (Clark 1994). In particular,
pollutant concentrations are the highest at the mouths of tributary basins and in the reach between
Milner and King Hill (also known as the Middle Snake River).
In terms of pollutant types, nutrients, sediment, and pesticides are the most common contaminants
and all three are highly associated with agricultural practices. Farm fertilizer application
contributes more than two-thirds of the total budget for both nitrogen and phosphorous. Similarly,
evidence indicates that on-field practices can have significant impacts on sediment loads (IWRB
1998). Reservoirs act as sediment and nutrient sinks, concealing the full impact of land use
practices.
The most recent spatial data set available from the Idaho Beneficial Use Reconnaissance Program
(BURP) indicates that more than 70% of assessed streams and lakes do not meet beneficial use
criteria. 3 Of these assessed streams, more than 5,000 miles of streams are listed as 303(d) impaired
waters requiring determination of formal pollution limits. Causes for impairment determinations
include sediment, nutrients, pesticides, dissolved oxygen, thermal modification, habitat alteration,
and flow alteration. Several pollutant limits have already been developed for reaches throughout
the basin. The first pollutant limits or TMDLs (total maximum daily loads) were established for
reductions in total phosphorous with a recent status update report indicating that concentrations
have decreased very little (IDEQ 2013). Additional limits are expected to be phased in for other
pollutants including nitrogen and flow alteration.
A basin perspective indicates that agriculture is a major driver of water quality concerns in addition
to other point sources such as livestock production, food processing, and aquaculture operations.
The scale of these water quality impacts is heavily dependent on streamflow and connected aquifer
3 Beneficial use criteria are established by the State for specific stream reaches and lakes. Categories of beneficial use
include water supply, aquatic life, recreation, wildlife habitats, and aesthetics (IDEQ 2014).
14Upper Snake River Basin Water Stewardship Assessment
spring discharge. Considerable work remains for adequately mitigating pollutant concerns and the
agricultural sector will likely be an important stakeholder in this effort.
Figure 5. Current status (2010) of streams and lakes in the Upper Snake River Basin. Waters determined to be “not
supporting” of one or more beneficial use categories are highlighted in red. Data from IDEQ.
Groundwater quality
National, state, and regional groundwater quality programs have conducted monitoring in the
Upper Snake River Basin with most of the sampling focused on the Eastern Snake River Plain.
Overall groundwater quality in the basin is considered to be good in large measure due to the sheer
size of the aquifer and the relatively high recharge rate. However, there exist localized areas of
water quality pollution.
The vulnerability of groundwater supplies to pollutants is dependent on four primary drivers:
water table elevation, recharge or infiltration rate, soil type, and land use activities (IWRB 1998). A
review of the ESPA by Idaho’s Department of Environmental Quality (IDEQ) in 1991 found that
areas of greatest vulnerability were irrigated cropland with shallow or perched aquifers
underneath. Compounding concern about these most vulnerable areas is the fact that most
domestic wells source water from shallower groundwater depths.
15Upper Snake River Basin Water Stewardship Assessment
Nitrate levels are a particular concern across the ESPA with possible sources including fertilizers,
decaying organic matter, livestock facilities, and sewage discharge (IWRB 1998). Areas most
affected are located along the aquifer margins and the Thousand Springs area. The springs in
particular have been a focal area for continued monitoring after the observance of increasing
nitrate levels during the 1990s (IDEQ 2006). Estimates of nitrogen loading indicate that fertilizer
application and other agricultural activities may contribute more than half of total nitrate loads.
Other pollutants of concern in the ESPA are pesticides related to agriculture. Statewide monitoring
projects have focused on locations with both groundwater vulnerability and pesticide use.
Monitoring results in the Magic Valley area (near Twin Falls) indicated the detection of pesticides at
several well locations (ISDA 2009). The USGS National Aquifer Water Quality Assessment (NAWQA)
program has conducted a more comprehensive look at water quality in the ESPA (Frans 2012). Well
sampling beginning in 1992 has monitored 87 different pesticides. At least half of the sampled wells
indicated the presence of pesticides. The herbicide atrazine was the most commonly detected
pesticide, found in both domestic and public-supply wells. However, well samples indicated
contaminant levels were significantly below health concern thresholds.
3.3 WATER USE
3.3.1 History of water use
The history of water use in the Upper Snake River Basin is closely intertwined with American
settlement and the development of irrigated agriculture. Beginning with the 1862 Homestead Act,
national policy has driven the establishment of one of the country’s most significant agricultural
areas within an otherwise semi-arid landscape (Slaughter 2004). Even before the advent of federal
irrigation development programs, more than 300,000 acres of the basin were irrigated by surface
flow diversions (largely in the Henrys Fork, Upper Snake River, and Wood Rivers) (Garabedian
1992). By the early 1900s, diversions for irrigation demand were large enough to deplete entire
reaches of the Snake River (IWRB 1998). After passage of the 1902 Reclamation Act, land
development policy was buttressed with the construction of reservoirs, providing the necessary
enabling conditions for the agriculturally productive Upper Snake River Basin of today.
By the middle of the 20th century, most of the significant reservoir storage had been developed (Van
Kirk 2008). By this time, more than 500,000 acres were farmed using surface water diversions for
primarily flood and furrow irrigation. Total diversions were roughly 8 to 10 million acre-feet with
much of the irrigation water infiltrating into the aquifer or returning as stream flows (Garabedian
1992). An elaborate system of canals—primarily unlined with high leakage rates—had been built to
carry surface water to irrigated land. During this period, total ESPA storage actually increased
above baseline levels due to incidental infiltration of excess canal leakage and irrigation water.
Around this time, two significant changes in water use occurred. The first development was an
increase in the use of groundwater. Some of this groundwater was used to irrigate new farmland; in
other areas, farmers switched from surface to ground water supply (Figure 6).
16Upper Snake River Basin Water Stewardship Assessment
Figure 6. Historical changes in surface and ground water acreage in the ESPA (from Cosgrove 2006 after
Garabedian 1992).
Concurrent with increasing use of ESPA groundwater was a transition from gravity to sprinkler
irrigation. This increase in sprinkler irrigation was initially attributable primarily to groundwater
users but gained adoption by surface water users as well (Garabedian 1992). Irrigation application
efficiencies significantly increased while maintaining crop production levels (IWRB 1998). In part
as a result of these efficiency gains, surface water diversions began to decrease in the 1970s and
this trajectory continues today. These decreased surface water diversions have in turn decreased
the flow of irrigation-related infiltration to the aquifer.
The net result of these two changes—increased groundwater abstraction and decreased recharge
incidental to surface irrigation—has been a significant shift in the trajectory of ESPA storage.
Previous agricultural practices had steadily increased the available groundwater supply through
infiltration of surface water into the aquifer. Mid-century changes in irrigation practices
precipitated a decline in aquifer storage for the first time since major farming activities began in the
basin. This continuing trajectory of aquifer storage is well evidenced through changes in aquifer
storage elevations since 1980 (Figure 7).
17Upper Snake River Basin Water Stewardship Assessment
Figure 7. Map showing groundwater elevation changes in the ESPA from 1980–2008 (from IWRB 2011).
3.3.2 Current water use
Agriculture remains the largest water user—both in terms of total withdrawal and consumptive
use—within the Upper Snake River Basin (Figure 8) (ESPA CAMP 2009). Currently, there are some
2.4 million acres of irrigated land in the basin including 2.1 million acres within the ESPA boundary
(Van Kirk 2008, ESPA CAMP 2009). Approximately 1 million acres are irrigated with surface water
upstream of Milner Dam and another 0.8 million acres are irrigated with ground water from the
ESPA. The remainder (0.6 million acres) is irrigated with a combination of surface and ground
water including tributaries on the perimeter of the ESPA.
In terms of total volume, an estimated 10.1 million acre-feet is withdrawn annually for irrigation
(Van Kirk 2008). More than half this total volume—about 6.6 million acre-feet—returns to the
system as aquifer recharge or return flows. The consumptive fraction of irrigation water use is
estimated at 3.7 million acre-feet annually, or roughly a third of total withdrawals.
18Upper Snake River Basin Water Stewardship Assessment
Figure 8. Estimates of sector water withdrawals for all 24 counties within the Upper Snake River Basin. Left panel
shows surface and ground water withdrawals in millions of gallons per day (Mgal/d) where numeric values indicate
total (surface plus ground) withdrawals. Right panel indicates sector withdrawals relative to overall surface and
ground water totals. Data are estimates from the USGS National Water Use Information Program in 2005.
Domestic, commercial, municipal, and industrial (DCMI) water use accounts for approximately
400,000 acre-feet annually (IWRB 1998). This figure includes a wide range of activities including
household use, public supply, food processing including sugar refining and potato processing, Idaho
National Engineering and Environmental Laboratory (INEEL) water use, and a range of commercial
water users. Fish hatcheries are the largest DCMI water user throughout the basin (235,000 acre-
feet in 1995). Relative to agriculture, DCMI is a small water user though projections expect this use
to increase with future population growth (IWRB 2009).
Volume
Basin irrigation flows
(million acre-feet)
WITHDRAWALS
Surface water in Water District 1 7.3
Groundwater from ESPA 1.2
All other surface and ground water 1.6
Total 10.1
RETURNS
Infiltration to ESPA 4.0
Other irrigation returns 2.6
Total 6.6
Table 4. Mean irrigation related flows within the Upper Snake River Basin from 1958-2007 (after Van Kirk 2008).
While irrigation continues to be the primary water user in the basin, other non-consumptive water
users are also economically significant (Van Kirk 2008). Hydropower generation is also important
19Upper Snake River Basin Water Stewardship Assessment
water user and factors significantly in the management of reservoirs (Van Kirk 2008). Additionally,
an economically important recreational fishing industry is dependent upon surface water flows,
particularly in the upper tributaries of the basin (Loomis 2006).
3.4 WATER ADMINISTRATION AND MANAGEMENT
3.4.1 Water rights
Historically, water rights were established simply by meeting beneficial use requirements. 4 Since
1963 for groundwater and 1971 for surface water, water rights can only be established through a
formal permitting and licensing procedures (IDWR 2014). Following the prior appropriation
doctrine, Idaho manages rights according to the “first in time is first in right” approach typical of
many western states (Tuthill 2013). Under this system, water is delivered in order of decreasing
priority where the oldest water rights have the highest priority.
In 1987, IDWR began administering an adjudication process to formally define all water rights in
the Upper Snake River Basin including historical or beneficial use rights. Since 1992, the Idaho
Department of Water Resources has maintained a moratorium on the processing and approval of
water development permits in the Snake River Basin above Weiser (IWRB 1998). The basin is
considered closed, precluding the addition of new significant water users (some exceptions exist for
domestic, stock, and municipal users).
In the Upper Snake River Basin, three categories of water rights exist: natural flow, storage water,
and groundwater. Within the basin, more senior natural streamflow rights are located
predominantly in the Magic Valley area downstream of Milner and in the Henrys Fork Basin. Almost
all groundwater rights are junior to both natural flow and storage water rights. Each type of water
right is administered differently:
• Natural flow rights refer to diversions of natural stream or spring flows and are
quantified in terms of instantaneous stream discharge (cubic-feet per second).
• Storage water rights refer to surface water stored in and released from reservoirs.
Storage water rights are quantified in terms of annual storage (acre-feet per year).
• Groundwater rights are quantified in terms of pumping rates (cubic-feet per second).
Water rights are additionally defined with regard to the purpose, season of use, point of diversion,
and place of use. For most irrigation water rights, water use is restricted to the growing season
from April through October. While water rights are generally associated with real property rights, it
may be possible to transfer or change a right relative to the point of diversion, place of use, period
4Beneficial uses include irrigation, stock-watering, manufacturing, mining, hydropower, municipal use, aquaculture,
recreation, and fish and wildlife (IDWR 2014).
20Upper Snake River Basin Water Stewardship Assessment
of use, or nature of use. Such changes require formal consideration by IDWR to ensure, among other
considerations, that the change does not injure other water rights. 5
Previously, surface water rights were managed separately from groundwater. Events in the 1990s
and early 2000s set in motion a shift towards joint or conjunctive management of both surface and
ground water. 6 The water rights adjudication process initiated in 1987 led IDWR to exercise
authority over groundwater rights administration in the Thousand Springs and American Falls
areas. Also around this time, concerns were growing about the impact of groundwater pumping on
spring flows, eventually culminating in legal petitions or “delivery calls” by senior surface water
users against groundwater users (Slaughter 2012).
As a result of these changes, both surface and groundwater diversions are now conjunctively
managed according to water right priority dates. In years when insufficient water is available to
meet all water rights, IDWR seeks to mitigate impacts to senior water users through an
administrative process that includes the possibility for negotiation, mitigation, or curtailment. In
this environment of water insecurity, groundwater users have sought to protect their rights
through litigation and mitigation (Slaughter 2012).
One avenue for groundwater mitigation has been the purchase of unused reservoir water (Whelan
2013). Storage water right holders can lease their rights into a State managed rental pool. Under
threat of curtailment, groundwater users have utilized this rental pool water to mitigate the
impacts of pumping on surface water flows in the Thousand Springs area (Patton 2012). While
rental pool water offers the opportunity to offset surface water discharge impacts, there is
considerable uncertainty with this approach. Such mitigation is dependent on adequate water
availability and subject to administrative restrictions including priority for certain users and point
of use locations (IDWR 2013).
The end result of the shift to conjunctive management is an environment of considerable
uncertainty and risk. The existing administrative and legal tools offer incomplete, and costly,
remedies for addressing these conflicts.
3.4.2 Water institutions and management
There are a number of institutions, both state and private, that are responsible for the management
and delivery of water resources. Described below are the key organizations that play an active role
in basin water management activities.
5IDWR utilizes a complex spreadsheet tool based on aquifer modeling data in order to determine the hydrologic impacts
resulting from any proposed water right change.
6The legal basis for conjunctive surface and ground water management is codified in the 1951 Idaho Ground Water Act
which called for restrictions where groundwater abstraction affects senior water rights or is in excess of natural recharge
rates.
21Upper Snake River Basin Water Stewardship Assessment
Idaho Department of Water Resources
The Idaho Department of Water Resources (IDWR) is the primary State agency responsible for the
management of water resources. IDWR manages a number of programs including comprehensive
basin planning, minimum stream flow assessment, water project financing, water supply banks and
water rentals. In the Upper Snake River Basin, IDWR also oversees the delivery and distribution of
water through the authority of water districts.
Idaho Water Resources Board
The Idaho Water Resource Board (IWRB) was created by the Idaho Legislature in 1965. Comprised
of eight members appointed by the governor, the Board was initially charged with development and
implementation of the state water plan. In 1974, the Board and the existing Department of Water
Administration were combined to form the present-day Idaho Department of Water Resources.
The Board, with assistance from IDWR Planning and Technical Division staff, is involved in court
appeals, adoption of administrative rules, water bank administration, state water planning, and
negotiations with the Federal government and Indian Tribes.
Bureau of Reclamation
The US Bureau of Reclamation manages eight dams through its Upper Snake Field Office: Little
Wood River, American Falls, Grassy Lake, Island Park, Jackson Lake, Minidoka, Palisades, and Ririe
Dams. Reclamation manages these dams primarily for irrigation purposes (based on water rights)
but also considers secondary factors such as flood control, hydropower, fish and wildlife, and
recreation (Van Kirk 2008). Reservoir operation rule curves can have significant impacts on stream
flow in reaches throughout the basin.
Water is stored in the reservoir system and accrued to storage water rights according to the prior
appropriation system. Generally, water is stored in the highest-elevation reservoirs first regardless
of where the water right is held. To the greatest extent possible, downstream reservoirs are
depleted first, regardless of the physical location of the water right. If and when a storage right is
exhausted, the user may obtain and use additional storage water, if available, through the Upper
Snake rental pool. The practice of storing water as high in the system as possible throughout the
year maximizes water availability and minimizes the probability that water will be spilled at Milner
Dam. 7
State water districts
The State has created water districts, overseen by Watermasters, which are responsible for
delivering water to ditches, canals, and other diversion points (Tuthill 2013). Water District 1 is the
largest in the state and includes most of the Upper Snake River Basin upstream of Milner Dam.
Actual water allocations are determined on a daily basis utilizing a computer-based system to
manage the more than 300 diversion points (IDWR 1997). The general procedure is to “calculate
7The Snake Basin has historically been managed according to the “two rivers” concept, whereby all flows upstream of
Milner dam are managed independently of those downstream. The result is to effectively set a zero flow target at Milner
dam (Tuthill 2013, Van Kirk 2013). Additionally, this has important implications for the management of water rights
whereby upstream appropriations are managed independently from those downstream.
22Upper Snake River Basin Water Stewardship Assessment
natural flows, allocate those flows in order of priority… and then determine stored water used and
storage supplies remaining”.
Beginning in 2002, water districts have also been created for the management of groundwater
distribution. Watermasters in these districts are responsible for diversion monitoring and
enforcement of mitigation or curtailment actions (Tuthill 2013).
Irrigation districts
One of the oldest formal water user groups, irrigation districts primarily serve to develop irrigation
projects including construction of canals and other infrastructure (IDWR 2014). These districts also
oversee the delivery of water to irrigation users. An important distinction is made between state
authorized irrigation districts versus canal companies which are private corporations with the
primary function of delivering water to shareholder members. In the Upper Snake River Basin,
there are at least 10 irrigation districts and nearly 100 private irrigation companies (Van Kirk
2013).
Ground water districts
Similar to irrigation districts, ground water districts are organized groups of groundwater users
having state authority to construct and operate water resource projects (Tuthill 2013, IDWR 2014).
One of the primary purposes of ground water districts is to “develop and operate mitigation plans
designed to mitigate” adverse impacts to senior water uses caused by groundwater abstraction.
Such mitigation activities typically include the acquisition of unused water and the implementation
of aquifer recharge projects. Nine ground water districts have been established within the ESPA.
3.4.3 Conjunctive Aquifer Management Plan
With projections of decreasing aquifer storage and growing conflicts between senior and junior
water users, the State legislature directed the Idaho Water Resources Board to develop a
comprehensive management plan for the ESPA. The Conjunctive Aquifer Management Plan (CAMP)
is the result of this process and describes the goals, objectives, and proposed implementation
actions for aquifer management (IWRB 2009). The plan recommendations reflect the perspectives
of a broad group of stakeholders and serve to balance feasibility constraints with improvements in
water management outcomes, focused primarily on securing adequate water supply for all users. 8
The CAMP establishes short and long-term targets for managing water use within the ESPA towards
“stabilizing and improving spring flows, aquifer levels, and river flows” (Table 5). This phased
implementation process reflects the complexity of the system and the need to carefully monitor the
impact of implemented measures. The short-term or Phase I target is an annual increase in aquifer
storage by 300,000 acre-feet within the first 10 years of implementation. The long-term target for
aquifer storage is an annual increase of 600,000 acre-feet by 2030.
8It is important to note that environmental objectives (including environmental flows) are not well defined within the
context of CAMP (Whelan 2013). Allowance is made within adaptive management provisions for further defining
environmentally-related activities and outcomes.
23Upper Snake River Basin Water Stewardship Assessment
The cost estimate for implementing Phase I is estimated at $70–100 million over 10 years.
Achieving the long-term objective is estimated to cost more than $600 million. Importantly, the
CAMP recommendations are largely unfunded with proposed water user funding still under
development. There exists considerable interest in developing alternative funding mechanisms to
achieve these objectives including participation from private businesses (Tuthill 2012).
Short-term annual target Long-term annual target
Action
(thousand acre-feet) (thousand acre-feet)
Ground to surface water conversion 100 100
Managed aquifer recharge 100 150-250
Demand reduction 250-350
Surface water conservation 50
Crop mix modification 5
CREP and other fallowing 40
Buy outs and buy downs No target
Weather modification 50 No target
Table 5. Summary of proposed activities and associated annual hydrologic targets for CAMP short- and long-term
objectives (after IWRB 2009).
The most recent progress report on CAMP implementation indicates that more than $52 million has
been spent on aquifer management activities since plan inception (IWRB 2013). Activities
amounting to more than 175,000 acre-feet per year have been successfully implemented. These
activities are comprised primarily of managed aquifer recharge (117,111 acre-feet per year on
average) with contributions from ground water conversion and demand reduction (Table 6).
Importantly, not all management activities will have equivalent outcomes on aquifer storage. There
is continued debate regarding the impact of aquifer recharge activities with some experts indicating
that recharge activities above American Falls may not significantly increase long-term storage
(Kruesi 2012).
Irrespective of the quantitative outcomes to date, the CAMP process has been highly successful in
demonstrating the feasibility of a collaborative and comprehensive approach to water management
in the Upper Snake River Basin. The State and other stakeholders have made significant time and
monetary investments to develop this plan. Where previously water user groups were atomized
and uncoordinated, the State has successfully implemented an established planning and
implementation framework supported by a diverse group of stakeholders. This effort presents an
ideal opportunity to engage in water stewardship within the basin—indeed, successfully
implementing water stewardship activities outside of this framework would likely be difficult.
24Upper Snake River Basin Water Stewardship Assessment
Table 6. Progress on CAMP implementation from 2009–2012. Note that volumes are not necessarily reflective of
direct increases in aquifer storage levels (from IWRB 2013).
25Upper Snake River Basin Water Stewardship Assessment
4. PART II: SUSTAINABILITY ASSESSMENT AND STEWARDSHIP
PLANNING
4.1 SUSTAINABILITY ASSESSMENT
Given the complexities of hydrology and management within the basin, it is not possible to point to
a single sustainability metric. Rather, it is necessary to consider physical water resource constraints
(water quantity and quality) within the greater sociological context (regulation, management, and
economic development) in order to characterize the future of water within the upper basin.
Highlighted below are the most significant water-related impacts expected to affect agricultural
production throughout the basin.
4.1.1 Aquifer depletion
Assessment of the sustainability of the Upper Snake River Basin reveals a system which has been
characterized as over-allocated except in years of above average precipitation (Whelan 2013). The
water budget deficit is most readily revealed by the trajectory of ESPA groundwater levels. Since
the 1950s, groundwater levels have been declining at an annual rate of at least 200,000 acre-feet
(Table 7). The current shortfall is likely even larger given the trajectory of increasing groundwater
abstraction, decreasing incidental surface water infiltration, and decreased water availability 9
(Figure 9).
Volume
Aquifer storage flows
(million acre-feet)
INFLOW
Irrigation infiltration 4.0
Tributary underflow and river seepage 2.2
Eastern tributaries 0.7
Total 6.9
OUTFLOW
Spring discharge 5.9
Groundwater pumping 1.2
Total 7.1
NET CHANGE -0.2
Table 7. Estimated average annual water budget for the Eastern Snake River Plain Aquifer (ESPA) from 1958-2007
(after Van Kirk 2008). Updated estimates for current values would show a greater annual deficit due to smaller
values for irrigation infiltration and spring discharge and larger values for pumping.
9 In addition to changes in water use, aquifer storage is also highly responsive to drought conditions (IWRRI 2004).
26Upper Snake River Basin Water Stewardship Assessment
Figure 9. Cumulative change in aquifer storage for the ESPA from 1912-2008 (figure from IWRB 2013).From 1952–
1980, aquifer storage declined by 204,000 acre-feet per year. Since 1980, aquifer storage has declined by
approximately 220,000 acre-feet per year (from IWRB 2013).
If current trends in water use and availability continue, it can be expected that aquifer storage
levels will return to pre-irrigation levels by 2035. 10 Beyond that point, continued groundwater
abstraction will deplete aquifer storage below even pre-irrigation levels.
4.1.2 Water user conflict
In terms of risk, aquifer depletion is not the most immediate concern as total storage is estimated to
be at least 200-300 million acre-feet, roughly the size of Lake Erie (IDEQ 2006b). Rather, it is
departure from peak aquifer storage levels and the consequent effects on surface water users that
is primarily driving management concerns. While total aquifer storage levels remain above pre-
irrigation levels, the decrease in cumulative storage has already impacted water users dependent
on ESPA spring discharges. It is estimated that changes in water use practices have collectively
decreased spring discharge and stream flows by more than 1.4 million acre-feet annually since the
1950s (Johnson 1999, IDWR 1997). In particular, groundwater pumping is estimated to have
depleted annual discharges by 900,000 acre-feet.
The situation is further affected by inter-annual precipitation variability, with wet and dry years
driven by decadal climate patterns and long-term climate change (Van Kirk 2008). In years with
above average precipitation, few shortages exist for any water users (Van Kirk 2013). In average or
below average years, curtailment or other mitigation is necessary in order to ensure the fulfilment
of more senior surface water rights.
10This assumes that changes in water use and availability continue. It is more probable that a new equilibrium or steady
state will be reached where water use practices stabilize. However, changes in availability will still impact aquifer storage.
27Upper Snake River Basin Water Stewardship Assessment
Water rights were appropriated in accordance with the prevailing hydrologic conditions at that
time. As such, water rights are necessarily dependent upon these historical water balance
conditions. In the case of some natural flow users, fulfillment of their water right allocations is
directly dependent upon adequate ESPA spring discharge which is in turn driven by groundwater
elevations. The decline in aquifer levels since the 1950s has had the effect of reducing spring and
stream flows and consequently impacting the ability of surface water users to utilize their full water
rights (Figure 10).
Figure 10. Spring discharges below Milner Dam are driven by ESPA storage levels and have been heavily influenced
by irrigation returns flows infiltrating into the aquifer. Since 1950, spring discharges have begun decreasing as
groundwater use and irrigation efficiency increased (from Clark 1998).
That groundwater pumping has contributed to the decline in aquifer storage and the consequent
decreases in spring discharge is not disputed. Given the detailed hydrologic monitoring and
modeling developed for management of the ESPA, it is even possible to estimate the magnitude of
these impacts attributable to groundwater pumping. However, groundwater abstraction is not the
only factor causing the decline in aquifer levels. As discussed previously in History of water use,
changes in irrigation practices have caused declines in incidental groundwater recharge and played
a part in declining aquifer levels.
Conflict first culminated in 1993 when spring water users near Hagerman formally petitioned
IDWR requesting curtailment of water withdrawals from junior water users (IWRRI 2012). Since
then, several litigious actions have been brought forth including a contentious 2005 petition made
by aquaculture businesses in the Thousand Springs area (Poppino 2008). That delivery call
28You can also read